User authentication and access rights management, activity history collection/analysis, and real-time resource status monitoring, etc. to provide services that can easily and conveniently manage Samsung Cloud Platform.
This is the multi-page printable view of this section. Click here to print.
Management
- 1: Architecture Diagram
- 1.1: Overview
- 1.2: How-to Guides
- 1.3: Release Note
- 2: Cloud Control
- 2.1: Overview
- 2.2: How-to guides
- 2.2.1: Managing Guardrails
- 2.2.2: Managing an Organization
- 2.3: API Reference
- 2.4: CLI Reference
- 2.5: Release Note
- 3: Cloud Monitoring
- 3.1: Overview
- 3.2: How-to guides
- 3.2.1: Using the Monitoring Dashboard
- 3.2.2: Analyzing Performance
- 3.2.3: Analyzing Logs
- 3.2.4: Managing Events
- 3.2.5: Using Custom Dashboards
- 3.2.6: Managing Agents
- 3.2.7: Appendix A. Monitoring Targets by Service
- 3.2.8: Appendix B. Performance Items by Service
- 3.2.9: Appendix C. Service-specific status check
- 3.3: API Reference
- 3.4: Release Note
- 4: IAM
- 4.1: Overview
- 4.2: How-to Guides
- 4.2.1: User Group
- 4.2.2: User
- 4.2.3: Policy
- 4.2.4: Role
- 4.2.5: Credential Provider
- 4.2.6: My Info.
- 4.2.7:
- 4.3: API Reference
- 4.4: CLI Reference
- 4.5: Release Note
- 5: ID Center
- 5.1: Overview
- 5.2: How-to guides
- 5.2.1: ID Center User Management
- 5.2.2: ID Center User Group Management
- 5.2.3: ID Center Account assignment
- 5.2.4: ID Center Permission Set Management
- 5.2.5: ID Center Access Portal use
- 5.3: Release Note
- 6: Logging&Audit
- 6.1: Overview
- 6.2: How-to guides
- 6.2.1: Trail Management
- 6.3: API Reference
- 6.4: CLI Reference
- 6.5: Release Note
- 7: Notification Manager
- 7.1: Overview
- 7.2: How-to Guides
- 7.2.1: Notification Policy
- 7.3: Release Note
- 8: Organization
- 8.1: Overview
- 8.2: How-to guides
- 8.3: API Reference
- 8.4: CLI Reference
- 8.5: Release Note
- 9: Resource Explorer
- 9.1: Overview
- 9.2: How-to Guides
- 9.3: Release Note
- 10: Resource Groups
- 10.1: Overview
- 10.2: How-to Guides
- 10.3: Release Note
- 11: ServiceWatch
- 11.1: Overview
- 11.1.1: Indicator
- 11.1.2: Alert
- 11.1.3: Log
- 11.1.4: event
- 11.1.5: ServiceWatch linked service
- 11.1.6: Custom Metrics and Logs
- 11.2: How-to guides
- 11.2.1: Managing Dashboard and Widgets
- 11.2.2: Alert
- 11.2.3: Metric
- 11.2.4: Log
- 11.2.5: Event
- 11.2.6: ServiceWatch Agent Using
- 11.3: API Reference
- 11.4: CLI Reference
- 11.5: ServiceWatch Event Reference
- 11.5.1: ServiceWatch Event
- 11.5.1.1: Multi-node GPU Cluster
- 11.5.1.2: MySQL(DBaaS)
- 11.5.1.3: Global CDN
- 11.5.1.4: Data Flow
- 11.5.1.5: GSLB
- 11.5.1.6: Cloud Control
- 11.5.1.7: Cloud WAN
- 11.5.1.8: Object Storage
- 11.5.1.9: VPC
- 11.5.1.10: GPU Server
- 11.5.1.11: Virtual Server
- 11.5.1.12: Firewall
- 11.5.1.13: ID Center
- 11.5.1.14: Microsoft SQL Server(DBaaS)
- 11.5.1.15: Block Storage(BM)
- 11.5.1.16: Resource Groups
- 11.5.1.17: Cloud Functions
- 11.5.1.18: AI&MLOps Platform
- 11.5.1.19: Event Streams
- 11.5.1.20: Security Group
- 11.5.1.21: Archive Storage
- 11.5.1.22: API Gateway
- 11.5.1.23: Load Balancer
- 11.5.1.24: Data Ops
- 11.5.1.25: Scalable DB(DBaaS)
- 11.5.1.26: Cloud LAN-Campus
- 11.5.1.27: EPAS(DBaaS)
- 11.5.1.28: PostgreSQL(DBaaS)
- 11.5.1.29: Logging&Audit
- 11.5.1.30: Search Engine
- 11.5.1.31: DNS
- 11.5.1.32: VPN
- 11.5.1.33: Secrets Manager
- 11.5.1.34: Quick Query
- 11.5.1.35: File Storage
- 11.5.1.36: CacheStore(DBaaS)
- 11.5.1.37: Secret Vault
- 11.5.1.38: Queue Service
- 11.5.1.39: Kubernetes Engine
- 11.5.1.40: Config Inspection
- 11.5.1.41: Cloud LAN-Datacenter
- 11.5.1.42: Identity Access Management
- 11.5.1.43: Bare Metal Server
- 11.5.1.44: ServiceWatch
- 11.5.1.45: MariaDB(DBaaS)
- 11.5.1.46: Container Registry
- 11.5.1.47: Vertica(DBaaS)
- 11.5.1.48: Backup
- 11.5.1.49: Organization
- 11.5.1.50: Cloud ML
- 11.5.1.51: Certificate Manager
- 11.5.1.52: Key Management Service
- 11.5.1.53: Direct Connect
- 11.5.1.54: Support Center
- 11.6: Release Note
- 12: Support Center
- 12.1: Overview
- 12.2: How-to Guides
- 12.2.1: Inquiry
- 12.2.2: Support Plan
- 12.2.3: Knowledge Center
- 12.3: Release Note
- 13: Quota Service
- 13.1: Overview
- 13.2: How-to guides
- 13.3: Release Note
1 - Architecture Diagram
1.1 - Overview
Service Overview
Architecture Diagram provides a diagram form so that the relationships between resources can be grasped at a glance. You can check the connections between resources and examine the relationships between components.
Provided Features
Architecture Diagram provides the following functions.
- Provide resource composition status: It is visualized to easily check the relationships between configured resources.
- Check resource main information: You can view the resource’s main information from the Architecture Diagram without navigating to the resource detail screen.
Constraints
The constraints of the Architecture Diagram are as follows.
- We only provide services for some resources of the Samsung Cloud Platform.
- Provided services: VPC, Subnet, Virtual Server, Port, Security Group, Load Balancer
- Only up to 50 per resource can be viewed in the Architecture Diagram.
Pre-service
Architecture Diagram has no preceding service.
1.2 - How-to Guides
Users can intuitively grasp the relationships and key information of the resource configuration generated through the Architecture Diagram.
Architecture Diagram Start
To start the Architecture Diagram of Samsung Cloud Platform, refer to the following.
- All Services > Management > Architecture Diagram Click the menu. Architecture Diagram Go to the page.
- Samsung Cloud Platform’s Console Home page you can also navigate by clicking the Architecture Diagram widget.
- Check the resource configuration information and relationships in the Architecture Diagram.
- VPC,Subnet, Virtual Server Represent the relationship of the three types of resources in a diagram.
Notice
- If you do not have view permission for the topmost hierarchical structure among resources, the Diagram will not be displayed.
- Resources without diagram location information are displayed separately at the bottom of the diagram. Detailed status of the resource can be checked on each resource’s detail page.
Architecture Diagram Add Item
You can add items to the configuration diagram of the Architecture Diagram.
- All Services > Management > Architecture Diagram Click the menu. Architecture Diagram Go to the page.
- You can also navigate by clicking the Architecture Diagram widget on the Console Home page of Samsung Cloud Platform.
- Click the Search Filter button at the top right of the Diagram. Configurable items open as a popup menu in the Architecture Diagram.
- VPC, Subnet, Virtual Server items are provided by default.
- Port, Security Group, Load Balancer items, you can select which to add to the diagram.
Resource Basic status VPC Default - Displayed only if you have VPC permissions
Subnet Default Virtual Server Default Port Select Security Group Select Load Balancer Select Table. Architecture Diagram search filter items
Architecture Diagram Check resource detailed information
In the Architecture Diagram’s configuration diagram, you can view detailed information of each resource.
Notice
If user permission for the resource is not granted, you cannot view detailed information.
To check detailed information, follow the steps below.
- Click the All Services > Management > Architecture Diagram menu. Go to the Architecture Diagram page.
- You can also navigate by clicking the Architecture Diagram widget on the Console Home page of Samsung Cloud Platform.
- Click the resource in the Architecture Diagram to view detailed information. A detailed information popup for each resource will open.
- Click the control button at the top right of the Diagram to expand or collapse the Diagram, display it in a folded state, or zoom in/out.
- If you place the mouse cursor over a resource, the status of that resource and the resource name are displayed.
| Resource | Detailed Information |
|---|---|
| VPC | VPC name, Subnet name, IP range, Subnet type
|
| Subnet | VPC name, Subnet name, IP range, Subnet type
|
| Virtual Server | VPC name, Subnet name, Server name, IP, Security Group
|
| Port | VPC name, Subnet name, Port name, fixed IP address |
| Security Group | Security Group name, number of Security Group rules
|
| Load Balancer | VPC name, Subnet name, Load Balancer name, resource status, Service IP, Firewall name
|
Table. Architecture Diagram Resource Detailed Information Items
Reference
- If you select a specific resource of Port or Security Group, the information about that resource and related resources are displayed as dotted lines.
- Only the relationships of the total 6 types of resources (VPC, Subnet, Virtual Server, Port, Security Group, Load Balancer) are expressed.
- Each Virtual Server, Port, Security Group, Load Balancer resource can be displayed up to 100.
1.3 - Release Note
Architecture Diagram
2025.10.23
FEATURE
Add support resources- Load Balancer resources have been added.
2025.07.01
FEATURE
Architecture Diagram Feature Added- The relationship between resources can be easily identified by marking it with a dotted line.
- You can click the name of the resource in the resource detail information popup window to go to the detail page.
- Through Copilot, you can create VPC and Security Group services or control Virtual Server.
- You can easily add the Architecture Diagram item from the Configuration Diagram Filter.
2025.02.27
NEW
Architecture Diagram Release- Architecture Diagram service has been newly launched.
- Provides a service that can check the relationships between resources.
2 - Cloud Control
2.1 - Overview
Service Overview
Cloud Control service is a managed service that supports building, operating, and managing a multi-account environment easily and securely on the Samsung Cloud Platform.
Cloud Control service automates an organization’s cloud governance (security, compliance, standardization, etc.) and provides consistent centralized account and resource management based on Samsung Cloud Platform best practices.
Features
Cloud Control service provides the following special features.
- Landing Zone Automatic Setup: Samsung Cloud Platform accounts, organizational units (OU), guardrails, logging, etc. are automatically configured. In a standardized environment, new account creation and invitation of existing accounts are possible.
- Centralized Governance and Policy Enforcement: Automatically applies security, compliance, and operational policies (guardrails) across the organization. Provides policy violation detection and monitoring capabilities.
- Multi-Region and Scalability: You can apply the same governance and policies across multiple Samsung Cloud Platform regions.
Provided Features
Cloud Control service provides the following features.
- Automated Landing Zone (Landing Zone) Construction: Security, logging, and account structure based on Samsung Cloud Platform best practices are automatically set.
- Guardrail applied
- Preventive guardrail : block the creation of policy-violating resources itself
- Detective Guardrail : Automatically detect policy-violating resources and notify
- Integration with Samsung Cloud Platform Organization’s ACP, Samsung Cloud Platform Config Inspection, etc.
- Dashboard Provision: You can visually monitor the accounts, OUs, guardrail implementation status, and compliance status of the entire organization.
- Centralized logging and auditing
- Logging&Audit, Object Storage, Config Inspection through which provide centralized log storage for all accounts and an audit account
- ID and Permission Management Integration: By integrating with Samsung Cloud Platform ID Center, you can manage account-based access control and permission groups.
- Monitoring and Notification (Notification) Feature: Provides real-time alerts for policy violations, Cloud Control setting changes, etc.
Information
Detection Guardrail, Config Inspection integration feature is scheduled for March 2026, Monitoring and Alerting feature is scheduled for July 2026.
Components
Landing Zone(Landing Zone)
Governance, security, network, logging, etc. The basic structure of the standardized Samsung Cloud Platform environment is as follows.
| Category | Detailed description |
|---|---|
| Management Account |
|
| Log Account |
|
| Audit Account |
|
Table. Cloud Control Landing Zone
Guardrails(Guardrails)
The guardrails that automatically apply policy violation detection and prevention (detection/prevention type) rules, security and compliance standards are as follows.
| Category | Detailed description |
|---|---|
| Preventive Guardrail | Role of preemptively blocking to prevent policy violations
|
| Detection Guardrail | Continuously monitor for policy violations or abnormal configurations, and provide alerts when violations occur
|
Table. Cloud Control Guardrail
Notice
Detection Guardrails will be provided in March 2026.
Baseline(Baseline)
The essential resources and configuration sets, such as security, logging, and network, automatically deployed per account, are as follows.
| Category | Detailed description |
|---|---|
| AuditBaseline |
|
| LogArchiveBaseline |
|
| IDCenterBaseline |
|
Table. Cloud Control Baseline
Guide
AuditBaseline is scheduled to be provided in July 2026.
Region-specific provision status
Cloud Control service is available in the following environments.
| Region | Availability |
|---|---|
| Korea West 1 (kr-west1) | Provided |
| Korea East1 (kr-east1) | Provided |
| Korea South1(kr-south1) | Provided |
| South Korea 2(kr-south2) | Provided |
| South Korea South 3(kr-south3) | Provided |
Table. Cloud Control Region-wise Provision Status
Pre-service
This is a list of services that must be pre-configured before creating the service. For detailed information, please refer to the guide provided for each service and prepare in advance.
| Service Category | Service | Detailed Description |
|---|---|---|
| Storage | Object Storage | Object storage that facilitates data storage and retrieval |
| Management | Loggin&Audit | A service that collects and analyzes user activity history |
| Management | Organization | A service that organizes accounts by organizational units, manages them hierarchically, and controls resource access permissions. |
| Management | ID Center | A service that allows you to easily manage access permissions for resources per account centrally. |
Table. Cloud Control Preceding Service
2.2 - How-to guides
The user must first create a landing zone to use the Cloud Control service. If a landing zone is created, you can use the management functions of Cloud Control.
Caution
Cloud Control services are not charged, but services such as Logging&Audit, Object Storage, Config Inspection used within Cloud Control may incur costs based on usage.
Create Landing Zone
To use Cloud Control in the Samsung Cloud Platform Console, you must first create a landing zone.
To create a landing zone, follow the steps below.
All Services > Management > Cloud Control Click the menu. Navigate to Cloud Control’s Service Home page.
Click the Landing Zone Creation button on the Service Home page. You will be taken to the Landing Zone Creation page.
Fee Review and Organizational Unit Configuration area, after setting the configuration items, click the Next button.
Category RequiredDetailed description Home Region - Home Region of Cloud Control - Cloud Control designates the default region as the Home Region and cannot be changed
- All regions other than the default region are under Cloud Control’s management
Basic Organizational Unit Required Enter basic organizational unit within landing zone - Case-sensitive English letters, enter within 128 characters
- Basic organizational unit includes shared Accounts (Log Account, Audit Account)
- Security: Name of the basic organizational unit for shared Account
- Can be modified after landing zone creation
Additional Organizational Unit Required Enter additional organizational unit within landing zone - Case-sensitive English letters, enter within 128 characters
- Can be added after landing zone creation
Table. Landing Zone Creation - Fee Review and Organizational Unit Configuration ItemsShared Account Configuration After setting the configuration items in the area, click the Next button.
Category RequiredDetailed description Management Account - Management Account name is displayed and cannot be edited Log Account Required Log Account information input - Account name: Use Korean, English, numbers, spaces, special characters(
+=-_@[](),.) to input within 3 ~ 30 characters
- Email, Confirm Email: Input within 60 characters according to email address format
Audit Account Required Enter Log Account information - Account name: Use Korean, English, numbers, spaces, special characters(
+=-_@[](),.) and enter within 3 to 30 characters
- Email, Confirm Email: Enter within 60 characters following email address format
- Cannot use the same email as Log Account
Table. Landing Zone Creation - Shared Account Configuration Items- Account name: Use Korean, English, numbers, spaces, special characters(
Note
- Log Account is a repository of logs of API activity and resource configuration collected from all Accounts. Log Account cannot be changed.
- Audit Account is a limited account, and the security and compliance team can obtain access rights to all accounts within the organization through the Audit Account.
Additional configuration area, after setting the configuration items, click the Next button.
Category RequiredDetailed description Account access configuration Required Select method to manage access to the Account - Account access via ID Center: Create pre-configured groups and permission sets to configure users who perform specific tasks in the Account
- Automatically assign users when provisioning an Account with Account Factory or registering an existing Account
- Self-managed Account access: Manage access to the Account via ID Center or other Account access methods
- Cloud Control does not create directory groups or permission sets for the landing zone
- No user creation when provisioning an Account with Account Factory or registering
Trail configuration - Automatic configuration in progress Table. Landing Zone Creation - Additional Configuration Items- Account access via ID Center: Create pre-configured groups and permission sets to configure users who perform specific tasks in the Account
Input Information Check area, after checking the landing zone configuration information and Service Permissions, check the agreement content for permissions and guidelines.
Click the Complete button. A popup window notifying the creation of the landing zone will open.
After checking the information about creating a landing zone, click the Confirm button. The landing zone creation request is completed.
- Landing zone creation takes some time, and a notification will be sent when the task is completed.
- When the landing zone creation is complete, you can check the full menu of Cloud Control and the organization status on the Service Home page.
Caution
- You cannot cancel while creating a landing zone.
- If you fail to create a landing zone, delete the landing zone and then create it again.
Reference
When a landing zone is created, you can check the following items in Cloud Control.
- Two organizational units: shared Account, organizational unit for the Account that the user will provision
- Shared Account 2: Log Archive and Security Audit Isolation Account
- Selected IAM management configuration
- 10 preventive guardrails: Settings for policy application
- Organization Service Control Policy Activation
Check detailed landing zone information
Landing Zone Settings page allows you to view detailed information about the landing zone.
To check the detailed information of the landing zone, follow the steps below.
- All Services > Management > Cloud Control Click the menu. Navigate to Cloud Control’s Service Home page.
- Service Home on the page click the Landing Zone Settings menu. Navigate to the Landing Zone Settings page.
| Category | Detailed description |
|---|---|
| service | service name |
| Resource Type | Resource Type |
| SRN | Unique resource ID in Samsung Cloud Platform
|
| Resource Name | Resource Name |
| Resource ID | Unique resource ID in the service |
| Creator | User who created the service |
| Creation time | Service creation time |
| Modifier | User who edited the service information |
| Modification Date | Date Service Information Was Modified |
| Home Region | Home region information of the landing zone |
| Account Access Configuration | How to manage access for Account |
| Trail configuration | Trail configuration activation status
|
| Landing Zone Delete | Delete landing zone
|
Table. Landing zone configuration items
Delete landing zone
If you fail to create a landing zone or do not use it, you can delete the landing zone.
Caution
- Deleted resources cannot be recovered.
- Organization unit, Account, bucket, ID Center resources are not automatically deleted.
- If you want to use the same name as an existing resource that hasn’t been deleted when recreating a landing zone, you must delete the existing resource directly before creating the landing zone.
- Existing resources can be deleted individually from the Organization, Object Storage, and ID Center services.
To delete the landing zone, follow the steps below.
- All Services > Management > Cloud Control Click the menu. Navigate to Cloud Control’s Service Home page.
- Click the Landing Zone Settings menu on the Service Home page. You will be taken to the Landing Zone Settings page.
- Landing Zone Settings page, click the Landing Zone Delete button. Landing Zone Delete popup opens.
- Landing Zone Deletion displayed in the popup window, enter the Cloud Contorl ID into the deletion confirmation area, then click the Confirm button. The landing zone deletion request is completed.
- While deleting the landing zone, a description about the landing zone deletion process is displayed on the Service Home page.
Managing Organization Units and Accounts
You can check the list of organization units and accounts, and register and manage them in Cloud Control.
To view and manage the organization unit and Account list, follow the steps below.
- All Services > Management > Cloud Control Click the menu. Navigate to Cloud Control’s Service Home page.
- Service Home page, click the Organization menu. Move to the Organization unit and Account management page.
- Organization Unit and Account Management Select the view mode located at the top right of the page.
| Category | Detailed description |
|---|---|
| View Hierarchy | Display organizational units in a hierarchical structure |
| Account List View | Display Account list within organization |
| Account creation | Create a new Account
|
Table. Cloud Control organization unit and Account management items
View Hierarchy
Organizational Unit and Account Management page, when you click the View Hierarchy button, you can view and manage organizational units and accounts in a hierarchical structure.
| Category | Detailed description |
|---|---|
| Create Sub-Organization Unit | Add a new organization unit under the selected organization unit
|
| More | Manage organizational units or register a new Account
|
| Organization Unit/Account Name | Display organization unit and account names in a measurement structure format
|
| ID/email | Organization unit shows ID, Account shows ID and email |
| Status | Organization unit or Account’s Cloud Control registration status
|
| Registered organization unit | Cloud Control registration status of sub-organization units
|
| Registered Account | Sub Account’s Cloud Control registration status
|
Table. Hierarchy View Items
View Account List
Organization Unit and Account Management on the page, when you click the View Account List button, you can view and manage the Account list that constitute Cloud Control.
| Category | Detailed description |
|---|---|
| Account registration | Register the selected Account from the Account list to Cloud Control
|
| Account name | Account name |
| Account ID | Account’s ID |
| Account’s user email | |
| Status | Organization unit or Account’s Cloud Control registration status
|
Table. Account list view items
Organization and Account Detailed Information Check
You can view and edit the detailed information of the organization unit and Account.
To view detailed information, follow the steps below.
- All Services > Management > Cloud Control Click the menu. Navigate to Cloud Control’s Service Home page.
- Service Home page, click the Organization menu. Move to the Organization unit and Account management page.
- Organization Unit and Account Management page’s View Hierarchy button, click it.
- Click the name of the resource whose detailed information you want to view in the hierarchy list. You will be taken to the detailed page of that resource.
- Root: Root Details go to the page. For more details, please refer to Root Details Info.
- Organization unit name: Organization unit details navigate to the page. For more details, see Organization unit detailed information.
- Account name: Account details navigate to the page. For more details, refer to Account detailed information.
Root Detailed Information
Root detail page allows you to view and manage the detailed information of the organization Root and the sub Account list. Root Details page consists of Basic Information, Sub Account tabs.
Basic Information
You can check the basic information about organization Root and the organizational units and account count registered in Cloud Control.
| Category | Detailed description |
|---|---|
| service | service name |
| Resource Type | Service Type |
| SRN | Unique resource ID in Samsung Cloud Platform |
| Resource Name | Resource Name |
| Resource ID | Unique resource ID in the service |
| Creator | User who created the service |
| Creation time | Service creation time |
| Modifier | User who edited the service information |
| Modification Date | Date Service Information Was Modified |
| Registered organization unit | Cloud Control registration status of Root sub-organization units
|
| Registered Account | Root sub Account’s Cloud Control registration status
|
Table. Root Details - Basic Information Tab Items
Sub Account
You can view and manage the list of Accounts under Root and the registration status of Cloud Control.
| Category | Detailed description |
|---|---|
| Account registration | Register the selected Account from the Account list to Cloud Control
|
| Account name | Account name |
| Account’s user email | |
| Status | Organization unit or Account’s Cloud Control registration status
|
Table. Root Details - Sub Account Tab Items
Organization Unit Detailed Information
Organizational Unit Details page allows you to view and manage detailed information of the organizational unit, sub Accounts, and applied preventive guardrails. Organization Unit Details page consists of Basic Information, Sub Account, Preventive Guardrails tabs.
Basic Information
You can view basic and detailed information about the organization unit.
| Category | Detailed description |
|---|---|
| service | service name |
| Resource Type | Service Type |
| SRN | Unique resource ID in Samsung Cloud Platform |
| Resource Name | Resource Name |
| Resource ID | Unique resource ID in the service |
| Creator | User who created the service |
| Creation time | Service creation time |
| Modifier | User who edited the service information |
| Modification Date/Time | Date and time the service information was modified |
| Organizational unit name | Name of the organizational unit |
| Applied Guardrail | Number of guardrail types applied to the current organization unit |
| Registered organization unit | Current organization unit’s sub-unit Cloud Control registration status
|
| Registered Account | Current organization unit sub Account’s Cloud Control registration status
|
| Higher organization unit | Hierarchy of higher organization units of the current organization unit |
| Re-registration | Re-register the current organization unit to Cloud Contorl
|
Table. Organization Unit Details - Basic Information Tab Items
Sub Account
You can view and manage the list of sub-accounts of the organization unit.
Notice
Security organization units cannot register Account.
| Category | Detailed description |
|---|---|
| Account registration | Register the selected Account from the Account list to Cloud Control
|
| Account name | Account name |
| Account’s user email | |
| Status | Organization unit or Account’s Cloud Control registration status
|
Table. Organization Unit Details - Sub Account Tab Items
Preventive Guardrail
You can view and manage the list of preventive guardrails applied at the organizational unit level.
Notice
Security in the case of organization units, cannot apply or remove the guardrail.
| Category | Detailed description |
|---|---|
| Target Service Name | Guardrail applicable service name |
| Guardrail Name | Name of the guardrail
|
| Type | Application method |
| Application method | Display of guardrail’s application method
|
| Remove | Remove the selected guardrail from the guardrail list
|
| Apply Preventive Guardrail | New preventive guardrail can be applied at the organizational level
|
Table. Organization Unit Details - Prevention Guardrail Tab Items
Account Check detailed information
Account Details page you can view the detailed information of the Account and the list of applied preventive guardrails. Account Detail page consists of Basic Information, Prevention Guardrail tabs.
Basic Information
You can view basic and detailed information about the organization unit.
| Category | Detailed description |
|---|---|
| service | service name |
| Resource Type | Service Type |
| SRN | Unique resource ID in Samsung Cloud Platform |
| Resource Name | Resource Name |
| Resource ID | Unique resource ID in the service |
| Creator | User who created the service |
| Creation time | Service creation time |
| Editor | User who edited the service information |
| Modification Date | Date Service Information Was Modified |
| Account’s user email | |
| Applied Guardrail | Number of guardrail types applied to the current organization unit |
| ID Center username | ID Center user email |
| Upper organizational unit | Current Account’s upper organization unit hierarchy |
| Register | Current Account’s organization unit can be changed
|
Table. Account Details - Basic Information Tab Items
Prevention Guardrail
You can view the list of preventive guardrails applied to the Account.
| Category | Detailed description |
|---|---|
| Target Service Name | Guardrail applicable target service name |
| Guardrail Name | Name of the guardrail
|
| Type | Application Method |
| Application method | Display of the guardrail’s application method
|
Table. Account Details - Preventive Guardrail Tab Items
Access Portal Check access information
User and Access page you can check the Access Portal connection URL and the password required for connection.
Access Portal to check the connection information, follow the steps below.
- All Services > Management > Cloud Control Click the menu. Navigate to Cloud Control’s Service Home page.
- Service Home page, click the User and Access menu. Navigate to the User and Access page.
- User and Access page’s Integrated Access Management area, check the information.
| Category | Detailed description |
|---|---|
| Password | Password for Access Portal access |
| Access Portal URL | Access Portal access URL
|
| Permission Set | A collection of admin policies used by ID Center to determine the valid permissions of users who can access a specific Account |
Table. Shared Account Items
Note
For detailed information about credential sources and ID Center, refer to ID Center.
Notice
If the landing zone is configured with a self‑managed Account access, refer to the following.
- Cloud Control does not automatically create directory groups or permission sets.
- When provisioning an Account via the Account factory or registering an existing Account, the user is automatically assigned.
- You can manage access to the Account via ID Center or other Account access methods.
Check user credential information
On the User and Access page, you can check the user credential source type and ID Center ID.
To verify user credential information, follow the steps below.
- All Services > Management > Cloud Control Please click the menu. Navigate to Cloud Control’s Service Home page.
- Click the User and Access menu on the Service Home page. You will be taken to the User and Access page.
- User and Access page’s User Credential Management area, check the information.
| Category | Detailed description |
|---|---|
| Credential Source | Types of credential sources set in ID Center
|
| ID Center ID | ID Center’s ID
|
| User Group | A group formed to classify workers who perform specific tasks in an organization |
Table. User Credential Management Items
Reference
Check shared Account
You can view the shared Account information of Cloud Control.
To check the shared Account information, follow the steps below.
- All Services > Management > Cloud Control Click the menu. Go to the Service Home page of Cloud Control.
- Click the Shared Account menu on the Service Home page. Navigate to the Shared Account page.
- Shared Account page is composed of Management Account, Log Account, Audit Account widgets.
- Each widget displays the Account name, Account ID, and email information, and clicking the widget name navigates to that Account’s detail page.
| Category | Detailed description |
|---|---|
| Management Account | Account that creates new accounts and manages billing and access for all accounts in the organization |
| Log Account | Account used as the repository for API activity and resource configuration logs collected from all Accounts |
| Audit Account | Limited account that allows the security and compliance team to obtain read and write access to all accounts |
Table. Shared Account Items
2.2.1 - Managing Guardrails
Policy violation detection and prevention (detection/prevention type) rules, and the guardrails automatically applied to security and compliance standards are as follows.
Prevention Guardrail
You can apply preventive guardrails to block in advance so that policy violations do not occur.
Applying preventive guardrails
It can be applied to preventive guardrails at the organizational level. To apply preventive guardrails at the organizational level, follow the steps below.
All Services > Management > Cloud Control Click the menu. Navigate to Cloud Control’s Service Home page.
Service Home on the page click Guardrail > Preventive Guardrail menu. Preventive Guardrail List navigate to the page.
After selecting the prevention guardrail to apply to the organizational unit from the Prevention Guardrail List, click the Apply to Organizational Unit button. You will be taken to the Apply to Organizational Unit page.
- Multiple preventive guardrails can be selected and applied simultaneously.
After selecting the organizational unit to apply the preventive guardrail, click the Complete button.
Category RequiredDetailed description Preventive guardrails to apply - List of preventive guardrails to apply at the organizational unit Organization Unit Name Required Select organization unit to apply preventive guardrails - Registered, Registration Failed status organization units only selectable
- Click on organization unit name, parent organization unit name to view detailed information
Table. Prevention Guardrail Application ItemsWhen a pop-up window that notifies the application of the preventive guardrail opens, click the Confirm button.
Check detailed guardrail information
You can view detailed information about the preventive guardrail, the organizational units applied to the preventive guardrail, and the list of Accounts. To disable the preventive guardrail, follow the steps below.
- All Services > Management > Cloud Control Click the menu. Navigate to Cloud Control’s Service Home page.
- Service Home on the page click the Guardrail > Preventive Guardrail menu. Navigate to the Preventive Guardrail List page.
- Prevention Guardrail List Click the prevention guardrail name to view detailed information. Prevention Guardrail Details page
- Prevention Guardrail Details page consists of Basic Information, Applicable Organization Unit, Account tabs.
Basic Information
You can view basic and detailed information about preventive guardrails.
| Category | Detailed description |
|---|---|
| service | service name |
| Resource Type | Service Type |
| SRN | Unique resource ID in Samsung Cloud Platform |
| Resource Name | Resource Name |
| Resource ID | Unique resource ID in the service |
| Creator | User who created the service |
| Creation time | Service creation time |
| Editor | User who edited the service information |
| Modification date/time | Date and time the service information was modified |
| Guardrail name | Guardrail’s name |
| type | guardrail type |
| Target Service Name | Guardrail’s target service name |
| Status | Guardrail application status |
| Description | Description of guardrails |
Table. Guardrail Details - Basic Information Tab Items
Applied Organization Unit
You can view the list of organizational units with preventive guardrails applied.
| Category | Detailed description |
|---|---|
| Organizational unit name | Name of the organizational unit
|
| Parent Organization Unit Name | Name of the parent organization unit of the organization unit
|
| Status | Organization unit’s Cloud Control registration status
|
Table. Root Details - Sub Account Tab Items
Account
You can check the list of sub Accounts of the organization unit where the preventive guardrail is directly applied.
| Category | Detailed description |
|---|---|
| Account name | Account name |
| Account’s user email | |
| Organization Unit Name | Name of the organization unit
|
| Status | Organization unit or Account’s Cloud Control registration status
|
Table. Root Details - Sub Account Tab Items
Note
Preventive guardrails are inherited and applied from all higher organizational units, so even accounts not in the account list can have preventive guardrails applied.
Disable Guardrail
The preventive guardrail applied to the organizational unit can be disabled. To disable the preventive guardrail, follow the steps below.
All Services > Management > Cloud Control Click the menu. Navigate to Cloud Control’s Service Home page.
Service Home on the page, click the Guardrail > Preventive Guardrail menu. Navigate to the Preventive Guardrail List page.
Prevention Guardrail List after selecting the prevention guardrail to remove organization unit application, click the More > Remove Organization Unit Application button. You will be taken to the Remove Organization Unit Application page.
- Multiple preventive guardrails can be selected simultaneously and disabled.
After selecting the organizational unit to remove the preventive guardrail, click the Complete button.
Category RequiredDetailed description Preventive guardrails to apply - List of preventive guardrails to deactivate Organization Unit Name Required Select organization unit to disable preventive guardrail application - Registered, Registration Failed status only organization units can be selected
- Click organization unit name, parent organization unit name to view detailed information
Table. Prevention Guardrail Deactivation ItemsWhen the popup notifying the removal of the preventive guardrail is opened, click the Confirm button.
2.2.2 - Managing an Organization
The user must first create a landing zone in order to use the Cloud Control service. When a landing zone is created, you can use Cloud Control’s management functions.
Caution
Cloud Control service is not charged, but services such as Logging&Audit, Object Storage, Config Inspection used within Cloud Control may incur costs based on usage.
Managing organizational units
You can register and manage the organizational units that constitute the Organization in Cloud Control.
Create Organizational Unit
You can create a new organizational unit and register it in Cloud Control.
Create an organizational unit and follow the steps below to register it with Cloud Control.
All Services > Management > Cloud Control Click the menu. Go to Cloud Control’s Service Home page.
Click the Organization menu on the Service Home page. Navigate to the Organization Unit and Account Management page.
Organizational Unit and Account Management page’s top right corner, click the View Hierarchy button.
After selecting the location to add an organizational unit in the hierarchy list, click the Create Sub-Organizational Unit button. The Create Organizational Unit popup opens.
- Root or only one organizational unit can be selected.
- Root can be used as a basis to create organizational units within 5 levels below.
Create Organizational Unit After entering the organizational unit information to add in the popup window, click the Confirm button.
Category Required statusDetailed description Parent organization unit name - Name of the parent organization unit for the organization unit to be created Organization Unit Name Required Enter the name of the organization unit to be created within 128 characters - Organization names distinguish between uppercase and lowercase English letters
Description Select Enter a description of the organizational unit within 1,000 characters Table. Organization unit creation itemsWhen the popup notifying the creation of an organizational unit opens, click the Confirm button.
- It may take several tens of minutes depending on the number of Accounts under the organizational unit.
- When the organization unit creation is completed, it will be delivered as a notification.
Register Organizational Unit
You can register organizational units that are not registered in Cloud Control or that failed to register in Cloud Control.
Notice
- When registering an organizational unit, all parent organizational units of the unit to be registered must be in a registered state.
- If there is an organization unit in the registering state under the organization unit you want to register, you cannot register.
- Subordinate organizational units of the organizational unit to be registered must be registered separately.
To register an organizational unit in Cloud Control, follow the steps below.
All Services > Management > Cloud Control Click the menu. Navigate to Cloud Control’s Service Home page.
Click the Organization menu on the Service Home page. Navigate to the Organization Unit and Account Management page.
Organizational Unit and Account Management in the top right corner of the page, click the View Hierarchy button.
After selecting the organizational unit to register from the hierarchy list, click the More > Register Organizational Unit button. You will be taken to the Register Organizational Unit page.
Organization Unit Registration Check the information of the organization unit to be registered on the page.
Category RequiredDetailed description Sub Account - List of Accounts included under the sub-unit of the organization unit to be registered - Automatically registered in Cloud Control when registering the organization unit
Guardrails to be applied to the organizational unit - List of guardrails inherited from the upper organizational unit and guardrails directly applied to the organizational unit - Clicking the guardrail name allows you to view detailed information about that guardrail
- To remove a guardrail applied to the organizational unit, remove its application from the upper organizational unit
Table. Organization Unit Registration ItemsTerms Agreement after checking the content, check the checkbox and click the Complete button.
When the popup notifying the registration of the organizational unit opens, click the Confirm button. The organizational unit registration request will be completed.
- Depending on the number of Accounts under the organization unit, it may take more than tens of minutes.
- When the organization unit registration is completed, it will be delivered as a notification.
Re-register Organization Unit
You can re-register the organizational unit registered in Cloud Control to Cloud Control.
Notice
- If there is an organization unit in the registering state under the organization unit you want to register, you cannot register.
- The subordinate organizational unit of the organization unit you want to register must be registered separately.
To re-register an organizational unit in Cloud Control, follow these steps.
All Services > Management > Cloud Control Click the menu. Navigate to Cloud Control’s Service Home page.
Service Home page, click the Organization menu. Navigate to the Organization Unit and Account Management page.
Organization Unit and Account Management page’s top right corner View Hierarchy button click.
After selecting the organizational unit to re-register from the hierarchy list, click the More > Re-register Organizational Unit button. You will be taken to the Re-register Organizational Unit page.
Organizational Unit Re-registration Check the information of the organizational unit to be re-registered on the page.
Category Required statusDetailed description Sub Account - List of Accounts included under the sub-unit to be re-registered - Automatically registered in Cloud Control when registering the organizational unit
Guardrails to be applied to the organizational unit - List of guardrails inherited from the upper organizational unit and guardrails directly applied to the organizational unit - Clicking the guardrail name allows you to view detailed information about that guardrail
- To remove a guardrail applied to the organizational unit, remove its application from the upper organizational unit
Table. Organization Unit Re-registration ItemsTerms Agreement after reviewing the content, check the checkbox and click the Complete button.
When the popup notifying re-registration of the organization unit opens, click the Confirm button. The organization unit re-registration request will be completed.
- Depending on the number of Accounts under the organization unit, it may take more than tens of minutes.
- When the organization unit re-registration is completed, it will be delivered as a notification.
Delete organization unit
You can delete the organization unit.
Notice
- Only organization units that are in an unregistered state in Cloud Control can be deleted.
- Before deleting the organization unit, remove all sub-elements of that organization unit.
To delete an organizational unit, follow the steps below.
- All Services > Management > Cloud Control Please click the menu. Navigate to Cloud Control’s Service Home page.
- Click the Organization menu on the Service Home page. Navigate to the Organization Unit and Account Management page.
- Organizational unit and Account management in the top right corner of the page, click the View Hierarchy button.
- After selecting the organizational unit to delete from the hierarchy list, click the More > Delete Organizational Unit button.
- When the popup notifying the deletion of the organizational unit opens, click the Confirm button.
Account Management
You can register and manage the list of Accounts that constitute the Organization in Cloud Control.
Account Create
Account factory to create Account and apply Cloud Control directly without separate work.
To create an Account, follow the steps below.
All Services > Management > Cloud Control Click the menu. Navigate to Cloud Control’s Service Home page.
Click the Account Factory menu on the Service Home page. Navigate to the Account Factory page.
Account Factory on the page Account Creation button click the button. Account Creation page will be navigated.
Account creation on the page, enter the required information for creating an Account and select the organizational unit, then click the Complete button. A popup notifying the Account creation opens.
Category RequiredDetailed description Account information Required Enter the name and email information of the Account - Account name: Use Korean, English, numbers, spaces, special characters(
+=-_@[](),.) to input within 3 ~ 30 characters
- Email, Confirm Email: Input within 60 characters according to email address format
ID Center Information Required Enter ID Center user information that can access the Account to be created - Username: Enter using English letters, numbers, special characters(
+=-_@,.) within 128 characters
- User Real Name: Enter the user’s actual name (surname and given name)
- If the Account access configuration uses Self-Managed Account Access, ID Center Information cannot be set
Organization unit selection Required Select the parent organization that will include the Account to be created - registered status organization units only can be selected
- Clicking the organization unit name allows navigation to its detail page
Table. Landing Zone Creation - Fee Review and Organizational Unit Configuration Items- Account name: Use Korean, English, numbers, spaces, special characters(
Caution
An Excel file containing Access Portal user login information will be sent to the email entered in the ID Center. Be sure to verify that the email information is correct.
- Confirm Click the button. Account creation request is completed.
- Account creation takes some time, and a notification will be sent when the task is completed.
Account Register
You can register organizational units that are not registered in Cloud Control or failed to register in Cloud Control.
Notice
- Only accounts of organizational units registered in Cloud Control can be registered.
- If there is an organizational unit or Account in the registering state under the organizational unit you want to register, you cannot register.
- If you select and register a different organizational unit from the current one, the corresponding ACcount will be moved to the newly selected organizational unit.
To register an Account, follow the next steps.
All Services > Management > Cloud Control Click the menu. Go to Cloud Control’s Service Home page.
Click the Organization menu on the Service Home page. Navigate to the Organization Unit and Account Management page.
Organization Unit and Account Management page’s top right corner, click the View Account List button.
After selecting the Account to register in Cloud Control from the Account list, click the Account registration button. It navigates to the Account registration page.
Category RequiredDetailed description Current organizational unit - Organizational unit that the Account belongs to Register organization unit - Select the organization unit to register the Account - Only organization units in registration status can be selected
- Current organization unit: Register as is in the current organization unit
- Other organization unit: Directly select another organization unit
Table. Account registration itemsAccount when the registration notification popup opens Click the Confirm button.
Account Move
You can change the organizational unit of the Account registered in Cloud Control and move it.
Notice
- If there is an organization unit or Account in the registering state under the organization unit you want to register, you cannot move.
- If you select and register a different organizational unit from the current one, the corresponding ACcount will be moved to the newly selected organizational unit.
To move the Account, follow the steps below.
- All Services > Management > Cloud Control Please click the menu. Navigate to Cloud Control’s Service Home page.
- Click the Organization menu on the Service Home page. Navigate to the Organization Unit and Account Management page.
- Organization Unit and Account Management on the top right of the page, click the View Account List button.
- Click the Account name to change the organizational unit from the Account list. Account Details page will be navigated.
- Click the Register button on the Account Details page. You will be taken to the Account Registration page.
- Register Organization Unit from the list, after selecting the organization unit to move the Account, click the Complete button.
- Registration status organizational units can only be selected.
- When the popup notifying Account registration opens, click the Confirm button.
Account Exclude
You can exclude the Account from the Organization.
To exclude Account from Organization, follow the steps below.
- All Services > Management > Organization Click the menu. Go to the Service Home page of Organization.
- Click the Organization Configuration menu on the Service Home page. Navigate to the Organization Configuration page.
- Organization Structure page click the Account List View button.
- After selecting the Account to exclude from Organization, click the More > Exclude Account button.
- When a popup that notifies the exclusion of the Account opens, click the Confirm button.Notice
In the following cases, Account cannot be excluded.
- Account with unregistered payment method
- If there is credit assigned to the account
- When the exclusion point is the cost settlement date (the 1st of each month, Asia/Seoul GMT +09:00)
Account Delete
You can delete the Account.
To delete the Account, follow the steps below.
- All Services > Management > Organization Click the menu. Go to the Service Home page of Organization.
- Service Home on the page, click the Organizational Structure menu. Navigate to the Organizational Structure page.
- Organization Setup on the page click the Account List View button.
- After selecting the Account to delete from the Account list, click the More > Delete Account button. The Delete Account popup window opens.
- After clicking the Account name of the Account to be deleted, you can also delete by clicking the Delete Account button on the Account Details page.
- After entering the Account name to delete, click the Confirm button.
Reference
If you delete Account, a Account deletion notification email will be sent to the next user.
- Administrator who created Organization
- Root user of the created Account
- User with delegation for the created Account
Notice
- When deleting from the Account list, you must select only one Account to delete.
- Before deletion, all resources within the Account must be deleted.
- Management Account and accounts that joined through invitation cannot be deleted.
2.3 - API Reference
API Reference
2.4 - CLI Reference
CLI Reference
2.5 - Release Note
Cloud Control
2025.10.23
NEW
Official Service Version Release- Cloud Control service official version has been released.
- You can easily and safely build, operate, and manage a multi-account environment on Samsung Cloud Platform.
- The organization’s cloud governance (security, compliance, standardization, etc.) can be automated and managed through policy violation detection and monitoring functions.
3 - Cloud Monitoring
3.1 - Overview
Service Overview
Cloud Monitoring service collects usage and change information, and logs of operating infrastructure resources, and generates events when the set threshold is exceeded, notifying users. Through this, users can quickly respond to performance degradation and failures, and can easily establish resource capacity expansion plans for a stable computing environment.
Provided Functions
Cloud Monitoring provides the following functions.
- Stable Computing Resource Management: You can easily check indicators such as CPU usage, disk usage, and memory usage. Since notifications are automatically sent to designated personnel when events occur in resources being used, you can operate computing resources stably and quickly analyze and respond to failures.
- Convenient Monitoring: Resource status information can be easily monitored by creating a dashboard. Basic dashboards and user-defined dashboards are provided, and various types of widgets can be set up to easily and quickly create dashboards.
- Event Metric Management: Event metrics can be easily set up with just a few clicks through the web-based console. Event metric settings for monitoring targets (event patterns, occurrence conditions, occurrence cycles, performance metrics, operation status, etc.) can be changed in various ways to suit the usage environment, and threshold settings and alarm settings can be easily managed.
- Resource Log Management: Log data of resources can be collected and stored, and searches can be performed on target logs as needed. Additionally, events are quantified for major keywords, and when predefined conditions are met, notifications are automatically sent to designated personnel, providing a more stable usage environment.
Components
Dashboard
The monitoring dashboard allows you to check the operation status, event status, and usage rates of monitoring targets and services.
| Item | Description |
|---|---|
| Region | Location of resources |
| Data Reference Time | Reference time of data displayed on the dashboard |
| Refresh | Refresh the dashboard based on the current time |
| Period Setting | Set the data query period and refresh cycle |
| Monitoring Status | Number and status of monitoring targets for each service in the account |
| Event History | Display recent 7-day events by risk level as a graph |
| Top 5 Performance Usage | Display the top 5 monitoring targets with the highest performance usage |
| Event Map | Display the number of events for each service by risk level |
| Event Status | Display a list of unprocessed events that have occurred |
Table. Cloud Monitoring Dashboard Components
Performance Analysis
Performance analysis allows you to check the main performance items of monitoring targets and view current data and historical data for each performance item. Users can check the performance status of monitoring targets by service or period and analyze the results by comparing specific performance.
Log Analysis
Log analysis collects and checks the logs of monitoring targets and converts them into quantifiable data for monitoring. Basic logs are provided for each monitoring target, and users can create custom logs to collect and check additional logs.
Event Management
An event is a setting that notifies users when the performance value of a monitoring target meets certain conditions. By setting events, users can grasp monitoring information that they must know without missing it. For example, if an event is set to occur when a performance value related to overload exceeds a certain value, users will be notified whenever there is a risk of overload during resource operation, allowing them to respond before problems occur. Event management allows users to create events and set them to notify designated users when specific values occur during monitoring.
Preceding Services
Cloud Monitoring has no preceding services.
3.2 - How-to guides
Samsung Cloud Platform Monitoring is a resource management system that allows users to monitor and analyze the operation status of resources within an account on the Samsung Cloud Platform Console. Users can efficiently manage resources using the dashboard page, widgets, and chart features.
Note
- Users can monitor resources created in the Samsung Cloud Platform Console with authorized accounts.
- Users can log in to the Samsung Cloud Platform Console and navigate to Samsung Cloud Platform Monitoring to monitor resources.
Getting Started with Cloud Monitoring
To start using Samsung Cloud Platform Monitoring, follow these steps:
- Click on All Services > Management > Cloud Monitoring menu. This will take you to the Service Home page of Cloud Monitoring.
- Click on the Open Cloud Monitoring button on the Service Home page. This will take you to the Cloud Monitoring Console page.
Exploring the Cloud Monitoring Console
The top and left menus of the Cloud Monitoring Console are composed as follows:
| Category | Description |
|---|---|
| Custom Dashboard Management | Custom Dashboard
|
| Support | Support
|
| Region List | Region List
|
| User Information | View user information and log out of Samsung Cloud Platform Monitoring. |
| Side Menu | Displays the main features of Samsung Cloud Platform Monitoring. Each menu can be clicked to navigate to the corresponding page.
|
Table. Exploring the Monitoring Page
Ending Monitoring
To exit the Cloud Monitoring Console, click the Log Out button in the top right corner of the User Information section.
Note
The session timeout for the Cloud Monitoring Console is set to 30 minutes.
Using Common Features
This section describes frequently used features when using the Cloud Monitoring Console.
Viewing Detailed Information
To view detailed information about a monitored resource, navigate to Cloud Monitoring Console > Performance Analysis or Cloud Monitoring Console > Log Analysis > Log Status. Then, click on the monitored resource for which you want to view detailed information.
Note
- The detailed information for a monitored resource may vary depending on the service type.
- If the operating system (OS) of the monitored resource is RHCOS (Red Hat Core OS), detailed information may not be available.
| Item | Description |
|---|---|
| Basic Information | Displays basic information about the monitored resource
|
| Performance | Displays key performance metrics as graphs |
| Logs | Displays the log collection volume as graphs |
| Events | Displays a list of events that occurred on the monitored resource |
| Agent | Provides Install, Start, Stop, Delete, and Update commands for the agent |
| Query Period Setting | Displays the query period for date/time data
|
| Monitoring Status Area | Displays the monitoring status for performance, logs, and events. |
Table. Monitored Resource Detailed Information
Note
- Agent management commands are available for Virtual Server, GPU Server, and Bare Metal Server services.
- For more information on agent installation and management, see Managing Agents.
Sorting Data
You can sort event monitoring, performance analysis, and log analysis results in descending or ascending order. To sort data, follow these steps:
- Display the information you want to sort on the page.
- Click on the Sort button next to the category name. The sort order changes between descending and ascending each time you click.
Viewing Real-Time Data
You can set the dashboard or detailed information page to automatically refresh the data at a specified interval.
Note
- The Cloud Monitoring Console allows you to set the monitoring page to refresh periodically.
- You can refresh the data based on the current time by clicking the Refresh button.
To set the refresh interval, follow these steps:
- Click the Settings button in the top right corner of the data representation area.
- Select the refresh interval and click OK.
- You can enable or disable the automatic refresh feature.
Setting the Query Period
You can set the query period to limit the scope of performance, log, and event data, making it easier to find the information you need. To set the query period, follow these steps:
- Click the Settings button in the top right corner of the data representation area.
- Select or enter the query period.
Caution
- When entering the query period manually, it must be at least 30 minutes.
- If the data query range is fixed for each widget, the widget’s query range takes priority.
3.2.1 - Using the Monitoring Dashboard
The monitoring dashboard allows you to view the operational status and event history of monitored services and resources, as well as the top usage items.
Getting Started with the Monitoring Dashboard
When you navigate to the Cloud Monitoring Console page in the Samsung Cloud Platform Console, the monitoring dashboard is displayed. If you are on a different page, you can click Cloud Monitoring Console > Monitoring Dashboard to move to the monitoring dashboard page.
The monitoring dashboard is composed of the following elements.
| Item | Description |
|---|---|
| Data Reference Time | Displays the reference time for the data shown on the dashboard |
| Refresh | Refreshes the dashboard based on the current time |
| Auto Refresh | Enables or disables the auto-refresh feature for the dashboard |
| Period Setting | Sets the data retrieval period or changes the refresh cycle |
| Monitoring Status | Displays the number of monitored targets and their monitoring status for each service |
| Event History | Displays the number of events that occurred in the last 7 days as a graph by risk level |
| Top 5 Performance Usage | Displays the top 5 monitored targets with the highest performance usage as a graph |
| Event Map | Displays the number of events that occurred for each service by risk level |
| Event Status | Displays a list of unprocessed events that have occurred |
Table. Monitoring Dashboard Composition
Note
- The monitoring dashboard is automatically created when you create an account in the Samsung Cloud Platform Console and cannot be deleted.
- The widgets that make up the monitoring dashboard cannot be changed.
- To create a dashboard with a specific widget, use a custom dashboard. For more information on custom dashboards, see Using Custom Dashboards.
Understanding Common Dashboard Features
This section describes the features that can be used in the dashboard.
Downloading Widget Images
You can download a widget as an image file (*.png) by clicking the download button in the top-right corner of the widget area.
Viewing Detailed Graph Information
When you hover over a graph with your mouse cursor, detailed information appears in a popup.
Monitoring Status
Displays the number of monitored targets and their monitoring status for each service in use.
| Item | Description |
|---|---|
| Service Category | Displays the service category and the number of monitored targets for each service category
|
| Service List | Displays the list of services and the number of monitored targets included in the service category
|
| Monitoring Status | Displays the number of monitored targets and their current status
|
| Event Status | Displays the number of events that have occurred, classified by risk level (Fatal, Warning, Inform) |
Note
- The performance collection in the monitoring status displays the combined number of performance items for both Agent and Agentless methods.
Event History
Displays the number of events that occurred in the last 7 days as a graph by risk level.
- When you hover over the graph with your mouse cursor, the event risk level and the number of occurrences for the selected date appear in a popup.
- Occurrences: The total number of events that occurred
- Active: The number of events that continue to occur because they meet the event occurrence conditions
- Inactive: The number of events that no longer occur because they do not meet the event occurrence conditions
- You can click on the risk level legend area to hide or show the corresponding graph.
Top 5 Performance Usage
Displays the top 5 monitored targets with the highest performance usage as a graph.
- When you hover over the graph with your mouse cursor, the full name of the selected target and its current performance value appear in a popup.
- Clicking on the graph opens the Monitored Target Details popup window for the corresponding target.
| Item | Description |
|---|---|
| CPU Usage/Core [Basic] | The percentage of CPU time used, excluding Idle and IOWait states |
| Memory Used [Basic] | The current amount of used memory |
| Disk Read Bytes [Basic] | The number of disk read bytes |
| Disk Write Bytes [Basic] | The number of disk write bytes |
Note
- The monitoring dashboard only displays the performance of Virtual Servers. To display the top 5 performance of other service types, you must select and configure them in a custom dashboard.
Event Map
Displays the number of events that occurred for each service by risk level.
- When you hover over a square with your mouse cursor, the name of the monitored target appears in a popup.
- Clicking on a service item in the event map opens the Monitored Target Details popup window for the corresponding service.
Each item’s risk level is as follows.
| Item | Description |
|---|---|
| No Rule | A state where it is impossible to determine whether it is normal or abnormal. It means that there is no threshold setting value, so the state cannot be determined. |
| NORMAL | A normal state. It means that the threshold was not exceeded, so no event occurred. |
| INFORM | The lowest level of risk. It includes simple notification-level information. |
| WARNING | A medium level of risk. |
| FATAL | The highest level of risk. |
Event Status
Displays a list of events that have occurred and are still active.
- Events are displayed in the order they occurred most recently.
3.2.2 - Analyzing Performance
In Performance Analysis, you can check the main performance items of the monitoring target and view the current data and history of each performance item. Users can check the performance status of the monitoring target they manage by service or period and analyze the results by comparing specific performance.
Getting Started with Performance Analysis
You can start performance analysis by selecting a monitoring target directly or entering search conditions. To analyze performance by searching for a monitoring target, follow these steps:
- Click Cloud Monitoring Console > Performance Analysis. You will be moved to the Performance Analysis page.
- Enter the search conditions for the monitoring target you want to analyze in the search area, and then click Search.
| Item | Description |
|---|---|
| Search Area | Detailed search filters are displayed differently in the search area depending on the service type
|
| Number of Monitoring Targets Displayed | Displays the number of search results and the number of performance items that can be viewed at a time in the list
|
| Search Information | Displays the search result values for the search condition items
|
| Performance Indicator | Information Displays the main performance indicators for the monitoring target based on the service type
|
| Detailed View | Check the detailed information of the corresponding monitoring target |
| Performance Comparison | Select a monitoring target to compare performance |
Table. Performance Analysis
Checking Performance Details
To check the detailed performance information of a monitoring target, follow these steps:
- Click the monitoring target you want to check in the performance analysis list. The Monitoring Details popup window will open.
- Click the Performance tab.
- When you place the mouse cursor over the graph, the values of each performance item will appear in a popup window.
- You can set the query period or change the refresh cycle by clicking the icon in the top right corner.
- You can select the graph display method by clicking the Detailed or Summary buttons in the top left corner of the performance chart.
| Item | Description |
|---|---|
| Basic Information | Displays basic information about the monitoring target |
| Detailed | Displays the performance chart of the monitoring target in detail
|
| Summary | Displays the performance chart of the monitoring target in a checkerboard format
|
| Query Period Setting |
|
| Performance Comparison | Creates a chart to compare the performance of the monitoring target and makes it possible to compare each performance |
| Performance Chart | Displays the performance chart of the monitoring target as a graph
|
Table. Monitoring Target Details
Note
- The collection cycle of performance values may vary depending on the service.
- The data in the chart is expressed in 30 points, and the data collection interval according to the data query range (time) is as follows. (The expression point may vary depending on the collection time error)
- 30 minutes: approximately 1-minute interval
- 60 minutes: approximately 2-minute interval
- 3 hours: approximately 6-minute interval
- 6 hours: approximately 12-minute interval
- 12 hours: approximately 24-minute interval
- 24 hours: approximately 48-minute interval
- 3 days: approximately 144-minute interval (2 hours 24 minutes)
- 7 days: approximately 336-minute interval (5 hours 36 minutes)
- 14 days: approximately 672-minute interval (11 hours 12 minutes)
- Custom: The user-specified range (minutes) divided by 30
- Each point’s data is expressed as the maximum value in the query range (time), and you can change the statistical type in the detailed chart.
Comparing Performance
You can check the performance items of each monitoring target and select the desired performance items to compare.
Getting Started with Performance Comparison
You can create a chart to compare the performance of the monitoring target and compare each performance.
Note
- Only performance items of the same service type can be compared.
- Performance items may be added depending on the detailed attributes of the service type.
- Windows OS performance of VM
- Kibana-related performance of Search Engine
To start performance comparison, follow these steps:
Click Cloud Monitoring Console > Performance Analysis. You will be moved to the Performance Analysis page.
Enter the search conditions for the monitoring target you want to analyze in the search area, and then click Search.
Select all the monitoring targets you want to compare and click Performance Comparison. A popup window will open where you can compare performance.
Item Description Monitoring Target Displays the service type of the monitoring target to be compared. Click to change the service - Changing the service will delete all charts created so far.
- Click Add to search for and add the monitoring target of the currently selected service
- The selected monitoring target is displayed on the page, and you can delete the monitoring target by clicking X or Delete All
Performance Item Displays all performance items collected by the currently selected service - Check the performance items you want to compare, and they will be included in the chart.
Chart Display Method Selects the display method for the performance comparison chart - Detailed: The performance comparison chart is displayed in detail (default)
- Summary: The performance comparison chart is displayed briefly
Query Period Setting - Date/Time: Displays the query base time of the data
- Refresh: Refreshes the data directly to the current time.
- Start/Stop: Enables or disables the automatic refresh function.
- Settings: Sets the data query period or changes the automatic refresh cycle
Chart Area Displays a chart comparing the performance of the monitoring targets based on the selected performance items Click Add. A popup window will open where you can add a monitoring target.
Select the monitoring target you want to compare and click OK.
- If you select Kubernetes Engine, you must also select its subtype.
Check the performance items you want to compare. The corresponding performance items will be added to the chart.
Checking the Chart
The performance comparison result is displayed as a chart. You can change the shape of the created chart or download it as an image or Excel file.
- When you place the mouse cursor over the graph, the performance item value at the specified time appears in a popup window.
- You can hide or show the graph by clicking the target item in the legend area.
Item Description Statistical Method Sets the statistical method to be displayed as a graph - Displays statistics from 5 minutes to 6 hours.
- Basic, Maximum, Minimum, Average, Sum can be selected, and multiple methods can be selected at the same time. The selected items are displayed in the legend area
Chart Type Selects the type of graph to be displayed in the chart - Line: Line graph
- Stacked Area: Area graph
- Scatter: Scatter graph
Chart Download Checks and downloads the raw data of the chart - Chart PNG File: Downloads the chart as an image file (PNG).
- Chart Excel File: Downloads the data of the performance items displayed in the chart as an Excel file. The chart display data is a set of data automatically collected according to the query range.
- Raw Excel File: Downloads all the data of the performance items displayed in the chart for the query range period as an Excel file.
Time Series Graph Widget Addition Adds the chart to a user-defined dashboard as a time series graph widget - Clicking will open a popup window to add a time series graph widget.
Delete Deletes the performance comparison result chart Performance Comparison Status Displays the performance comparison result as a graph - When you place the mouse cursor over the graph, the performance comparison status at that time is displayed in a popup window.
3.2.3 - Analyzing Logs
In log analysis, the log of the monitoring target is collected and its contents are checked, and it can be monitored by converting it into an indicator, which is a structured data. Basic collection logs are provided for each monitoring target, and users can create custom logs to collect and check desired logs in addition.
Reference
To use log analysis, you must install and operate a log collection agent in advance. For more information on installing and operating log agents, please refer to Managing Agents.
To collect logs from Kubernetes Engine, you must set up log collection in the Samsung Cloud Platform Console.
Start log analysis
You can check the log status list or search for the monitoring target log to check. To check the log status list, follow the procedure below.
- Cloud Monitoring Console > Log Analysis > Log Status을 클릭하세요. Log Status 페이지로 이동합니다.
- Enter the search conditions of the service to be analyzed in the search area, and then click Log Search.
- A list of services that match the search criteria and search information will be displayed at the bottom.
- Clicking the Detail View button for each service displays detailed log information for the service.
Item Description Search Area The search filters displayed in the search area may vary depending on the service type - Advanced Search can be done by clicking the Advanced Search button.
- Each detailed search filter condition item can be selected one or more
Number of items to display for monitoring targets Displays the number of search results and the performance number that can be viewed at once in the list - The default is to view 20 at a time.
- The number of items listed can be changed to view 10, 20, 30, 40, 50, or 100 at a time
Search Information Displays the search result value for the search condition item Detailed View Check the detailed information of the corresponding monitoring target Log Search Search logs by combining keywords and queries and check detailed history
Reference
If a Virtual Server or Node connected to the monitoring target exists, the status diagram will also be displayed in the search information area.
The name of the monitoring target can use Korean, English uppercase and lowercase letters, numbers, and special symbols (
-, _, .) and can be entered up to a maximum of 100 characters.
If the monitoring target does not have permission, information about the target without permission and a permission check message will be displayed as a pop-up.Check log details
You can view the detailed log records and log graphs of the monitoring target.
Checking the log list
You can check the log details in the monitoring detail pop-up window. To check the monitoring details of the log, follow the next procedure.
Cloud Monitoring Console > Log Analysis > Log Status을 클릭하세요. Log Status 페이지로 이동합니다.
Click on the log to check the detailed information on the Log Status page. The Monitoring Details popup window will open.
Click the log tab. When you place the mouse cursor on the graph, the value of each log item appears in a popup window.
- You can set the inquiry period or change the refresh cycle by clicking the icon at the top right.
- You can select the graph display method by clicking the Detail, Summary buttons at the top left of the log chart.
Item Description Basic Information Displays basic information about the monitoring target Details The chart for each log of the monitoring target is unfolded and displayed - Check one chart in detail
Summary Performance charts of monitoring targets are displayed in a checkerboard format - Check multiple charts at a glance
Setting the inquiry period - Date/Time: Displays the standard time of the data inquiry.
- Refresh: Refreshes directly to the current time.
- Start/Stop: Turns the automatic refresh function on or off.
- Settings: Sets the data inquiry period or changes the automatic refresh cycle
Performance comparison Combine keywords and queries to search logs and check detailed history Performance-based chart The log-based chart of the monitoring target is displayed as a graph - If you place the mouse cursor over the graph, the log item value at the specified time will appear in a popup window.
Check by searching the log
You can search logs by combining keywords and queries, and check the details.
Reference
The presence and frequency of keywords can be converted into indicators and displayed as charts on the dashboard page, or set up related events to receive notifications.
To search logs, follow the next procedure.
Cloud Monitoring Console > Log Analysis > Log Status을 클릭하세요. Log Status 페이지로 이동합니다.
Click Log Status on the Log Search page. It moves to the Log Search page.
Item Description Monitoring target Indicates the type of service for the monitoring target to be compared - Click the monitoring target list to change the service
- If the service is changed, all charts created so far will disappear.
- Click the Add button to search for and add the monitoring target of the currently selected service
- The selected monitoring target is displayed on the page, and you can delete the monitoring target by clicking X or Delete all.
Search Condition Set the condition for the log to be searched Setting the inquiry period - Date/Time: Displays the standard time of the data inquiry.
- Refresh: Refreshes directly to the current time.
- Start/Stop: Turns the auto-refresh function on or off.
- Settings: Sets the data inquiry period or changes the auto-refresh cycle
The graph of log occurrence Log occurrence graph Occurrence log message Log messages that occurred from the monitoring target are displayed by time Add button is clicked. A popup window that can add a monitoring target will open.
Click the monitoring target and select the log file you want to add.
Once the log file selection is complete, click the Confirm button.
Enter the search conditions and click the Search button. The search results will be displayed on the log volume graph and the occurred log message.
Item Description Add Metric Add a metric to the log search results - Use after searching logs
Execution History Check the list of search conditions that were recently executed for the search - Execution history displays up to 20 most recently executed search conditions
- Select the desired execution history to input as the current search condition
Search field Select search field Condition Select search condition like,!like,=,!=,<=,>=,>,<can be selected
Search value Enter the keyword to search Log Search Select an operator (AND, OR) for the newly added search condition - Only displayed when a new search condition is added
Add condition Add new search condition When searching logs, the log history corresponding to the entered condition is displayed as a chart.
- Log history is displayed in seconds.
Item Description Log occurrence graph The log occurrence during the set period is displayed as a graph - If you place the mouse cursor over the graph, the value of each log item appears in a popup window.
- Clicking on the bar graph of the graph displays the list of logs at that point in time.
Setting the inquiry period - Date/Time: Displays the reference time of the data
- Refresh: Refreshes directly to the current time.
- Start/Stop: Turns the automatic refresh function on or off.
- Settings: Sets the data inquiry period or changes the automatic refresh cycle
Monitoring target The monitoring target list is displayed - If you select a monitoring target to check the log message, the contents will be displayed in the log list
Log list Log messages that occurred in the monitoring target are displayed by time - Clicking the button in the log list displays the full message of the log
- Click download to download the currently displayed log message in Excel and TXT file formats
- Log history is displayed in seconds.
Check the status of log collection
You can check the collection information of major logs for the past 7 days in a chart.
When you place the mouse cursor on the graph, detailed information appears in a pop-up window. Only collected logs are aggregated, and uncollected logs are not displayed in the current status.
Reference
When you create an * Account, it provides 1GB of virtual capacity by default to store the collected logs.
- All logs can be stopped and restarted for collection as needed.
To check the log collection status, click Cloud Monitoring Console > Log Analysis > Log Collection Dashboard.
| Item | Description |
|---|---|
| Accumulated log occurrence amount | Amount of logs collected from the 1st of each month, displayed in GB
|
| Recent 7-day log collection amount | The amount of logs collected over the past 7 days is displayed in a graph by service type
|
| Service-specific log occurrence rate | Displays the log collected over the past 7 days, classified by service
|
| Log Collection Top 10 | Displays the top 10 monitoring targets with the most logs collected in the last 7 days within the selected service in the log occurrence rate by service as a graph
|
Reference
To perform monitoring related to logs, you must install and operate the log collection agent in advance. For more information on installing and operating log agents, please refer to Managing Agents.
The accumulated log is stored up to a maximum of 1GB. If 1GB is exceeded, old logs are automatically deleted from oldest to newest.
Check the status of the indicator settings
You can create metrics to display the occurrence of log patterns over time as a time series. To check the list of metrics, click Cloud Monitoring Console > Log Analysis > Current Metric Settings.
Reference
The metrics converted to time series data can be set as an event or registered on the dashboard for real-time monitoring.
| Item | Description |
|---|---|
| Search area | The search filter displayed in the search area may vary depending on the service type
|
| Number of items to display for monitoring targets | Display search results
|
| Search Information | Displays the search result value for the search condition item |
| Add | Add a new indicator |
| Delete | Select and delete indicators in search information |
Check the details of the indicator
To view detailed information about the metric, follow these steps.
- Cloud Monitoring Console > Log Analysis > Metric Setting Status will be clicked. It moves to the Metric Setting Status page.
- On the Indicator Setting Status page, click the indicator name to check detailed information. The Indicator Details popup window will open.
Adding Indicators
You can add new metrics to display the desired log data as a time series.
Reference
The log indicator can only be set for the monitoring target where the log agent is installed or logs are collected. For more information on installing and operating log agents, see Managing Agents.
To add a new metric, follow the procedure below.
Cloud Monitoring Console > Log Analysis > Metric Setting Status will be clicked. It moves to the Metric Setting Status page.
On the Indicator Setting Status page, click the Add button. The Add Indicator popup window opens.
Indicator Name을 입력하세요.
- Indicator names can only use English uppercase and lowercase letters, underscores (_), periods (.), and hyphens (-).
- To distinguish metrics from general performance, the prefix
metricfilter.is automatically added and cannot be deleted or changed.
Item Description Indicator Name Enter the name of the new indicator to be created Monitoring Target Indicates the type of service for the monitoring target to be compared - Click the monitoring target list to change the service
- If the service is changed, all charts created so far will disappear.
- Click the add button to search for and add the monitoring target of the currently selected service
- The selected monitoring target is displayed on the page and can be deleted by clicking X or delete all
Search Conditions Set conditions for logs to be searched Set query period - Date/Time: Displays the reference time for data query
- Refresh: Refreshes directly to the current time.
- Start/Stop: Turns automatic refresh on or off.
- Settings: Allows setting the data query period or changing the automatic refresh cycle.
Log Volume Graph When searching for logs, the log history that matches the entered conditions is displayed as a chart Occurrence Log Message Log messages that occurred from the monitoring target are displayed by time Add button is clicked. A popup window that can add monitoring targets will be opened.
Click the monitoring target and select the log file you want to add.
Once the log file selection is complete, click the Confirm button.
Enter the search conditions and click the Search button. The search results will be displayed in the log volume graph and occurrence log message.
Item Description Add Metric Add metrics to log search results - Use after searching logs
Execution History Check the list of search conditions that were recently executed for searching - Execution history displays up to 20 most recently executed search conditions
- Can input the desired search history as the current search condition
Search Field Select Search Field Condition Select search condition like,!like,=,!=,<=,>=,>,<can be selected
Search value Enter the keyword to search Operator Select an operator (AND, OR) for the newly added search condition - Only displayed when a new search condition is added
Add condition Add new search condition Click the Confirm button. A new metric will be added with a toast popup message.
Modifying Indicator Search Conditions
To modify the search criteria of the indicator, follow the next procedure.
- Cloud Monitoring Console > Log Analysis > Metric Setting Status will be clicked. It moves to the Metric Setting Status page.
- On the Indicator Setting Status page, click the Indicator Name of the indicator you want to modify. The Indicator Details popup window will open.
- Indicator Details popup window, click the Edit button. The Edit Indicator popup window opens.
- In the Modify Indicator popup window, modify the search conditions and click the Confirm button. The indicator will be modified along with a toast popup message.
Deleting Indicators
To delete an indicator, follow these steps.
Reference
If there are charts or event policies using the metric you want to delete, you cannot delete the metric.
- Cloud Monitoring Console > Log Analysis > Metric Setting Status을 클릭하세요. Metric Setting Status 페이지로 이동합니다.
- On the Indicator Setting Status page, select the indicator to be deleted and click the Delete button. The indicator will be deleted along with a toast popup message.
3.2.4 - Managing Events
An event is a setting that alerts users when the performance value of a monitored target meets certain conditions. By setting up events, users can grasp important monitoring information without missing it. For example, if an event is set to occur when a performance value related to overload exceeds a certain threshold, users will receive notifications whenever there is a risk of overload while operating the resource. Users can then take action before problems occur.
In event management, users can create events to alert designated users when specific values occur during monitoring.
Checking Event Status
The event status section displays information about all occurred events, related performance items, and event notification history. To check the event status list, follow these steps:
- Click Cloud Monitoring Console > Event Management > Event Status. The Event Status page will be displayed.
- On the Event Status page, enter the search conditions for the service you want to check in the search area, and then click the Search button.
Item Description Search Area The search filter displayed in the search area varies depending on the service type. - Click the Detailed Search button to perform a detailed search.
- Multiple conditions can be selected for each detailed search filter.
Number of Monitoring Targets Displayed Displays the number of search results and the number of performance items that can be viewed at once in the list. - The default value for the number of performance items displayed in the list is 20 per page.
- The number of performance items displayed in the list can be changed to 10, 20, 30, 40, 50, or 100 per page.
Search Information Displays the search result values for the search condition items. - Clicking on the message content for each service allows you to check the detailed information of the event.
Detailed View Displays detailed information about the corresponding monitoring target. Table. Event List
Note
- If a Virtual Server or Node is connected to the monitoring target, the status will also be displayed in the search information area.
- The name of the monitoring target can include Korean, English ( uppercase and lowercase), numbers, and special characters (-, _, .), with a maximum of 100 characters.
Viewing Event Status List
In the monitoring detail popup window, you can check the event information, occurrence time, and duration. To check the event occurrence status, follow these steps:
- Click Cloud Monitoring Console > Event Management > Event Status. The Event Status page will be displayed.
- On the Event Status page, click the Event tab.
Item Description Event Status Displays the event message and occurrence time. Active Displays only events that are currently active. All Displays all events. Event Details Displays detailed information about the selected event message. Table. Event Tab
Checking Event Details
To check the event details, follow these steps:
- Click Cloud Monitoring Console > Event Management > Event Status. The Event Status page will be displayed.
- On the Event Status page, click the Event tab.
- On the Event Status page, select the event you want to check the details for, and then click Event Details. You can then check the event issuance conditions, performance items, and notification history.
| Item | Description |
|---|---|
| Monitoring Target | Displays the name of the monitoring target. |
| Occurrence Condition | Displays the occurrence condition of the event. |
| Performance Item | Displays a chart for the performance item.
|
| Notification History | Displays the entire notification history. |
| Event Setting Details | Displays the setting information for the corresponding event. |
Table. Event Details
Managing Event Settings
You can set up detailed event settings, such as the monitoring target, performance value that serves as the basis for event occurrence, event risk level, and event notification recipient. When the data collected from the monitoring target meets the conditions set in the event policy, notifications are sent to users via email, SMS, or messaging.
Note
- Event policies can only be set when a monitoring target is specified, and policies for Auto-Scaling Groups can be set on a group-by-group basis.
Checking Event Settings
To check the event settings, follow these steps:
- Click Cloud Monitoring Console > Event Management > Event Settings. The Event Settings page will be displayed.
- On the Event Settings page, enter the search conditions for the service you want to check in the search area, and then click the Search button.
Item Description Search Area The search filter displayed in the search area varies depending on the service type. - Click the Detailed Search button to perform a detailed search.
- Multiple conditions can be selected for each detailed search filter.
Number of Monitoring Targets Displayed Displays the search results. - The default value is 20 per page.
- The number of performance items displayed in the list can be changed to 10, 20, 30, 40, 50, or 100 per page.
Monitoring Target Displays the name of the monitoring target. - Checking the box selects the monitoring target, and the Delete, Activate, and Notification Recipient buttons are activated.
Performance Item Displays the performance item that is the target of the event setting. Individual Item Displays the individual performance item under the performance item. - If there are no individual items, they will not be displayed.
Type/Unit Displays the value type and unit of the corresponding performance item. Event Level Displays the risk level of the corresponding event. - The risk level is set by the user when adding an event.
- Fatal: The most critical level.
- Warning: The middle level of risk.
- Information: The lowest level of risk and reference level.
Threshold Displays the reference value used to compare the performance value. Notification Recipient Displays the recipient of the event notification. - Placing the mouse cursor over the name displays the entire list.
Policy Status Displays whether the event is activated or not. Detailed View Displays detailed event information and allows modification. - Clicking Detailed View opens a popup window with detailed information about the corresponding event.
Add Adds an event. Delete Deletes an event. Activate Activates or deactivates an event. Notification Recipient Displays and manages event notification recipients. Table. Event Settings
Note
- The name of the monitoring target can include Korean, English (uppercase and lowercase), numbers, and special characters (-, _, .), with a maximum of 100 characters.
- If you do not have permission for the monitoring target, a message will be displayed indicating that you do not have permission, along with the target information.
Checking Detailed Event Settings
You can check detailed information about the monitoring target and event conditions, and modify the event conditions and notification information.
Adding Event Settings
To add event settings, follow these steps:
Note
- Event policies can only be set when a monitoring target is specified.
- Policies for Auto-Scaling Groups can be applied on a group-by-group basis.
Click Cloud Monitoring Console > Event Management > Event Settings. The Event Settings page will be displayed.
On the Event Settings page, click the Add button. The Add Event Settings popup window will be displayed.
Item Description Target Name Select the monitoring target to add event settings for. - Clicking the monitoring target list changes the service.
- Changing the service will delete all event conditions created so far.
- Click the Add button to search for and add the monitoring target of the currently selected service.
- The selected monitoring target is displayed on the page, and you can delete the monitoring target by clicking the X or Delete All button.
Event Settings Area Set the performance and occurrence conditions for the event. Notification Information Area Set the notification recipient and notification method for the event. Table. Add Event Settings Popup WindowIn the monitoring target area, select the service type and then click the Add button. The Add Monitoring Target popup window will be displayed.
Select the monitoring target and then click the Confirm button.
- You can select multiple monitoring targets at the same time.
- If there are multiple monitoring targets, the set event will be added to each monitoring target.
- If you select Kubernetes, you must also select the subtype.
In the performance item area, click the performance item you want to add an event for, and then enter the event occurrence condition.
- The number of times the performance item is added is displayed next to the performance item name.
- If you select multiple performance items, you must enter the event occurrence condition for each performance item.
Item Description Event Policy Template Select an existing event policy template to apply. Performance Item Click the performance item to set the event occurrence condition. Event Level Set the event level. - Fatal: The most critical level.
- Warning: The middle level of risk.
- Information: The lowest level of risk and reference level.
Performance Type Select the reference value used to determine whether the event occurs. - Collected Value: Uses the current value.
- Delta Value: Uses the difference between the previous value and the current value.
Threshold Set the reference value used to compare the performance value. - This is the criterion for determining whether the event occurs.
- Only numbers and decimal points can be entered.
Comparison Method Select the method used to compare the performance value and the threshold. - Range: Checks if the performance value is within the specified range of the threshold.
- Match: Checks if the performance value matches the threshold.
- Mismatch: Checks if the performance value does not match the threshold.
- Greater Than: Checks if the performance value is greater than the threshold.
- Greater Than or Equal To: Checks if the performance value is greater than or equal to the threshold.
- Less Than: Checks if the performance value is less than the threshold.
- Less Than or Equal To: Checks if the performance value is less than or equal to the threshold.
Individual Item Specifies the individual performance item under the performance item as the event condition. - This is only activated if the performance item can collect individual items.
Prefix Adds a prefix to the event message. - This is used as a keyword to search for the event in the Event Status page.
Statistics Sets the statistical method to apply to the collected performance values. - If a statistical method is set, the performance value to which the statistical method is applied is compared to the threshold to determine whether the event occurs. If not set, the most recent performance value is compared to the threshold.
- Statistical Method: Selects one of the maximum, minimum, average, or sum to calculate the collected performance values.
- Statistical Period: Sets the period for which the statistical method is applied. This is the period from the most recently collected performance value.
Continuous Occurrence Count Sets the number of consecutive monitoring values that meet the event occurrence condition. - This value is used as sensitivity to determine whether the event is a momentary anomaly or an actual event.
Event Occurrence Notification Time Sets the time zone for event policy settings. Table. Add Event Settings - Event Settings Area
In the Notification area, you can set up notifications.
Item Description Notification Recipient Selection Area Select the notification recipient. - Clicking the Delete button after selecting the notification recipient deletes the recipient.
Notification Recipient/Group Displays the list of recipients to whom the event notification will be sent. Event Risk Level Displays the risk level of the set event. Notification Method Displays the method used to send notifications to the recipient. Add Adds a new notification recipient from the address book. Delete Deletes the notification recipient from the list. Table. Add Event Settings - Notification Information AreaCheck the notification recipient and then click the Confirm button.
Note
- Only the Root user or IAM user of an account can be added as a notification recipient.
- Multiple recipients can be selected at the same time.
Set the notification method for each notification recipient based on the event risk level.
- The notification method can be selected from email, SMS, or messaging, and multiple methods can be selected at the same time.
After setting the notification method, click the Confirm button.
Modifying Event Settings
To modify the event conditions and notification recipient information, follow these steps:
- Click Cloud Monitoring Console > Event Management > Event Settings. The Event Settings page will be displayed.
- On the Event Settings page, enter the search conditions for the service you want to modify in the search area, and then click the Search button.
- In the event policy list, click the Detailed View button for the event policy you want to modify. The Event Setting Details page will be displayed.
- On the Event Setting Details page, click the Modify button. The Modify Event Settings page will be displayed.
- On the Modify Event Settings page, enter the modified information and then click the Confirm button.
- You can modify the event conditions and notification information.
Deleting Event Settings
To delete event settings, follow these steps:
- Click Cloud Monitoring Console > Event Management > Event Settings. The Event Settings page will be displayed.
- On the Event Settings page, enter the search conditions for the service you want to delete in the search area, and then click the Search button.
- In the event policy list, check the event policy you want to delete and then click the Delete button.
- In the confirmation popup window, click the Confirm button.
Changing Event Setting Activation
You can easily change the activation status of event policies.
- Click Cloud Monitoring Console > Event Management > Event Settings. The Event Settings page will be displayed.
- On the Event Settings page, enter the search conditions for the service you want to delete in the search area, and then click the Search button.
- In the event policy list, check the event policy you want to change the activation status for and then click the Activate button. The Policy Activation popup window will be displayed.
- Select the activation status and then click the Confirm button.
- You can change the activation status in bulk by clicking the Activate All or Deactivate All button.
Note
Deactivating an event policy will deactivate all active events that occurred due to the selected event policy.
Changing Event Notification Recipients
You can check and change the notification recipients for event occurrences in bulk.
Note
- The event notification recipient change function is intended to change the notification recipients in bulk. Therefore, existing notification recipients will be deleted and changed to the new notification recipient settings.
- To check and change the notification recipients for each policy, click the Modify button on the policy details page.
Click Cloud Monitoring Console > Event Management > Event Settings. The Event Settings page will be displayed.
On the Event Settings page, enter the search conditions for the service you want to delete in the search area, and then click the Search button.
In the event policy list, check the event policy you want to modify and then click the Notification Recipient button. The Notification Recipient page will be displayed.
On the Notification Recipient page, select the user to add as a notification recipient and then click the Confirm button.
Item Description Event Policy List Displays the list of event policies to change the notification recipients for. - Click Add to add policies to change.
- Clicking the Delete button for a policy deletes the policy.
User Search Area Enter the name, email, phone number, or company name to search for users. Notification Address Book Use the address book to check and add users. Search User List Displays the list of users included in the address book or search results. - Checking the user adds them to the notification recipient list.
Notification Recipient List Displays the list of users to be added as notification recipients for the event policies displayed in the list. - Checking the user and clicking the Delete button removes the user from the list.
Table. Changing Event Notification Recipients
Managing Event Templates
You can create event templates by setting monitoring targets, performance values that serve as the basis for event occurrence, and event risk levels. When adding or modifying events, you can use event policy templates to easily enter event conditions.
Checking the Event Policy Template List
To check the event policy template list, follow these steps:
Click Cloud Monitoring Console > Event Management > Event Settings. The Event Settings page will be displayed.
On the Event Settings page, click Event Policy Template. The Event Policy Template page will be displayed.
On the Event Policy Template page, enter the search conditions for the service you want to check in the search area, and then click Search.
Item Description Search Area Enter the conditions for the event policy template to search Add Event Policy Template Add an event policy template Template List Displays the event policy templates that match the search conditions Table. Event Policy Template List
Adding an Event Policy Template
To add an event policy template, follow these steps:
Click Cloud Monitoring Console > Event Management > Event Settings. The Event Settings page will be displayed.
On the Event Settings page, click the Event Policy Template button. The Event Policy Template page will be displayed.
On the Event Policy Template page, click the Add Event Policy Template button. The Add Event Policy Template popup window will open.
In the Add Event Policy Template popup window, set the service type and template information to add the event policy template.
*indicates required input items.Item Description Service Type Select the service type to set the event policy Template Name Enter the name of the template to create Template Description Enter a description of the template to create Table. Adding an Event Policy Template - Service Type and Template Name Settings
In the performance item section, click the performance item to add an event and enter the event occurrence conditions.
- The number of times the performance item is added is displayed next to the performance name.
- If multiple performance items are selected, event occurrence conditions must be entered for each performance item.
*indicates required input items.Item Description Load Event Policy Template Select an existing event policy template to apply Performance Item Click the performance item to set the event condition Event Level Set the event risk level Performance Type Select the performance value to use as the basis for event occurrence Threshold Set the threshold value to compare with the collected performance value Comparison Method Select the comparison method to determine event occurrence Individual Item Specify individual performance items as event conditions Prefix Add a prefix to the event message Statistics Set the statistical method to apply to the collected performance value Continuous Occurrence Count Set the number of consecutive monitoring values that meet the event occurrence conditions Event Occurrence Notification Time Set the time zone for event policy settings Table. Adding an Event Policy Template - Performance Item
Set the notification target and method when an event occurs.
Item Description Add Add a new notification target Delete Delete the selected notification target Notification Target/Group Displays the list of notification targets Event Risk Level Displays the event risk level to be notified Notification Method Displays the notification method Table. Adding an Event Policy Template - Notification Target Settings
Note
- Only account members and address book registered in the account can be added as notification targets.
- Multiple targets can be selected at the same time.
- Click the Confirm button. The event policy template will be added, and a toast popup message will be displayed.
Modifying and Deleting an Event Policy Template
To modify or delete an event policy template, follow these steps:
- Click Cloud Monitoring Console > Event Management > Event Settings. The Event Settings page will be displayed.
- On the Event Settings page, click the Event Policy Template button. The Event Policy Template page will be displayed.
- On the Event Policy Template page, enter the search conditions for the service you want to check in the search area, and then click the Search button.
- Click the More button at the top right of the template you want to modify or delete, and then click Modify or Delete.
- Modify: The template modification popup window will open. Modify the template and click the Confirm button.
- Delete: The template will be deleted, and a toast popup message will be displayed.
- Click the Confirm button. The template will be deleted, and a toast popup message will be displayed.
Sharing an Event Policy Template
To share an event policy template, follow these steps:
- Click Cloud Monitoring Console > Event Management > Event Settings. The Event Settings page will be displayed.
- On the Event Settings page, click the Event Policy Template button. The Event Policy Template page will be displayed.
- On the Event Policy Template page, enter the search conditions for the service you want to check in the search area, and then click the Search button.
- Click the More > Share button at the top right of the template you want to share.
- Select the user to share with and click the > button. The selected user will be added to the shared target.
- Click the Confirm button. The template will be shared, and a toast popup message will be displayed.
Event Filtering
You can filter event notifications for a specific period. During the event filtering period, events will occur, but notifications will not be delivered.
To check the event filtering list, follow these steps:
- Click Cloud Monitoring Console > Event Management > Event Filtering. The Event Filtering page will be displayed.
| Item | Description |
|---|---|
| Filtering Timeline | Displays the registered filtering timeline by date |
| Filtering List | Displays the registered filtering information and action status in a list |
| Add | Adds a new event filtering |
| Delete | Deletes the selected event filtering |
| Search Area | Searches for event filtering or monitoring targets |
Table. Event Filtering List
Note
The filtering timeline chart is displayed based on the time zone set for the logged-in user’s account.
Adding Event Filtering
To add event filtering, follow these steps:
Click Cloud Monitoring Console > Event Management > Event Filtering. The Event Filtering page will be displayed.
On the Event Filtering page, click the Add button. The Add Event Filtering popup window will open.
In the Add Event Filtering popup window, enter the filtering information.
Item Description Event Filtering Enter the name of the event filtering Usage Set the usage of the event filtering Time Zone Set the time zone for the event filtering Repeat Type Set the repeat type of the event filtering Period Set the period for the event filtering Event Filtering Target Select the service type and monitoring target to apply the event filtering Table. Adding Event FilteringClick the Confirm button. The event filtering will be added, and a toast popup message will be displayed.
Note
The event filtering modification task can be used to change the usage of the event filtering.
Modifying Event Filtering
To modify event filtering, follow these steps:
- Click Cloud Monitoring Console > Event Management > Event Filtering. The Event Filtering page will be displayed.
- On the Event Filtering page, click the name of the filtering you want to modify. The Event Filtering Details popup window will open.
- In the Event Filtering Details popup window, click the Modify button. The Modify Event Filtering popup window will open.
- In the Modify Event Filtering popup window, enter the modified contents and click the Confirm button. The event filtering will be modified, and a toast popup message will be displayed.
Deleting Event Filtering
To delete event filtering, follow these steps:
- Click Cloud Monitoring Console > Event Management > Event Filtering. The Event Filtering page will be displayed.
- On the Event Filtering page, select the event filtering you want to delete and click the Delete button. The event filtering will be deleted, and a toast popup message will be displayed.
- Multiple event filterings can be selected at the same time.
Managing Notification Groups
You can manage notification targets as a group when an event occurs. Notification Groups can be used to efficiently manage notification targets and easily set up notifications.
To check the Notification Groups, follow these steps:
- Click Cloud Monitoring Console > Event Management > Notification Groups. The Notification Groups page will be displayed.
- On the Notification Groups page, you can check and manage the notification groups.
Item Description Add Notification Group Adds a new notification group Notification Group Displays all notification groups created by the user Detailed Search Searches for notification groups by name Keyword Search Searches for notification groups, user names, creation dates, and last modification dates
Note
Notification Groups are only valid within the account, so they can only be composed of users with access permissions to the account. Users who have been deleted from the access permissions are automatically excluded from the address book.
Adding a Notification Group
To add a notification group, follow these steps:
- Click Cloud Monitoring Console > Event Management > Add Notification Group.
- On the Add Notification Group page, enter the notification group name, description, and add users.
- Click the Save button. The notification group will be added.
Modifying a Notification Group
You can add users to a notification group or delete registered users from the group.
Adding Users
To add users to a notification group, follow these steps:
- Click Cloud Monitoring Console > Event Management > Notification Groups.
- Click the notification group you want to add users to, and then click Modify.
- Select the users to add.
- Only account members can be added to the address book.
- You can use the real-time search GUI to quickly find the desired members.
- Click the Save button. The user address will be added, and a toast popup message will be displayed.
Deleting a Notification Group
To delete a notification group, follow these steps:
- Click Cloud Monitoring Console > Event Management > Notification Groups.
- Click the notification group you want to delete.
- Select the notification group to delete and click Delete.
- Multiple addresses can be selected at the same time.
- Click the Confirm button. The address will be deleted, and a toast popup message will be displayed.
3.2.5 - Using Custom Dashboards
A custom dashboard is a user-defined dashboard that allows users to select and arrange widgets according to their preferences. Users can customize the monitoring information and share the created custom dashboard with other users.
The following content is covered in Using Custom Dashboards.
Note
Custom dashboards are created separately from the Account dashboard and can display monitoring information from multiple Accounts at once.
Getting Started with Custom Dashboards
Users can create a custom dashboard and add desired widgets to view monitoring information.
Creating a Custom Dashboard
To create a custom dashboard, follow these steps:
- Click Custom Dashboard Management in the top-right menu. The Custom Dashboard Management page will be displayed.
- Click Add Dashboard. The Add Dashboard popup window will open.
- Enter the name of the dashboard to be created and click the Save button.
- The created custom dashboard will be displayed in the My Dashboards list.
Adding Widgets
Custom dashboards provide various types of widgets, such as performance statistics, comparison charts, and event lists. Users can add widgets to customize their dashboard according to their monitoring needs.
Note
- Created widgets can be modified, copied, or deleted. For more information, see Managing Custom Widgets.
To add a widget, follow these steps:
- Click Custom Dashboard Management in the top-right menu. The Custom Dashboard Management page will be displayed.
- Select the custom dashboard to add a widget from the My Dashboards list.
- Click the + button or Add Widget button in the top-right corner of the dashboard. The Add Widget popup window will open.
- Select the widget to add to the dashboard from the Add Widget popup window.
- When a widget is selected, detailed settings and previews will be displayed.
- For each chart, see Custom Widgets for explanations and setup methods.
- Click the Confirm button.
Note
Widgets are added to the dashboard with a default size.
Custom Widgets
The following types of widgets can be added to a custom dashboard:
| Widget Name | Description |
|---|---|
| Title Box | Displays a title box on the custom dashboard. |
| Event Status | Displays the status of occurred events. |
| Monitoring Status | Displays the number of monitoring targets and their status. |
| Top 5 Performance | Displays the top 5 monitoring targets with the highest performance usage rates. |
| Event Map | Displays the number of events occurred by service and risk level. |
| Event History | Displays the number of events occurred by date and risk level. |
| Time Series Graph | Displays the performance of a selected monitoring target as a time series graph. |
| Status Indicator | Displays the statistical values and risk levels of monitoring targets. |
| Instance Map | Displays the performance values of monitoring targets with different color densities. |
Table. Custom Dashboard Widget Types
Title Box
Displays a title box on the custom dashboard.
- Up to 10 title boxes can be created.
- Multiple title boxes can be added at the same time.
| Item | Description |
|---|---|
| Title | Enter the text to be displayed on the title box. |
| Add | Adds a new text box. |
| Delete | Deletes the corresponding text box. |
Table. Custom Dashboard Title Box
Event Status
Displays the status of occurred events.
- All occurred events can be displayed, or only active events can be displayed.
| Item | Description |
|---|---|
| Widget Name | Enter the name of the widget. |
| Query Range | Select the range of events to be displayed on the widget. |
Table. Event Status
Monitoring Status
Displays the number of monitoring targets and their status.
| Item | Description |
|---|---|
| Widget Name | Enter the name of the widget. |
Table. Monitoring Status
Top 5 Performance
Displays the top 5 monitoring targets with the highest performance usage rates.
| Item | Description |
|---|---|
| Widget Name | Enter the name of the widget. |
| Service | Select the service to check performance. |
| Performance Item | Select the performance item to display. |
Table. Top 5 Performance
Event Map
Displays the number of events occurred by service and risk level.
| Item | Description |
|---|---|
| Widget Name | Enter the name of the widget. |
Table. Event Map
Event History
Displays the number of events occurred by date and risk level.
| Item | Description |
|---|---|
| Widget Name | Enter the name of the widget. |
Table. Event History
Time Series Graph
Displays the performance of a selected monitoring target as a time series graph.
- The time series graph can be changed using the dashboard’s query period setting feature.
- When the mouse cursor is placed over the graph, the time and target performance values can be checked.
| Item | Description |
|---|---|
| Widget Name | Enter the name of the widget. |
| Service | Select the service to check performance. |
| Monitoring Target | Select the monitoring target to display on the graph. |
| Performance Item | Select the performance item to display on the graph. |
| Add Option | Risk intervals can be displayed. |
Table. Time Series Graph
Note
The graph type can be changed by clicking the icon in the top-right corner of the preview.
- Line graph
- Area graph
- Cumulative bar graph
- Scatter graph
Status Indicator
Displays the statistical values and risk levels of monitoring targets.
When the mouse cursor is placed over the status indicator on the monitoring dashboard, detailed information about the item can be checked.
| Item | Description |
|---|---|
| Widget Name | Enter the name of the widget. |
| Service | Select the service to check performance. |
| Monitoring Target | Select the monitoring target to display on the graph. |
| Performance Item | Select the performance item to display on the graph. |
| Statistics | Select the statistical method to display the performance values of the monitoring target. |
| Add Option | Risk intervals can be displayed. |
Table. Status Indicator
Instance Map
Displays the performance values of monitoring targets with different color densities.
- When the mouse cursor is placed over each heatmap, detailed information about the item can be checked.
| Item | Description |
|---|---|
| Widget Name | Enter the name of the widget. |
| Service | Select the service to check performance. |
| Monitoring Target | Select the monitoring target to display on the graph. |
| Performance Item | Select the performance item to display on the graph. |
Table. Instance Map
Viewing Custom Dashboards
To view a custom dashboard, follow these steps:
- Click Custom Dashboard Management in the top-right menu. The Custom Dashboard Management page will be displayed.
- Select the custom dashboard to view from the My Dashboards list.
| Item | Description |
|---|---|
| Dashboard List | Displays the list of custom dashboards. The list can be clicked to change the dashboard to be viewed. |
| Dashboard Name | Displays the name of the user-defined dashboard. |
| Dashboard Settings |
|
| Add Widget | Adds a new widget to the dashboard. |
| Edit Dashboard | Allows editing the currently set custom dashboard.
|
| Custom Widgets | Displays the widgets that make up the dashboard.
|
Table. Custom Dashboard Information
Note
The star icon next to the dashboard name can be clicked to add the dashboard to favorites. Favorited dashboards are displayed at the top of the dashboard list.
Downloading Widgets
Graphic widgets can be downloaded as image files (*.png).
When the mouse cursor is placed over a graph widget, a download button will be displayed in the top-right corner. Clicking the download button will download the widget as an image file.
Sharing Custom Dashboards
Custom dashboards can be shared with other users so they can view the dashboard.
Note
Shared dashboards will remain shared even if the user is later removed from the current Account.
To share a custom dashboard, follow these steps:
- Click Custom Dashboard Management in the top-right menu. The Custom Dashboard Management page will be displayed.
- Select the custom dashboard to share from the My Dashboards list.
- Click the Share button next to the dashboard name.
- Enter the user ID or email address of the user to share the dashboard with and click the Share button.
- Click the Confirm button.
Managing Custom Dashboards
You can modify, copy, or delete custom dashboards.
- Click Manage Custom Dashboards from the top right menu. It moves to the Manage Custom Dashboards page.
- From the My Dashboard list, select the Custom Dashboard you want to check.
- Click the More button on the top right of the dashboard, then select the desired command.
- Edit Dashboard: Modify the dashboard name.
- Copy Dashboard: Copy the dashboard to create a new dashboard.
- Share Dashboard: Share the dashboard with other users.
- Delete Dashboard: Delete the dashboard.
Managing Custom Widgets
You can change the position and size of widgets or modify and copy them.
Changing Widget Position
You can change the position of a widget by clicking on its name and dragging it.
Changing Widget Size
To change the size of a widget, follow these steps:
- Place the mouse cursor over the widget. The Resize button appears at the bottom right of the widget.
- Click the Resize button and drag it to adjust the size as needed.
Modifying, Copying, and Deleting Widgets
To modify, copy, or delete a widget, follow these steps:
- Place the mouse cursor over the widget. The More button appears at the top right of the widget.
- Click the More button, then click the desired command.
- Edit Widget: Modify the widget’s chart settings.
- Copy Widget: Copy the widget to create a new widget with the same content.
- Delete Widget: Delete the widget.
3.2.6 - Managing Agents
An agent is a module that collects performance values, logs, and Windows events from the monitoring target. To use the monitoring function, users must check the installation status of the agent and operate and manage it.
Note
- If IP access control is set for the monitoring target, agent management cannot be used. If agent management is not available, check the IP access control setting status of the selected monitoring target.
- The agent management function uses the sudo command, so the sudo package must be installed in advance.
Agent Management Overview
There are performance collection agents, log collection agents, and Windows event log collection agents.
- Agents must be installed manually by the user on the monitoring target according to their needs.
Managing Agents
Managing Performance Agents
To install and manage agents, follow these steps.
- Click Cloud Monitoring Console > Performance Analysis. Move to the Performance Analysis page.
- On the Performance Analysis page, select the monitoring target and click the Details button. The Monitoring Target Details popup window opens.
- In the Monitoring Target Details popup window, click the Agent tab. Move to the Agent tab.
- Click the Performance button on the Agent tab.
- Click the Copy icon to the right of the installation command to copy the command.
- Paste the copied command into the monitoring target resource.
- Run the copied command on the monitoring target resource.
Note
The command uses the sudo command, so the sudo package must be installed.
| Item | Description |
|---|---|
| Installation | Downloads and runs the script file required for agent installation. |
| Start | Runs the agent start command. |
| Stop | Runs the agent stop command. |
| Delete | Runs the agent delete command. |
| Update | Downloads and runs the script file required for agent update. |
Table. Managing Performance Agents
Note
To check the agent service status, use the following method:
- Linux: $ sudo systemctl status metricbeat
- Windows: Task Manager → service → metricbeat → Status(Running)
Managing Log Agents
To install and manage agents, follow these steps.
- Click Cloud Monitoring Console > Performance Analysis. Move to the Performance Analysis page.
- On the Performance Analysis page, select the monitoring target and click the Details button. The Monitoring Target Details popup window opens.
- In the Monitoring Target Details popup window, click the Agent tab. Move to the Agent tab.
- Click the Log button.
- Click the Copy icon to the right of the installation command to copy the command.
- Paste the copied command into the monitoring target resource.
- Run the copied command on the monitoring target resource.
Note
The command uses the sudo command, so the sudo package must be installed.
| Item | Description |
|---|---|
| Installation | Downloads and runs the script file required for agent installation. |
| Start | Runs the agent start command. |
| Stop | Runs the agent stop command. |
| Delete | Runs the agent delete command. |
| Update | Downloads and runs the script file required for agent update. |
Table. Managing Log Agents
Note
To check the agent service status, use the following method:
- Linux: $ sudo systemctl status filebeat
- Windows: Task Manager → service → filebeat → Status(Running)
To add logs to be monitored, select the log addition action, enter the log name and log path correctly, and click the Generate Command button. Paste the generated command into the monitoring target resource and run it.
Managing Event Agents
To install and manage agents, follow these steps.
- Click Cloud Monitoring Console > Performance Analysis. Move to the Performance Analysis page.
- On the Performance Analysis page, select the monitoring target and click the Details button. The Monitoring Target Details popup window opens.
- In the Monitoring Target Details popup window, click the Agent tab. Move to the Agent tab.
- Click the Event button.
- Click the Copy icon to the right of the installation command to copy the command.
- Paste the copied command into the monitoring target resource.
- Run the copied command on the monitoring target resource.
Note
The event agent is available for Windows instances.
| Item | Description |
|---|---|
| Installation | Downloads and runs the script file required for agent installation. |
| Start | Runs the agent start command. |
| Stop | Runs the agent stop command. |
| Delete | Runs the agent delete command. |
| Update | Downloads and runs the script file required for agent update. |
Table. Managing Event Agents
Note
To check the agent service status, use the following method:
- Windows: Task Manager → service → winlogbeat → Status(Running)
Note
Agent command provision is provided separately from the instance status of Virtual Server (Bare Metal Server).
3.2.7 - Appendix A. Monitoring Targets by Service
Compute type
Virtual Server
| Division | Monitoring Target | Collection Method | Collection Cycle |
|---|---|---|---|
| Performance | OS | Agent Agentless | 1m |
| Log | OS | Agent | Log Occurrence Time |
| Status | OS | Agentless | 1m |
Fig. Virtual Server Monitoring Information
Reference
If the Virtual Server server type is changed, monitoring performance metric data may not be collected normally for a while. Normal performance metrics will be collected in the next collection cycle (1 minute).
GPU Server
| Division | Monitoring Target | Collection Method | Collection Cycle |
|---|---|---|---|
| Performance | OS | Agent Agentless | 1m |
| Log | OS | Agent | Log Occurrence Time |
| Status | OS | Agentless | 1m |
Fig. GPU Server Monitoring Information
Bare Metal Server
| Division | Monitoring Target | Collection Method | Collection Cycle |
|---|---|---|---|
| Performance | OS | Agent | 1m |
| Log | OS | Agent | Log Occurrence Time |
| Status | OS | N/A | - |
Table. Bare Metal Server Monitoring Information
Multi-node GPU Cluster [Cluster Fabric]
| Division | Monitoring Target | Collection Method | Collection Cycle |
|---|---|---|---|
| Performance | OS | Agent | 1m |
| Log | OS | Agent | Log Occurrence Time |
| Status | OS | N/A | - |
Fig. Multi-node GPU Cluster [Cluster Fabric] Monitoring Information
Multi-node GPU Cluster [Node]
| Division | Monitoring Target | Collection Method | Collection Cycle |
|---|---|---|---|
| Performance | OS | Agent | 1m |
| Log | OS | Agent | Log Occurrence Time |
| Status | OS | N/A | - |
Fig. Multi-node GPU Cluster [Node] Monitoring Information
Storage type
All Storage type services have the same monitoring target, collection method, and collection cycle.
- File Storage
- Object Storage
- Block Storage(BM)
- Block Storage(VM)
| Division | Monitoring Target | Collection Method | Collection Cycle |
|---|---|---|---|
| Performance | Storage | Agentless | 1m |
| Log | Storage | N/A | - |
| Status | Storage | Agentless | 1m |
Table. Storage type monitoring information
Database type
The monitoring target and collection method, and collection cycle are the same for all types of Database services.
- PostgreSQL(DBaaS)
- MariaDB(DBaaS)
- MySQL(DBaaS)
- Microsoft SQL Server
- EPAS
- CacheStore(DBaaS)
- Redis
- Valkey
| Category | Monitoring Target | Collection Method | Collection Cycle |
|---|---|---|---|
| Performance | Database Process, OS | Agent | 1m |
| Log | Database Process, OS | Agent | Log Occurrence Time |
| Status | Database Process | Agent | 1m |
| OS | Agentless | 1m |
Table. Database type monitoring information
Data Analytics type
| Category | Monitoring Target | Collection Method | Collection Cycle |
|---|---|---|---|
| Performance | Data Analytics Process, OS | Agent | 1m |
| Log | Data Analytics Process, OS | Agent | When a log occurs |
| Status | Data Analytics Process | Agent | 1m |
| OS | Agentless | 1m |
Fig. Data Analytics type monitoring information
Container type
Kubernetes Engine
| Division | Monitoring Target | Collection Method | Collection Cycle |
|---|---|---|---|
| Performance | Cluster, Namespace, Node, ReplicaSet, Deployment, StatefulSet, DaemonSet, Job, CronJob, Pod | Agentless | 5m |
| Log | Cluster, Namespace, Node, ReplicaSet, Deployment, StatefulSet, DaemonSet, Job, CronJob, Pod | Agentless | When a log occurs |
| Status | Cluster, Namespace, Node, ReplicaSet, Deployment, StatefulSet, DaemonSet, Job, CronJob, Pod | Agentless | 5m |
Fig. Kubernetes Engine monitoring information
Container Registry
| Category | Monitoring Target | Collection Method | Collection Cycle |
|---|---|---|---|
| Performance | Container Registry | Agentless | 5m |
| Log | Container Registry | Agentless | When a log occurs |
| Status | Container Registry | Agentless | 5m |
Fig. Container Registry Monitoring Information
Networking type
VPC
| Category | Monitoring Target | Collection Method | Collection Cycle |
|---|---|---|---|
| Performance | Internet Gateway | Agentless | 5m |
| Log | Internet Gateway | N/A | - |
| Status | Internet Gateway | N/A | - |
Table. Internet Gateway Monitoring Information
Caution
Performance monitoring is only possible when the Internet Gateway is created.
Load Balancer(OLD)
Load Balancer(OLD)
| Category | Monitoring Target | Collection Method | Collection Cycle |
|---|---|---|---|
| Performance | Load Balancer | Agentless | 5m |
| Log | Load Balancer | N/A | - |
| Status | Load Balancer | Agentless | 5m |
Fig. Load Balancer Monitoring Information
Load Balancer Listener(OLD)
| Category | Monitoring Target | Collection Method | Collection Cycle |
|---|---|---|---|
| Performance | Load Balancer Listener | Agentless | 5m |
| Log | Load Balancer Listener | N/A | - |
| Status | Load Balancer Listener | Agentless | 5m |
Fig. Load Balancer Listener Monitoring Information
Load Balancer
Load Balancer
| Division | Monitoring Target | Collection Method | Collection Cycle |
|---|---|---|---|
| Performance | Load Balancer | Agentless | 5m |
| Log | Load Balancer | N/A | - |
| Status | Load Balancer | Agentless | 5m |
Fig. Load Balancer Monitoring Information
Load Balancer Listener
| Category | Monitoring Target | Collection Method | Collection Cycle |
|---|---|---|---|
| Performance | Load Balancer Listener | Agentless | 5m |
| Log | Load Balancer Listener | N/A | - |
| Status | Load Balancer Listener | Agentless | 5m |
Fig. Load Balancer Listener Monitoring Information
Load Balancer Server Group
| Category | Monitoring Target | Collection Method | Collection Cycle |
|---|---|---|---|
| Performance | Load Balancer Server Group | Agentless | 5m |
| Log | Load Balancer Server Group | N/A | - |
| Status | Load Balancer Server Group | Agentless | 5m |
Fig. Load Balancer Server Group Monitoring Information
Direct Connect
| Division | Monitoring Target | Collection Method | Collection Cycle |
|---|---|---|---|
| Performance | Direct Connect | Agentless | 5m |
| Log | Direct Connect | N/A | - |
| Status | Direct Connect | N/A | - |
Fig. Direct Connect Monitoring Information
Cloud WAN
| Division | Monitoring Target | Collection Method | Collection Cycle |
|---|---|---|---|
| Performance | Cloud WAN | Agentless | 10m |
| Log | Cloud WAN | N/A | - |
| Status | Cloud WAN | Agentless | 10m |
Fig. Cloud WAN Monitoring Information
Global CDN
| Category | Monitoring Target | Collection Method | Collection Cycle |
|---|---|---|---|
| Performance | Global CDN | Agentless | 5m |
| Log | Global CDN | N/A | - |
| Status | Global CDN | Agentless | 5m |
Fig. Global CDN Monitoring Information
3.2.8 - Appendix B. Performance Items by Service
Compute Type
Virtual Server
Agentless (Basic Metrics)
| Performance Item Group Name | Performance Item Name | Collection Unit | Collection Cycle | Description |
|---|---|---|---|---|
| Memory | Memory Total [Basic] | bytes | 1m | Available memory in bytes |
| Memory | Memory Used [Basic] | bytes | 1m | Currently used memory in bytes |
| Memory | Memory Swap In [Basic] | bytes | 1m | Swapped memory in bytes |
| Memory | Memory Swap Out [Basic] | bytes | 1m | Swapped memory in bytes |
| Memory | Memory Free [Basic] | bytes | 1m | Unused memory in bytes |
| Disk | Disk Read Bytes [Basic] | bytes | 1m | Read bytes |
| Disk | Disk Read Requests [Basic] | cnt | 1m | Number of read requests |
| Disk | Disk Write Bytes [Basic] | bytes | 1m | Write bytes |
| Disk | Disk Write Requests [Basic] | cnt | 1m | Number of write requests |
| CPU | CPU Usage [Basic] | % | 1m | Average system CPU usage over 1 minute |
| State | Instance State [Basic] | state | 1m | Instance state |
| Network | Network In Bytes [Basic] | bytes | 1m | Received bytes |
| Network | Network In Dropped [Basic] | cnt | 1m | Dropped received packets |
| Network | Network In Packets [Basic] | cnt | 1m | Number of received packets |
| Network | Network Out Bytes [Basic] | bytes | 1m | Sent bytes |
| Network | Network Out Dropped [Basic] | cnt | 1m | Dropped sent packets |
| Network | Network Out Packets [Basic] | cnt | 1m | Number of sent packets |
Table. Virtual Server (Agentless) Performance Items
Note
- For Windows OS, you need to install the Balloon Driver or the monitoring performance agent to provide memory performance indicators.
Agent (Detailed Metrics)
| Performance Item Group Name | Performance Item Name | Collection Unit | Collection Cycle | Description |
|---|---|---|---|---|
| CPU | Core Usage [IO Wait] | % | 1m | CPU time spent in wait state (disk wait) |
| CPU | Core Usage [System] | % | 1m | CPU time spent in kernel space |
| CPU | Core Usage [User] | % | 1m | CPU time spent in user space |
| CPU | CPU Cores | cnt | 1m | Number of CPU cores on the host. The maximum value of the unnormalized ratio is 100%* of the number of cores. The unnormalized ratio already reflects this value, and the maximum value is 100%* of the number of cores. |
| CPU | CPU Usage [Active] | % | 1m | CPU time used, excluding idle and IOWait states (using all 4 cores at 100%: 400%) |
| CPU | CPU Usage [Idle] | % | 1m | CPU time spent in idle state |
| CPU | CPU Usage [IO Wait] | % | 1m | CPU time spent in wait state (disk wait) |
| CPU | CPU Usage [System] | % | 1m | CPU time used by the kernel (using all 4 cores at 100%: 400%) |
| CPU | CPU Usage [User] | % | 1m | CPU time used by the user (using all 4 cores at 100%: 400%) |
| CPU | CPU Usage/Core [Active] | % | 1m | CPU time used, excluding idle and IOWait states (normalized by the number of cores, using all 4 cores at 100%: 100%) |
| CPU | CPU Usage/Core [Idle] | % | 1m | CPU time spent in idle state |
| CPU | CPU Usage/Core [IO Wait] | % | 1m | CPU time spent in wait state (disk wait) |
| CPU | CPU Usage/Core [System] | % | 1m | CPU time used by the kernel (normalized by the number of cores, using all 4 cores at 100%: 100%) |
| CPU | CPU Usage/Core [User] | % | 1m | CPU time used by the user (normalized by the number of cores, using all 4 cores at 100%: 100%) |
| Disk | Disk CPU Usage [IO Request] | % | 1m | CPU time spent executing I/O requests to the device (device bandwidth utilization). If this value is close to 100%, the device is saturated. |
| Disk | Disk Queue Size [Avg] | num | 1m | Average queue length of requests executed on the device |
| Disk | Disk Read Bytes | bytes | 1m | Bytes read from the device per second |
| Disk | Disk Read Bytes [Delta Avg] | bytes | 1m | Average of system.diskio.read.bytes_delta for individual disks |
| Disk | Disk Read Bytes [Delta Max] | bytes | 1m | Maximum of system.diskio.read.bytes_delta for individual disks |
| Disk | Disk Read Bytes [Delta Min] | bytes | 1m | Minimum of system.diskio.read.bytes_delta for individual disks |
| Disk | Disk Read Bytes [Delta Sum] | bytes | 1m | Sum of system.diskio.read.bytes_delta for individual disks |
| Disk | Disk Read Bytes [Delta] | bytes | 1m | Delta of system.diskio.read.bytes for individual disks |
| Disk | Disk Read Bytes [Success] | bytes | 1m | Total bytes read successfully. For Linux, it is assumed that the sector size is 512 and the value is the number of sectors read multiplied by 512 |
| Disk | Disk Read Requests | cnt | 1m | Number of read requests to the disk device per second |
| Disk | Disk Read Requests [Delta Avg] | cnt | 1m | Average of system.diskio.read.count_delta for individual disks |
| Disk | Disk Read Requests [Delta Max] | cnt | 1m | Maximum of system.diskio.read.count_delta for individual disks |
| Disk | Disk Read Requests [Delta Min] | cnt | 1m | Minimum of system.diskio.read.count_delta for individual disks |
| Disk | Disk Read Requests [Delta Sum] | cnt | 1m | Sum of system.diskio.read.count_delta for individual disks |
| Disk | Disk Read Requests [Success Delta] | cnt | 1m | Delta of system.diskio.read.count for individual disks |
| Disk | Disk Read Requests [Success] | cnt | 1m | Total number of successful read completions |
| Disk | Disk Request Size [Avg] | num | 1m | Average size of requests executed on the device (in sectors) |
| Disk | Disk Service Time [Avg] | ms | 1m | Average service time of I/O requests executed on the device (in milliseconds) |
| Disk | Disk Wait Time [Avg] | ms | 1m | Average time spent waiting for I/O requests to be executed on the device |
| Disk | Disk Wait Time [Read] | ms | 1m | Average disk read wait time |
| Disk | Disk Wait Time [Write] | ms | 1m | Average disk write wait time |
| Disk | Disk Write Bytes [Delta Avg] | bytes | 1m | Average of system.diskio.write.bytes_delta for individual disks |
| Disk | Disk Write Bytes [Delta Max] | bytes | 1m | Maximum of system.diskio.write.bytes_delta for individual disks |
| Disk | Disk Write Bytes [Delta Min] | bytes | 1m | Minimum of system.diskio.write.bytes_delta for individual disks |
| Disk | Disk Write Bytes [Delta Sum] | bytes | 1m | Sum of system.diskio.write.bytes_delta for individual disks |
| Disk | Disk Write Bytes [Delta] | bytes | 1m | Delta of system.diskio.write.bytes for individual disks |
| Disk | Disk Write Bytes [Success] | bytes | 1m | Total bytes written successfully. For Linux, it is assumed that the sector size is 512 and the value is the number of sectors written multiplied by 512 |
| Disk | Disk Write Requests | cnt | 1m | Number of write requests to the disk device per second |
| Disk | Disk Write Requests [Delta Avg] | cnt | 1m | Average of system.diskio.write.count_delta for individual disks |
| Disk | Disk Write Requests [Delta Max] | cnt | 1m | Maximum of system.diskio.write.count_delta for individual disks |
| Disk | Disk Write Requests [Delta Min] | cnt | 1m | Minimum of system.diskio.write.count_delta for individual disks |
| Disk | Disk Write Requests [Delta Sum] | cnt | 1m | Sum of system.diskio.write.count_delta for individual disks |
| Disk | Disk Write Requests [Success Delta] | cnt | 1m | Delta of system.diskio.write.count for individual disks |
| Disk | Disk Write Requests [Success] | cnt | 1m | Total number of successful writes |
| Disk | Disk Writes Bytes | bytes | 1m | Bytes written to the device per second |
| FileSystem | Filesystem Hang Check | state | 1m | Filesystem (local/NFS) hang check (normal: 1, abnormal: 0) |
| FileSystem | Filesystem Nodes | cnt | 1m | Total number of file nodes in the filesystem |
| FileSystem | Filesystem Nodes [Free] | cnt | 1m | Total number of available file nodes in the filesystem |
| FileSystem | Filesystem Size [Available] | bytes | 1m | Disk space available for non-privileged users (in bytes) |
| FileSystem | Filesystem Size [Free] | bytes | 1m | Available disk space (in bytes) |
| FileSystem | Filesystem Size [Total] | bytes | 1m | Total disk space (in bytes) |
| FileSystem | Filesystem Usage | % | 1m | Percentage of used disk space |
| FileSystem | Filesystem Usage [Avg] | % | 1m | Average of filesystem.used.pct for individual filesystems |
| FileSystem | Filesystem Usage [Inode] | % | 1m | Inode usage rate |
| FileSystem | Filesystem Usage [Max] | % | 1m | Maximum of filesystem.used.pct for individual filesystems |
| FileSystem | Filesystem Usage [Min] | % | 1m | Minimum of filesystem.used.pct for individual filesystems |
| FileSystem | Filesystem Usage [Total] | % | 1m | - |
| FileSystem | Filesystem Used | bytes | 1m | Used disk space (in bytes) |
| FileSystem | Filesystem Used [Inode] | bytes | 1m | Inode usage |
| Memory | Memory Free | bytes | 1m | Total available memory (in bytes), excluding system cache and buffer memory (see system.memory.actual.free). |
| Memory | Memory Free [Actual] | bytes | 1m | Actual available memory (in bytes). The calculation method varies depending on the OS. For Linux, it is the value of MemAvailable in /proc/meminfo, or the calculated value using available memory and cache/buffer memory if /proc/meminfo is not available. For OSX, it is the sum of available memory and inactive memory. For Windows, it is the same value as system.memory.free. |
| Memory | Memory Free [Swap] | bytes | 1m | Available swap memory |
| Memory | Memory Total | bytes | 1m | Total memory |
| Memory | Memory Total [Swap] | bytes | 1m | Total swap memory |
| Memory | Memory Usage | % | 1m | Percentage of used memory |
| Memory | Memory Usage [Actual] | % | 1m | Percentage of actually used memory |
| Memory | Memory Usage [Cache Swap] | % | 1m | Cache swap usage rate |
| Memory | Memory Usage [Swap] | % | 1m | Percentage of used swap memory |
| Memory | Memory Used | bytes | 1m | Used memory |
| Memory | Memory Used [Actual] | bytes | 1m | Actually used memory (in bytes). The value of total memory minus used memory. The available memory is calculated differently depending on the OS (see system.actual.free). |
| Memory | Memory Used [Swap] | bytes | 1m | Used swap memory |
| Network | Collisions | cnt | 1m | Network collisions |
| Network | Network In Bytes | bytes | 1m | Received bytes |
| Network | Network In Bytes [Delta Avg] | bytes | 1m | Average of system.network.in.bytes_delta for individual networks |
| Network | Network In Bytes [Delta Max] | bytes | 1m | Maximum of system.network.in.bytes_delta for individual networks |
| Network | Network In Bytes [Delta Min] | bytes | 1m | Minimum of system.network.in.bytes_delta for individual networks |
| Network | Network In Bytes [Delta Sum] | bytes | 1m | Sum of system.network.in.bytes_delta for individual networks |
| Network | Network In Bytes [Delta] | bytes | 1m | Delta of received bytes |
| Network | Network In Dropped | cnt | 1m | Dropped received packets |
| Network | Network In Errors | cnt | 1m | Number of receive errors |
| Network | Network In Packets | cnt | 1m | Number of received packets |
| Network | Network In Packets [Delta Avg] | cnt | 1m | Average of system.network.in.packets_delta for individual networks |
| Network | Network In Packets [Delta Max] | cnt | 1m | Maximum of system.network.in.packets_delta for individual networks |
| Network | Network In Packets [Delta Min] | cnt | 1m | Minimum of system.network.in.packets_delta for individual networks |
| Network | Network In Packets [Delta Sum] | cnt | 1m | Sum of system.network.in.packets_delta for individual networks |
| Network | Network In Packets [Delta] | cnt | 1m | Delta of received packets |
| Network | Network Out Bytes | bytes | 1m | Sent bytes |
| Network | Network Out Bytes [Delta Avg] | bytes | 1m | Average of system.network.out.bytes_delta for individual networks |
| Network | Network Out Bytes [Delta Max] | bytes | 1m | Maximum of system.network.out.bytes_delta for individual networks |
| Network | Network Out Bytes [Delta Min] | bytes | 1m | Minimum of system.network.out.bytes_delta for individual networks |
| Network | Network Out Bytes [Delta Sum] | bytes | 1m | Sum of system.network.out.bytes_delta for individual networks |
| Network | Network Out Bytes [Delta] | bytes | 1m | Delta of sent bytes |
| Network | Network Out Dropped | cnt | 1m | Dropped sent packets. This value is not reported by the OS, so it is always 0 on Darwin and BSD. |
| Network | Network Out Errors | cnt | 1m | Number of transmit errors |
| Network | Network Out Packets | cnt | 1m | Number of sent packets |
| Network | Network Out Packets [Delta Avg] | cnt | 1m | Average of system.network.out.packets_delta for individual networks |
| Network | Network Out Packets [Delta Max] | cnt | 1m | Maximum of system.network.out.packets_delta for individual networks |
| Network | Network Out Packets [Delta Min] | cnt | 1m | Minimum of system.network.out.packets_delta for individual networks |
| Network | Network Out Packets [Delta Sum] | cnt | 1m | Sum of system.network.out.packets_delta for individual networks |
| Network | Network Out Packets [Delta] | cnt | 1m | Delta of sent packets |
| Network | Open Connections [TCP] | cnt | 1m | Number of open TCP connections |
| Network | Open Connections [UDP] | cnt | 1m | Number of open UDP connections |
| Network | Port Usage | % | 1m | Port usage rate |
| Network | SYN Sent Sockets | cnt | 1m | Number of sockets in the SYN_SENT state (when connecting to a remote host) |
| Process | Kernel PID Max | cnt | 1m | Value of kernel.pid_max |
| Process | Kernel Thread Max | cnt | 1m | Value of kernel.threads-max |
| Process | Process CPU Usage | % | 1m | Percentage of CPU time consumed by the process since the last update. This value is similar to the %CPU value displayed by the top command on Unix systems. |
| Process | Process CPU Usage/Core | % | 1m | Percentage of CPU time used by the process since the last event. This value is normalized by the number of cores and ranges from 0 to 100%. |
| Process | Process Memory Usage | % | 1m | Percentage of main memory (RAM) used by the process |
| Process | Process Memory Used | bytes | 1m | Resident Set size. The amount of memory used by the process in RAM. On Windows, this is the current working set size. |
| Process | Process PID | PID | 1m | Process PID |
| Process | Process PPID | PID | 1m | Parent process PID |
| Process | Processes [Dead] | cnt | 1m | Number of dead processes |
| Process | Processes [Idle] | cnt | 1m | Number of idle processes |
| Process | Processes [Running] | cnt | 1m | Number of running processes |
| Process | Processes [Sleeping] | cnt | 1m | Number of sleeping processes |
| Process | Processes [Stopped] | cnt | 1m | Number of stopped processes |
| Process | Processes [Total] | cnt | 1m | Total number of processes |
| Process | Processes [Unknown] | cnt | 1m | Number of processes with unknown or unsearchable status |
| Process | Processes [Zombie] | cnt | 1m | Number of zombie processes |
| Process | Running Process Usage | % | 1m | Process usage rate |
| Process | Running Processes | cnt | 1m | Number of running processes |
| Process | Running Thread Usage | % | 1m | Thread usage rate |
| Process | Running Threads | cnt | 1m | Total number of threads running in running processes |
| System | Context Switches | cnt | 1m | Number of context switches (per second) |
| System | Load/Core [1 min] | cnt | 1m | Load over the last 1 minute, normalized by the number of cores |
| System | Load/Core [15 min] | cnt | 1m | Load over the last 15 minutes, normalized by the number of cores |
| System | Load/Core [5 min] | cnt | 1m | Load over the last 5 minutes, normalized by the number of cores |
| System | Multipaths [Active] | cnt | 1m | Number of active paths for external storage connections |
| System | Multipaths [Failed] | cnt | 1m | Number of failed paths for external storage connections |
| System | Multipaths [Faulty] | cnt | 1m | Number of faulty paths for external storage connections |
| System | NTP Offset | num | 1m | Measured offset (time difference between the NTP server and the local environment) of the last sample |
| System | Run Queue Length | num | 1m | Length of the run queue |
| System | Uptime | ms | 1m | System uptime (in milliseconds) |
| Windows | Context Switchies | cnt | 1m | Number of CPU context switches (per second) |
| Windows | Disk Read Bytes [Sec] | cnt | 1m | Number of bytes read from the Windows logical disk per second |
| Windows | Disk Read Time [Avg] | sec | 1m | Average time spent reading data (in seconds) |
| Windows | Disk Transfer Time [Avg] | sec | 1m | Average disk wait time |
| Windows | Disk Usage | % | 1m | Disk usage rate |
| Windows | Disk Write Bytes [Sec] | cnt | 1m | Number of bytes written to the Windows logical disk per second |
| Windows | Disk Write Time [Avg] | sec | 1m | Average time spent writing data (in seconds) |
| Windows | Pagingfile Usage | % | 1m | Paging file usage rate |
| Windows | Pool Used [Non Paged] | bytes | 1m | Non-paged pool usage of kernel memory |
| Windows | Pool Used [Paged] | bytes | 1m | Paged pool usage of kernel memory |
| Windows | Process [Running] | cnt | 1m | Number of currently running processes |
| Windows | Threads [Running] | cnt | 1m | Number of currently running threads |
| Windows | Threads [Waiting] | cnt | 1m | Number of threads waiting for processor time |
Table. Virtual Server (Agent) Performance Items
GPU Server
Agentless (Basic Metrics)
| Performance Item Group Name | Performance Item Name | Collection Unit | Collection Cycle | Description |
|---|---|---|---|---|
| Memory | Memory Total [Basic] | bytes | 1m | Available memory in bytes |
| Memory | Memory Used [Basic] | bytes | 1m | Currently used memory in bytes |
| Memory | Memory Swap In [Basic] | bytes | 1m | Swapped memory in bytes |
| Memory | Memory Swap Out [Basic] | bytes | 1m | Swapped memory in bytes |
| Memory | Memory Free [Basic] | bytes | 1m | Unused memory in bytes |
| Disk | Disk Read Bytes [Basic] | bytes | 1m | Read bytes |
| Disk | Disk Read Requests [Basic] | cnt | 1m | Number of read requests |
| Disk | Disk Write Bytes [Basic] | bytes | 1m | Write bytes |
| Disk | Disk Write Requests [Basic] | cnt | 1m | Number of write requests |
| CPU | CPU Usage [Basic] | % | 1m | Average system CPU usage over 1 minute |
| State | Instance State [Basic] | state | 1m | Instance state |
| Network | Network In Bytes [Basic] | bytes | 1m | Received bytes |
| Network | Network In Dropped [Basic] | cnt | 1m | Dropped received packets |
| Network | Network In Packets [Basic] | cnt | 1m | Number of received packets |
| Network | Network Out Bytes [Basic] | bytes | 1m | Sent bytes |
| Network | Network Out Dropped [Basic] | cnt | 1m | Dropped sent packets |
| Network | Network Out Packets [Basic] | cnt | 1m | Number of sent packets |
Table. GPU Server (Agentless) Performance Items
Agent (Detailed Metrics)
| Performance Item Group Name | Performance Item Name | Collection Unit | Collection Cycle | Description |
|---|---|---|---|---|
| GPU | GPU Count | cnt | 1m | Number of GPUs |
| GPU | GPU Memory Usage | % | 1m | GPU memory usage rate |
| GPU | GPU Memory Used | bytes | 1m | GPU memory usage |
| GPU | GPU Temperature | ℃ | 1m | GPU temperature |
| GPU | GPU Usage | % | 1m | Total GPU usage rate (using all 8 GPUs at 100%: 800%) |
| GPU | GPU Usage [Avg] | % | 1m | Average GPU usage rate (%) |
| GPU | GPU Power Cap | W | 1m | Maximum power capacity of the GPU |
| GPU | GPU Power Usage | W | 1m | Current power usage of the GPU |
| GPU | GPU Memory Usage [Avg] | % | 1m | Average GPU memory usage rate |
| GPU | GPU Count in use | cnt | 1m | Number of GPUs in use by jobs running on the node |
| GPU | Execution State for nvidia-smi | state | 1m | Execution result of the nvidia-smi command |
| CPU | Core Usage [IO Wait] | % | 1m | CPU time spent in wait state (disk wait) |
| CPU | Core Usage [System] | % | 1m | CPU time spent in kernel space |
| CPU | Core Usage [User] | % | 1m | CPU time spent in user space |
| CPU | CPU Cores | cnt | 1m | Number of CPU cores on the host. The maximum value of the unnormalized ratio is 100%* of the number of cores. The unnormalized ratio already reflects this value, and the maximum value is 100%* of the number of cores. |
| CPU | CPU Usage [Active] | % | 1m | CPU time used, excluding idle and IOWait states (using all 4 cores at 100%: 400%) |
| CPU | CPU Usage [Idle] | % | 1m | CPU time spent in idle state |
| CPU | CPU Usage [IO Wait] | % | 1m | CPU time spent in wait state (disk wait) |
| CPU | CPU Usage [System] | % | 1m | CPU time used by the kernel (using all 4 cores at 100%: 400%) |
| CPU | CPU Usage [User] | % | 1m | CPU time used by the user (using all 4 cores at 100%: 400%) |
| CPU | CPU Usage/Core [Active] | % | 1m | CPU time used, excluding idle and IOWait states (normalized by the number of cores, using all 4 cores at 100%: 100%) |
| CPU | CPU Usage/Core [Idle] | % | 1m | CPU time spent in idle state |
| CPU | CPU Usage/Core [IO Wait] | % | 1m | CPU time spent in wait state (disk wait) |
| CPU | CPU Usage/Core [System] | % | 1m | CPU time used by the kernel (normalized by the number of cores, using all 4 cores at 100%: 100%) |
| CPU | CPU Usage/Core [User] | % | 1m | CPU time used by the user (normalized by the number of cores, using all 4 cores at 100%: 100%) |
| Disk | Disk CPU Usage [IO Request] | % | 1m | The ratio of CPU time spent executing I/O requests for the device (device bandwidth utilization). If this value is close to 100%, the device is in a saturated state. |
| Disk | Disk Queue Size [Avg] | num | 1m | The average queue length of requests executed for the device. |
| Disk | Disk Read Bytes | bytes | 1m | The number of bytes read from the device per second. |
| Disk | Disk Read Bytes [Delta Avg] | bytes | 1m | The average of system.diskio.read.bytes_delta for individual disks. |
| Disk | Disk Read Bytes [Delta Max] | bytes | 1m | The maximum of system.diskio.read.bytes_delta for individual disks. |
| Disk | Disk Read Bytes [Delta Min] | bytes | 1m | The minimum of system.diskio.read.bytes_delta for individual disks. |
| Disk | Disk Read Bytes [Delta Sum] | bytes | 1m | The sum of system.diskio.read.bytes_delta for individual disks. |
| Disk | Disk Read Bytes [Delta] | bytes | 1m | The delta value of system.diskio.read.bytes for individual disks. |
| Disk | Disk Read Bytes [Success] | bytes | 1m | The total number of bytes read successfully. On Linux, it is assumed that the sector size is 512 and the value is calculated by multiplying the number of sectors read by 512. |
| Disk | Disk Read Requests | cnt | 1m | The number of read requests for the disk device per second. |
| Disk | Disk Read Requests [Delta Avg] | cnt | 1m | The average of system.diskio.read.count_delta for individual disks. |
| Disk | Disk Read Requests [Delta Max] | cnt | 1m | The maximum of system.diskio.read.count_delta for individual disks. |
| Disk | Disk Read Requests [Delta Min] | cnt | 1m | The minimum of system.diskio.read.count_delta for individual disks. |
| Disk | Disk Read Requests [Delta Sum] | cnt | 1m | The sum of system.diskio.read.count_delta for individual disks. |
| Disk | Disk Read Requests [Success Delta] | cnt | 1m | The delta value of system.diskio.read.count for individual disks. |
| Disk | Disk Read Requests [Success] | cnt | 1m | The total number of successful read requests. |
| Disk | Disk Request Size [Avg] | num | 1m | The average size of requests executed for the device (in sectors). |
| Disk | Disk Service Time [Avg] | ms | 1m | The average service time for input requests executed for the device (in milliseconds). |
| Disk | Disk Wait Time [Avg] | ms | 1m | The average time spent executing requests for the device. |
| Disk | Disk Wait Time [Read] | ms | 1m | The average disk wait time for read operations. |
| Disk | Disk Wait Time [Write] | ms | 1m | The average disk wait time for write operations. |
| Disk | Disk Write Bytes [Delta Avg] | bytes | 1m | The average of system.diskio.write.bytes_delta for individual disks. |
| Disk | Disk Write Bytes [Delta Max] | bytes | 1m | The maximum of system.diskio.write.bytes_delta for individual disks. |
| Disk | Disk Write Bytes [Delta Min] | bytes | 1m | The minimum of system.diskio.write.bytes_delta for individual disks. |
| Disk | Disk Write Bytes [Delta Sum] | bytes | 1m | The sum of system.diskio.write.bytes_delta for individual disks. |
| Disk | Disk Write Bytes [Delta] | bytes | 1m | The delta value of system.diskio.write.bytes for individual disks. |
| Disk | Disk Write Bytes [Success] | bytes | 1m | The total number of bytes written successfully. On Linux, it is assumed that the sector size is 512 and the value is calculated by multiplying the number of sectors written by 512. |
| Disk | Disk Write Requests | cnt | 1m | The number of write requests for the disk device per second. |
| Disk | Disk Write Requests [Delta Avg] | cnt | 1m | The average of system.diskio.write.count_delta for individual disks. |
| Disk | Disk Write Requests [Delta Max] | cnt | 1m | The maximum of system.diskio.write.count_delta for individual disks. |
| Disk | Disk Write Requests [Delta Min] | cnt | 1m | The minimum of system.diskio.write.count_delta for individual disks. |
| Disk | Disk Write Requests [Delta Sum] | cnt | 1m | The sum of system.diskio.write.count_delta for individual disks. |
| Disk | Disk Write Requests [Success Delta] | cnt | 1m | The delta value of system.diskio.write.count for individual disks. |
| Disk | Disk Write Requests [Success] | cnt | 1m | The total number of successful write requests. |
| Disk | Disk Writes Bytes | bytes | 1m | The number of bytes written to the device per second. |
| FileSystem | Filesystem Hang Check | state | 1m | Filesystem (local/NFS) hang check (normal: 1, abnormal: 0). |
| FileSystem | Filesystem Nodes | cnt | 1m | The total number of file nodes in the file system. |
| FileSystem | Filesystem Nodes [Free] | cnt | 1m | The total number of available file nodes in the file system. |
| FileSystem | Filesystem Size [Available] | bytes | 1m | The available disk space (in bytes) that can be used by non-privileged users. |
| FileSystem | Filesystem Size [Free] | bytes | 1m | The available disk space (in bytes). |
| FileSystem | Filesystem Size [Total] | bytes | 1m | The total disk space (in bytes). |
| FileSystem | Filesystem Usage | % | 1m | The percentage of used disk space. |
| FileSystem | Filesystem Usage [Avg] | % | 1m | The average of filesystem.used.pct for individual file systems. |
| FileSystem | Filesystem Usage [Inode] | % | 1m | The inode usage rate. |
| FileSystem | Filesystem Usage [Max] | % | 1m | The maximum of filesystem.used.pct for individual file systems. |
| FileSystem | Filesystem Usage [Min] | % | 1m | The minimum of filesystem.used.pct for individual file systems. |
| FileSystem | Filesystem Usage [Total] | % | 1m | - |
| FileSystem | Filesystem Used | bytes | 1m | The used disk space (in bytes). |
| FileSystem | Filesystem Used [Inode] | bytes | 1m | The inode usage. |
| Memory | Memory Free | bytes | 1m | The total available memory (in bytes), excluding memory used by system cache and buffers (see system.memory.actual.free). |
| Memory | Memory Free [Actual] | bytes | 1m | The actual available memory (in bytes), which varies depending on the OS. On Linux, it is calculated using /proc/meminfo, and on OSX, it is the sum of available and inactive memory. On Windows, it is the same as system.memory.free. |
| Memory | Memory Free [Swap] | bytes | 1m | The available swap memory. |
| Memory | Memory Total | bytes | 1m | The total memory. |
| Memory | Memory Total [Swap] | bytes | 1m | The total swap memory. |
| Memory | Memory Usage | % | 1m | The percentage of used memory. |
| Memory | Memory Usage [Actual] | % | 1m | The percentage of actual used memory. |
| Memory | Memory Usage [Cache Swap] | % | 1m | The cache swap usage rate. |
| Memory | Memory Usage [Swap] | % | 1m | The percentage of used swap memory. |
| Memory | Memory Used | bytes | 1m | The used memory. |
| Memory | Memory Used [Actual] | bytes | 1m | The actual used memory (in bytes), which is the total memory minus the used memory. The available memory varies depending on the OS (see system.actual.free). |
| Memory | Memory Used [Swap] | bytes | 1m | The used swap memory. |
| Network | Collisions | cnt | 1m | Network collisions. |
| Network | Network In Bytes | bytes | 1m | The number of bytes received. |
| Network | Network In Bytes [Delta Avg] | bytes | 1m | The average of system.network.in.bytes_delta for individual networks. |
| Network | Network In Bytes [Delta Max] | bytes | 1m | The maximum of system.network.in.bytes_delta for individual networks. |
| Network | Network In Bytes [Delta Min] | bytes | 1m | The minimum of system.network.in.bytes_delta for individual networks. |
| Network | Network In Bytes [Delta Sum] | bytes | 1m | The sum of system.network.in.bytes_delta for individual networks. |
| Network | Network In Bytes [Delta] | bytes | 1m | The delta value of the number of bytes received. |
| Network | Network In Dropped | cnt | 1m | The number of packets dropped during reception. |
| Network | Network In Errors | cnt | 1m | The number of errors during reception. |
| Network | Network In Packets | cnt | 1m | The number of packets received. |
| Network | Network In Packets [Delta Avg] | cnt | 1m | The average of system.network.in.packets_delta for individual networks. |
| Network | Network In Packets [Delta Max] | cnt | 1m | The maximum of system.network.in.packets_delta for individual networks. |
| Network | Network In Packets [Delta Min] | cnt | 1m | The minimum of system.network.in.packets_delta for individual networks. |
| Network | Network In Packets [Delta Sum] | cnt | 1m | The sum of system.network.in.packets_delta for individual networks. |
| Network | Network In Packets [Delta] | cnt | 1m | The delta value of the number of packets received. |
| Network | Network Out Bytes | bytes | 1m | The number of bytes sent. |
| Network | Network Out Bytes [Delta Avg] | bytes | 1m | The average of system.network.out.bytes_delta for individual networks. |
| Network | Network Out Bytes [Delta Max] | bytes | 1m | The maximum of system.network.out.bytes_delta for individual networks. |
| Network | Network Out Bytes [Delta Min] | bytes | 1m | The minimum of system.network.out.bytes_delta for individual networks. |
| Network | Network Out Bytes [Delta Sum] | bytes | 1m | The sum of system.network.out.bytes_delta for individual networks. |
| Network | Network Out Bytes [Delta] | bytes | 1m | The delta value of the number of bytes sent. |
| Network | Network Out Dropped | cnt | 1m | The number of packets dropped during transmission. This value is not reported by the OS and is always 0 on Darwin and BSD. |
| Network | Network Out Errors | cnt | 1m | The number of errors during transmission. |
| Network | Network Out Packets | cnt | 1m | The number of packets sent. |
| Network | Network Out Packets [Delta Avg] | cnt | 1m | The average of system.network.out.packets_delta for individual networks. |
| Network | Network Out Packets [Delta Max] | cnt | 1m | The maximum of system.network.out.packets_delta for individual networks. |
| Network | Network Out Packets [Delta Min] | cnt | 1m | The minimum of system.network.out.packets_delta for individual networks. |
| Network | Network Out Packets [Delta Sum] | cnt | 1m | The sum of system.network.out.packets_delta for individual networks. |
| Network | Network Out Packets [Delta] | cnt | 1m | The delta value of the number of packets sent. |
| Network | Open Connections [TCP] | cnt | 1m | The number of open TCP connections. |
| Network | Open Connections [UDP] | cnt | 1m | The number of open UDP connections. |
| Network | Port Usage | % | 1m | The port usage rate. |
| Network | SYN Sent Sockets | cnt | 1m | The number of sockets in the SYN_SENT state (when connecting to a remote host). |
| Process | Kernel PID Max | cnt | 1m | The kernel.pid_max value. |
| Process | Kernel Thread Max | cnt | 1m | The kernel.threads-max value. |
| Process | Process CPU Usage | % | 1m | The percentage of CPU time consumed by the process since the last update. This value is similar to the %CPU value displayed by the top command on Unix systems. |
| Process | Process CPU Usage/Core | % | 1m | The percentage of CPU time used by the process since the last event, normalized by the number of cores (0-100%). |
| Process | Process Memory Usage | % | 1m | The percentage of main memory (RAM) used by the process. |
| Process | Process Memory Used | bytes | 1m | The resident set size, which is the amount of memory used by the process in RAM. On Windows, it is the current working set size. |
| Process | Process PID | PID | 1m | The process ID. |
| Process | Process PPID | PID | 1m | The parent process ID. |
| Process | Processes [Dead] | cnt | 1m | The number of dead processes. |
| Process | Processes [Idle] | cnt | 1m | The number of idle processes. |
| Process | Processes [Running] | cnt | 1m | The number of running processes. |
| Process | Processes [Sleeping] | cnt | 1m | The number of sleeping processes. |
| Process | Processes [Stopped] | cnt | 1m | The number of stopped processes. |
| Process | Processes [Total] | cnt | 1m | The total number of processes. |
| Process | Processes [Unknown] | cnt | 1m | The number of processes with unknown or unsearchable states. |
| Process | Processes [Zombie] | cnt | 1m | The number of zombie processes. |
| Process | Running Process Usage | % | 1m | The process usage rate. |
| Process | Running Processes | cnt | 1m | The number of running processes. |
| Process | Running Thread Usage | % | 1m | The thread usage rate. |
| Process | Running Threads | cnt | 1m | The total number of threads running in running processes. |
| System | Context Switches | cnt | 1m | The number of context switches per second. |
| System | Load/Core [1 min] | cnt | 1m | The load average over the last 1 minute, normalized by the number of cores. |
| System | Load/Core [15 min] | cnt | 1m | The load average over the last 15 minutes, normalized by the number of cores. |
| System | Load/Core [5 min] | cnt | 1m | The load average over the last 5 minutes, normalized by the number of cores. |
| System | Multipaths [Active] | cnt | 1m | The number of active paths for external storage connections. |
| System | Multipaths [Failed] | cnt | 1m | The number of failed paths for external storage connections. |
| System | Multipaths [Faulty] | cnt | 1m | The number of faulty paths for external storage connections. |
| System | NTP Offset | num | 1m | The measured offset (time difference between the NTP server and the local environment) of the last sample. |
| System | Run Queue Length | num | 1m | The length of the run queue. |
| System | Uptime | ms | 1m | The OS uptime (in milliseconds). |
| Windows | Context Switchies | cnt | 1m | The number of CPU context switches per second. |
| Windows | Disk Read Bytes [Sec] | cnt | 1m | The number of bytes read from the Windows logical disk per second. |
| Windows | Disk Read Time [Avg] | sec | 1m | The average time spent reading data (in seconds). |
| Windows | Disk Transfer Time [Avg] | sec | 1m | The average disk wait time. |
| Windows | Disk Usage | % | 1m | The disk usage rate. |
| Windows | Disk Write Bytes [Sec] | cnt | 1m | The number of bytes written to the Windows logical disk per second. |
| Windows | Disk Write Time [Avg] | sec | 1m | The average time spent writing data (in seconds). |
| Windows | Pagingfile Usage | % | 1m | The paging file usage rate. |
| Windows | Pool Used [Non Paged] | bytes | 1m | The Nonpaged Pool usage of kernel memory. |
| Windows | Pool Used [Paged] | bytes | 1m | The Paged Pool usage of kernel memory. |
| Windows | Process [Running] | cnt | 1m | The number of currently running processes. |
| Windows | Threads [Running] | cnt | 1m | The number of currently running threads. |
| Windows | Threads [Waiting] | cnt | 1m | The number of threads waiting for processor time. |
Table. Performance Items for GPU Server (Agent)
Bare Metal Server
Agent (Detailed Metrics)
| Performance Item Group Name | Performance Item Name | Collection Unit | Collection Cycle | Description |
|---|---|---|---|---|
| CPU | Core Usage [IO Wait] | % | 1m | The ratio of CPU time spent in a waiting state (disk wait). |
| CPU | Core Usage [System] | % | 1m | The percentage of CPU time used by the kernel. |
| CPU | Core Usage [User] | % | 1m | The percentage of CPU time used in the user space. |
| CPU | CPU Cores | cnt | 1m | The number of CPU cores on the host. The maximum value for unnormalized rates is 100% * the number of cores. The maximum value for normalized rates is 100%. |
| CPU | CPU Usage [Active] | % | 1m | The percentage of CPU time used, excluding idle and IOWait states (all 4 cores using 100%: 400%). |
| CPU | CPU Usage [Idle] | % | 1m | The ratio of CPU time spent in an idle state. |
| CPU | CPU Usage [IO Wait] | % | 1m | The ratio of CPU time spent in a waiting state (disk wait). |
| CPU | CPU Usage [System] | % | 1m | The percentage of CPU time used by the kernel (all 4 cores using 100%: 400%). |
| CPU | CPU Usage [User] | % | 1m | The percentage of CPU time used in the user area (all 4 cores using 100%: 400%). |
| CPU | CPU Usage/Core [Active] | % | 1m | The percentage of CPU time used, excluding idle and IOWait states (normalized by the number of cores, all 4 cores using 100%: 100%). |
| CPU | CPU Usage/Core [Idle] | % | 1m | The ratio of CPU time spent in an idle state. |
| CPU | CPU Usage/Core [IO Wait] | % | 1m | The ratio of CPU time spent in a waiting state (disk wait). |
| CPU | CPU Usage/Core [System] | % | 1m | The percentage of CPU time used by the kernel (normalized by the number of cores, all 4 cores using 100%: 100%). |
| CPU | CPU Usage/Core [User] | % | 1m | The percentage of CPU time used in the user area (normalized by the number of cores, all 4 cores using 100%: 100%). |
| Disk | Disk CPU Usage [IO Request] | % | 1m | The ratio of CPU time spent executing I/O requests for the device (device bandwidth utilization). If this value is close to 100%, the device is in a saturated state. |
| Disk | Disk Queue Size [Avg] | num | 1m | The average queue length of requests executed for the device. |
| Disk | Disk Read Bytes | bytes | 1m | The number of bytes read from the device per second. |
| Disk | Disk Read Bytes [Delta Avg] | bytes | 1m | The average of system.diskio.read.bytes_delta for individual disks. |
| Disk | Disk Read Bytes [Delta Max] | bytes | 1m | The maximum of system.diskio.read.bytes_delta for individual disks. |
| Disk | Disk Read Bytes [Delta Min] | bytes | 1m | The minimum of system.diskio.read.bytes_delta for individual disks. |
| Disk | Disk Read Bytes [Delta Sum] | bytes | 1m | The sum of system.diskio.read.bytes_delta for individual disks. |
| Disk | Disk Read Bytes [Delta] | bytes | 1m | The delta value of system.diskio.read.bytes for individual disks. |
| Disk | Disk Read Bytes [Success] | bytes | 1m | The total number of bytes read successfully. On Linux, it is assumed that the sector size is 512 and the value is calculated by multiplying the number of sectors read by 512. |
| Disk | Disk Read Requests | cnt | 1m | The number of read requests for the disk device per second. |
| Disk | Disk Read Requests [Delta Avg] | cnt | 1m | The average of system.diskio.read.count_delta for individual disks. |
| Disk | Disk Read Requests [Delta Max] | cnt | 1m | The maximum of system.diskio.read.count_delta for individual disks. |
| Disk | Disk Read Requests [Delta Min] | cnt | 1m | The minimum of system.diskio.read.count_delta for individual disks. |
| Disk | Disk Read Requests [Delta Sum] | cnt | 1m | The sum of system.diskio.read.count_delta for individual disks. |
| Disk | Disk Read Requests [Success Delta] | cnt | 1m | The delta value of system.diskio.read.count for individual disks. |
| Disk | Disk Read Requests [Success] | cnt | 1m | The total number of successful read requests. |
| Disk | Disk Request Size [Avg] | num | 1m | The average size of requests executed for the device (in sectors). |
| Disk | Disk Service Time [Avg] | ms | 1m | The average service time for input requests executed for the device (in milliseconds). |
| Disk | Disk Wait Time [Avg] | ms | 1m | The average time spent executing requests for the device. |
| Disk | Disk Wait Time [Read] | ms | 1m | The average disk wait time for read operations. |
| Disk | Disk Wait Time [Write] | ms | 1m | The average disk wait time for write operations. |
| Disk | Disk Write Bytes [Delta Avg] | bytes | 1m | The average of system.diskio.write.bytes_delta for individual disks. |
| Disk | Disk Write Bytes [Delta Max] | bytes | 1m | The maximum of system.diskio.write.bytes_delta for individual disks. |
| Disk | Disk Write Bytes [Delta Min] | bytes | 1m | The minimum of system.diskio.write.bytes_delta for individual disks. |
| Disk | Disk Write Bytes [Delta Sum] | bytes | 1m | The sum of system.diskio.write.bytes_delta for individual disks. |
| Disk | Disk Write Bytes [Delta] | bytes | 1m | The delta value of system.diskio.write.bytes for individual disks. |
| Disk | Disk Write Bytes [Success] | bytes | 1m | The total number of bytes written successfully. On Linux, it is assumed that the sector size is 512 and the value is calculated by multiplying the number of sectors written by 512. |
| Disk | Disk Write Requests | cnt | 1m | The number of write requests for the disk device per second. |
| Disk | Disk Write Requests [Delta Avg] | cnt | 1m | The average of system.diskio.write.count_delta for individual disks. |
| Disk | Disk Write Requests [Delta Max] | cnt | 1m | The maximum of system.diskio.write.count_delta for individual disks. |
| Disk | Disk Write Requests [Delta Min] | cnt | 1m | The minimum of system.diskio.write.count_delta for individual disks. |
| Disk | Disk Write Requests [Delta Sum] | cnt | 1m | The sum of system.diskio.write.count_delta for individual disks. |
| Disk | Disk Write Requests [Success Delta] | cnt | 1m | The delta value of system.diskio.write.count for individual disks. |
| Disk | Disk Write Requests [Success] | cnt | 1m | The total number of successful write requests. |
| Disk | Disk Writes Bytes | bytes | 1m | The number of bytes written to the device per second. |
| FileSystem | Filesystem Hang Check | state | 1m | Filesystem (local/NFS) hang check (normal: 1, abnormal: 0). |
| FileSystem | Filesystem Nodes | cnt | 1m | The total number of file nodes in the file system. |
| FileSystem | Filesystem Nodes [Free] | cnt | 1m | The total number of available file nodes in the file system. |
| FileSystem | Filesystem Size [Available] | bytes | 1m | The available disk space (in bytes) that can be used by non-privileged users. |
| FileSystem | Filesystem Size [Free] | bytes | 1m | The available disk space (in bytes). |
| FileSystem | Filesystem Size [Total] | bytes | 1m | The total disk space (in bytes). |
| FileSystem | Filesystem Usage | % | 1m | The percentage of used disk space. |
| FileSystem | Filesystem Usage [Avg] | % | 1m | The average of filesystem.used.pct for individual file systems. |
| FileSystem | Filesystem Usage [Inode] | % | 1m | The inode usage rate. |
| FileSystem | Filesystem Usage [Max] | % | 1m | The maximum of filesystem.used.pct for individual file systems. |
| FileSystem | Filesystem Usage [Min] | % | 1m | The minimum of filesystem.used.pct for individual file systems. |
| FileSystem | Filesystem Usage [Total] | % | 1m | - |
| FileSystem | Filesystem Used | bytes | 1m | The used disk space (in bytes). |
| FileSystem | Filesystem Used [Inode] | bytes | 1m | The inode usage. |
| Memory | Memory Free | bytes | 1m | The total available memory (in bytes), excluding memory used by system cache and buffers (see system.memory.actual.free). |
| Memory | Memory Free [Actual] | bytes | 1m | The actual available memory (in bytes), which varies depending on the OS. On Linux, it is calculated using /proc/meminfo, and on OSX, it is the sum of available and inactive memory. On Windows, it is the same as system.memory.free. |
| Memory | Memory Free [Swap] | bytes | 1m | The available swap memory. |
| Memory | Memory Total | bytes | 1m | The total memory. |
| Memory | Memory Total [Swap] | bytes | 1m | The total swap memory. |
| Memory | Memory Usage | % | 1m | The percentage of used memory. |
| Memory | Memory Usage [Actual] | % | 1m | The percentage of actual used memory. |
| Memory | Memory Usage [Cache Swap] | % | 1m | The cache swap usage rate. |
| Memory | Memory Usage [Swap] | % | 1m | The percentage of used swap memory. |
| Memory | Memory Used | bytes | 1m | The used memory. |
| Memory | Memory Used [Actual] | bytes | 1m | The actual used memory (in bytes), which is the total memory minus the used memory. The available memory varies depending on the OS (see system.actual.free). |
| Memory | Memory Used [Swap] | bytes | 1m | The used swap memory. |
| Network | Collisions | cnt | 1m | Network collisions. |
| Network | Network In Bytes | bytes | 1m | The number of bytes received. |
| Network | Network In Bytes [Delta Avg] | bytes | 1m | The average of system.network.in.bytes_delta for individual networks. |
| Network | Network In Bytes [Delta Max] | bytes | 1m | The maximum of system.network.in.bytes_delta for individual networks. |
| Network | Network In Bytes [Delta Min] | bytes | 1m | The minimum of system.network.in.bytes_delta for individual networks. |
| Network | Network In Bytes [Delta Sum] | bytes | 1m | The sum of system.network.in.bytes_delta for individual networks. |
| Network | Network In Bytes [Delta] | bytes | 1m | The delta value of the number of bytes received. |
| Network | Network In Dropped | cnt | 1m | The number of packets dropped during reception. |
| Network | Network In Errors | cnt | 1m | The number of errors during reception. |
| Network | Network In Packets | cnt | 1m | The number of packets received. |
| Network | Network In Packets [Delta Avg] | cnt | 1m | The average of system.network.in.packets_delta for individual networks. |
| Network | Network In Packets [Delta Max] | cnt | 1m | The maximum of system.network.in.packets_delta for individual networks. |
| Network | Network In Packets [Delta Min] | cnt | 1m | The minimum of system.network.in.packets_delta for individual networks. |
| Network | Network In Packets [Delta Sum] | cnt | 1m | The sum of system.network.in.packets_delta for individual networks. |
| Network | Network In Packets [Delta] | cnt | 1m | The delta value of the number of packets received. |
| Network | Network Out Bytes | bytes | 1m | The number of bytes sent. |
| Network | Network Out Bytes [Delta Avg] | bytes | 1m | The average of system.network.out.bytes_delta for individual networks. |
| Network | Network Out Bytes [Delta Max] | bytes | 1m | The maximum of system.network.out.bytes_delta for individual networks. |
| Network | Network Out Bytes [Delta Min] | bytes | 1m | The minimum of system.network.out.bytes_delta for individual networks. |
| Network | Network Out Bytes [Delta Sum] | bytes | 1m | The sum of system.network.out.bytes_delta for individual networks. |
| Network | Network Out Bytes [Delta] | bytes | 1m | The delta value of the number of bytes sent. |
| Network | Network Out Dropped | cnt | 1m | The number of packets dropped during transmission. This value is not reported by the OS and is always 0 on Darwin and BSD. |
| Network | Network Out Errors | cnt | 1m | The number of errors during transmission. |
| Network | Network Out Packets | cnt | 1m | The number of packets sent. |
| Network | Network Out Packets [Delta Avg] | cnt | 1m | The average of system.network.out.packets_delta for individual networks. |
| Network | Network Out Packets [Delta Max] | cnt | 1m | The maximum of system.network.out.packets_delta for individual networks. |
| Network | Network Out Packets [Delta Min] | cnt | 1m | The minimum of system.network.out.packets_delta for individual networks. |
| Network | Network Out Packets [Delta Sum] | cnt | 1m | The sum of system.network.out.packets_delta for individual networks. |
| Network | Network Out Packets [Delta] | cnt | 1m | The delta value of the number of packets sent. |
| Network | Open Connections [TCP] | cnt | 1m | The number of open TCP connections. |
| Network | Open Connections [UDP] | cnt | 1m | The number of open UDP connections. |
| Network | Port Usage | % | 1m | The port usage rate. |
| Network | SYN Sent Sockets | cnt | 1m | The number of sockets in the SYN_SENT state (when connecting to a remote host). |
| Process | Kernel PID Max | cnt | 1m | The kernel.pid_max value. |
| Process | Kernel Thread Max | cnt | 1m | The kernel.threads-max value. |
| Process | Process CPU Usage | % | 1m | The percentage of CPU time consumed by the process since the last update. This value is similar to the %CPU value displayed by the top command on Unix systems. |
| Process | Process CPU Usage/Core | % | 1m | The percentage of CPU time used by the process since the last event, normalized by the number of cores (0-100%). |
| Process | Process Memory Usage | % | 1m | The percentage of main memory (RAM) used by the process. |
| Process | Process Memory Used | bytes | 1m | The resident set size, which is the amount of memory used by the process in RAM. On Windows, it is the current working set size. |
| Process | Process PID | PID | 1m | The process ID. |
| Process | Process PPID | PID | 1m | The parent process ID. |
| Process | Processes [Dead] | cnt | 1m | The number of dead processes. |
| Process | Processes [Idle] | cnt | 1m | The number of idle processes. |
| Process | Processes [Running] | cnt | 1m | The number of running processes. |
| Process | Processes [Sleeping] | cnt | 1m | The number of sleeping processes. |
| Process | Processes [Stopped] | cnt | 1m | The number of stopped processes. |
| Process | Processes [Total] | cnt | 1m | The total number of processes. |
| Process | Processes [Unknown] | cnt | 1m | The number of processes with unknown or unsearchable states. |
| Process | Processes [Zombie] | cnt | 1m | The number of zombie processes. |
| Process | Running Process Usage | % | 1m | The process usage rate. |
| Process | Running Processes | cnt | 1m | The number of running processes. |
| Process | Running Thread Usage | % | 1m | The thread usage rate. |
| Process | Running Threads | cnt | 1m | The total number of threads running in running processes. |
| System | Context Switches | cnt | 1m | The number of context switches per second. |
| System | Load/Core [1 min] | cnt | 1m | The load average over the last 1 minute, normalized by the number of cores. |
| System | Load/Core [15 min] | cnt | 1m | The load average over the last 15 minutes, normalized by the number of cores. |
| System | Load/Core [5 min] | cnt | 1m | The load average over the last 5 minutes, normalized by the number of cores. |
| System | Multipaths [Active] | cnt | 1m | The number of active paths for external storage connections. |
| System | Multipaths [Failed] | cnt | 1m | The number of failed paths for external storage connections. |
| System | Multipaths [Faulty] | cnt | 1m | The number of faulty paths for external storage connections. |
| System | NTP Offset | num | 1m | The measured offset (time difference between the NTP server and the local environment) of the last sample. |
| System | Run Queue Length | num | 1m | The length of the run queue. |
| System | Uptime | ms | 1m | The OS uptime (in milliseconds). |
| Windows | Context Switchies | cnt | 1m | The number of CPU context switches per second. |
| Windows | Disk Read Bytes [Sec] | cnt | 1m | The number of bytes read from the Windows logical disk per second. |
| Windows | Disk Read Time [Avg] | sec | 1m | The average time spent reading data (in seconds). |
| Windows | Disk Transfer Time [Avg] | sec | 1m | The average disk wait time. |
| Windows | Disk Usage | % | 1m | The disk usage rate. |
| Windows | Disk Write Bytes [Sec] | cnt | 1m | The number of bytes written to the Windows logical disk per second. |
| Windows | Disk Write Time [Avg] | sec | 1m | The average time spent writing data (in seconds). |
| Windows | Pagingfile Usage | % | 1m | The paging file usage rate. |
| Windows | Pool Used [Non Paged] | bytes | 1m | The Nonpaged Pool usage of kernel memory. |
| Windows | Pool Used [Paged] | bytes | 1m | The Paged Pool usage of kernel memory. |
| Windows | Process [Running] | cnt | 1m | The number of currently running processes. |
| Windows | Threads [Running] | cnt | 1m | The number of currently running threads. |
| Windows | Threads [Waiting] | cnt | 1m | The number of threads waiting for processor time. |
Table. Performance Items for Bare Metal Server
Note
To monitor the performance of Bare Metal Server, please install the Agent. Refer to Agent Management for the installation guide.
Storage type
File Storage
| Performance item group name | Performance item name | Collection unit | Collection cycle | Description |
|---|---|---|---|---|
| Volume | Instance State | state | 1m | File storage volume status |
| Volume | IOPS [Other] | iops | 1m | IOPS (other) |
| Volume | IOPS [Read] | iops | 1m | IOPS (read) |
| Volume | IOPS [Total] | iops | 1m | IOPS (total) |
| Volume | IOPS [Write] | iops | 1m | IOPS (write) |
| Volume | Latency Time [Other] | usec | 1m | Latency time (other) |
| Volume | Latency Time [Read] | usec | 1m | Latency time (read) |
| Volume | Latency Time [Total] | usec | 1m | Latency time (total) |
| Volume | Latency Time [write] | usec | 1m | Latency time (write) |
| Volume | Throughput [Other] | MB/s | 1m | Throughput (other) |
| Volume | Throughput [Read] | MB/s | 1m | Throughput (read) |
| Volume | Throughput [Total] | MB/s | 1m | Throughput (total) |
| Volume | Throughput [Write] | MB/s | 1m | Throughput (write) |
| Volume | Volume Total | bytes | 1m | Total bytes |
| Volume | Volume Usage | % | 1m | Usage rate |
| Volume | Volume Used | bytes | 1m | Used amount |
Table. File Storage performance items
Object Storage
| Performance item group name | Performance item name | Collection unit | Collection cycle | Description |
|---|---|---|---|---|
| Request | Requests [Delete] | cnt | 1m | Number of HTTP DELETE requests executed on objects in the bucket |
| Request | Requests [Download Avg] | bytes | 1m | Average download usage per bucket |
| Request | Requests [Get] | cnt | 1m | Number of HTTP GET requests executed on objects in the bucket |
| Request | Requests [Head] | cnt | 1m | Number of HTTP HEAD requests executed on objects in the bucket |
| Request | Requests [List] | cnt | 1m | Number of LIST requests executed on objects in the bucket |
| Request | Requests [Post] | cnt | 1m | Number of HTTP POST requests executed on objects in the bucket |
| Request | Requests [Put] | cnt | 1m | Number of HTTP PUT requests executed on objects in the bucket |
| Request | Requests [Total] | cnt | 1m | Total number of HTTP requests executed on the bucket |
| Request | Requests [Upload Avg] | bytes | 1m | Average upload usage per bucket |
| Usage | Bucket Used | bytes | 1m | Amount of data stored in the bucket (in bytes) |
| Usage | Objects | cnt | 1m | Number of objects stored in the bucket |
Table. Object Storage performance items
Database type
PostgreSQL(DBaaS)
| Performance item group name | Performance item name | Collection unit | Collection cycle | Description |
|---|---|---|---|---|
| Activelock | Active Locks | cnt | 1m | Number of active locks |
| Activelock | Active Locks [Access Exclusive] | cnt | 1m | Number of access exclusive locks |
| Activelock | Active Locks [Access Share] | cnt | 1m | Number of access share locks |
| Activelock | Active Locks [Total] | cnt | 1m | Total number of active locks |
| Activelock | Exclusive Locks | cnt | 1m | Number of exclusive locks |
| Activelock | Row Exclusive Locks | cnt | 1m | Number of row exclusive locks |
| Activelock | Row Share Locks | cnt | 1m | Number of row share locks |
| Activelock | Share Locks | cnt | 1m | Number of share locks |
| Activelock | Share Row Exclusive Locks | cnt | 1m | Number of share row exclusive locks |
| Activelock | Share Update Exclusive Locks | cnt | 1m | Number of share update exclusive locks |
| ActiveSession | Active Sessions | cnt | 1m | Number of active sessions |
| ActiveSession | Active Sessions [Total] | cnt | 1m | Total number of active sessions |
| ActiveSession | Idle In Transaction Sessions | cnt | 1m | Number of idle in transaction sessions |
| ActiveSession | Idle In Transaction Sessions [Total] | cnt | 1m | Total number of idle in transaction sessions |
| ActiveSession | Idle Sessions | cnt | 1m | Number of idle sessions |
| ActiveSession | Idle Sessions [Total] | cnt | 1m | Total number of idle sessions |
| ActiveSession | Waiting Sessions | cnt | 1m | Number of waiting sessions |
| ActiveSession | Waiting Sessions [Total] | cnt | 1m | Total number of waiting sessions |
| Connection | Connection Usage | % | 1m | DB connection usage rate |
| Connection | Connection Usage [Total] | % | 1m | Total DB connection usage rate |
| DB Age | DB Age Max | age | 1m | Database age (frozen XID) value |
| Lock | Wait Locks | cnt | 1m | Number of sessions waiting for locks (per DB) |
| Lock | Wait Locks [Long Total] | cnt | 1m | Number of sessions waiting for locks for more than 300 seconds |
| Lock | Wait Locks [Long] | cnt | 1m | Number of sessions waiting for locks for more than 300 seconds |
| Lock | Wait Locks [Total] | cnt | 1m | Total number of sessions waiting for locks |
| Long Transaction | Transaction Time Max [Long] | sec | 1m | Longest transaction time (in seconds) |
| Long Transaction | Transaction Time Max Total [Long] | sec | 1m | Longest transaction time (in seconds) |
| Replica | Apply Lag Time | sec | 1m | Apply lag time |
| Replica | Check No Replication | cnt | 1m | Check no replication value |
| Replica | Check Replication | state | 1m | Check replication state value |
| Slowquery | Slowqueries | cnt | 1m | Number of slow queries (more than 5 minutes) |
| State | Instance State [PID] | PID | 1m | Postgres process PID |
| Tablespace | Tablespace Used | bytes | 1m | Tablespace usage |
| Tablespace | Tablespace Used [Total] | bytes | 1m | Total tablespace usage |
| Tablespace | Tablespace Used Bytes [MB] | bytes | 1m | Filesystem directory usage (in MB) |
| Tablespace | Tablespaces [Total] | cnt | 1m | Total number of tablespaces |
Table. PostgreSQL(DBaaS) performance items
Note
Refer to Virtual Server performance items for DB instance performance items.
MariaDB(DBaaS)
| Performance item group name | Performance item name | Collection unit | Collection cycle | Description |
|---|---|---|---|---|
| Activelock | Active Locks | cnt | 1m | Number of active locks |
| Activesssion | Active Sessions | cnt | 1m | Number of connected threads |
| Activesssion | Connection Usage [Total] | % | 1m | DB connection usage rate |
| Activesssion | Connections | cnt | 1m | Number of connections |
| Activesssion | Connections [MAX] | cnt | 1m | Maximum number of connected threads |
| Datafile | Binary Log Used [MB] | bytes | 1m | Binary log usage (in MB) |
| Datafile | Data Directory Used [MB] | bytes | 1m | Datadir usage (in MB) |
| Datafile | Open Files | cnt | 1m | Number of open files |
| Datafile | Open Files [MAX] | cnt | 1m | Maximum number of open files |
| Datafile | Open Files Usage | % | 1m | Open file usage rate |
| Datafile | Relay Log Used [MB] | bytes | 1m | Relay log usage (in MB) |
| State | Instance State [PID] | PID | 1m | Mariadbd process PID (or mysqld process PID for versions prior to 10.5.2) |
| State | Safe PID | PID | 1m | Mariadbd_safe process PID (or mysqld_safe process PID for versions prior to 10.5.2) |
| State | Slave Behind Master seconds | sec | 1m | Time difference between master and slave (in seconds) |
| Tablespace | Tablespace Used | bytes | 1m | Tablespace usage |
| Tablespace | Tablespace Used [Total] | bytes | 1m | Total tablespace usage |
| Transaction | Running Threads | cnt | 1m | Number of running threads |
| Transaction | Slowqueries | cnt | 1m | Number of slow queries (more than 10 seconds) |
| Transaction | Slowqueries [Total] | cnt | 1m | Total number of slow queries |
| Transaction | Transaction Time [Long] | sec | 1m | Longest transaction time (in seconds) |
| Transaction | Wait Locks | cnt | 1m | Number of sessions waiting for locks for more than 60 seconds |
Table. MariaDB(DBaaS) performance items
Note
Refer to Virtual Server performance items for DB instance performance items.
MySQL(DBaaS)
| Performance item group name | Performance item name | Collection unit | Collection cycle | Description |
|---|---|---|---|---|
| Activelock | Active Locks | cnt | 1m | Number of active locks |
| Activesssion | Active Sessions | cnt | 1m | Number of connected threads |
| Activesssion | Connection Usage [Total] | % | 1m | DB connection usage rate |
| Activesssion | Connections | cnt | 1m | Number of connections |
| Activesssion | Connections [MAX] | cnt | 1m | Maximum number of connected threads |
| Datafile | Binary Log Used [MB] | bytes | 1m | Binary log usage (in MB) |
| Datafile | Data Directory Used [MB] | bytes | 1m | Datadir usage (in MB) |
| Datafile | Open Files | cnt | 1m | Number of open files |
| Datafile | Open Files [MAX] | cnt | 1m | Maximum number of open files |
| Datafile | Open Files Usage | % | 1m | Open file usage rate |
| Datafile | Relay Log Used [MB] | bytes | 1m | Relay log usage (in MB) |
| State | Instance State [PID] | PID | 1m | Mysqld process PID |
| State | Safe PID | PID | 1m | Safe program PID |
| State | Slave Behind Master seconds | sec | 1m | Time difference between master and slave (in seconds) |
| Tablespace | Tablespace Used | bytes | 1m | Tablespace usage |
| Tablespace | Tablespace Used [Total] | bytes | 1m | Total tablespace usage |
| Transaction | Running Threads | cnt | 1m | Number of running threads |
| Transaction | Slowqueries | cnt | 1m | Number of slow queries (more than 10 seconds) |
| Transaction | Slowqueries [Total] | cnt | 1m | Total number of slow queries |
| Transaction | Transaction Time [Long] | sec | 1m | Longest transaction time (in seconds) |
| Transaction | Wait Locks | cnt | 1m | Number of sessions waiting for locks for more than 60 seconds |
Table. MySQL(DBaaS) performance items
Note
Refer to Virtual Server performance items for DB instance performance items.
CacheStore(DBaaS)
| Performance item group name | Performance item name | Collection unit | Collection cycle | Description |
|---|---|---|---|---|
| CacheStore | Active Defragmentation Keys [Hits] | cnt | 1m | Number of keys defragmented |
| CacheStore | Active Defragmentation Keys [Miss] | cnt | 1m | Number of keys skipped during defragmentation |
| CacheStore | Active Defragmentationd [Hits] | cnt | 1m | Number of values reassigned during defragmentation |
| CacheStore | Active Defragmentations [Miss] | cnt | 1m | Number of defragmentation processes started and stopped |
| CacheStore | Allocated Bytes [OS] | bytes | 1m | Bytes allocated by CacheStore and recognized by the operating system (resident set size) |
| CacheStore | Allocated Bytes [Redis] | bytes | 1m | Total bytes allocated by CacheStore |
| CacheStore | AOF Buffer Size | bytes | 1m | AOF buffer size |
| CacheStore | AOF File Size [Current] | bytes | 1m | Current AOF file size |
| CacheStore | AOF File Size [Lastest Startup] | bytes | 1m | AOF file size at the last startup or rewrite |
| CacheStore | AOF Rewrite Buffer Size | bytes | 1m | AOF rewrite buffer size |
| CacheStore | AOF Rewrite Current Time | sec | 1m | Time spent on the current AOF rewrite process |
| CacheStore | AOF Rewrite Last Time | sec | 1m | Time spent on the last AOF rewrite process |
| CacheStore | Calls | cnt | 1m | Number of commands executed (not rejected) |
| CacheStore | Calls [Failed] | cnt | 1m | Number of failed commands (CacheStore 6.2-rc2) |
| CacheStore | Calls [Rejected] | cnt | 1m | Number of rejected commands (CacheStore 6.2-rc2) |
| CacheStore | Changes [Last Saved] | cnt | 1m | Number of changes since the last dump |
| CacheStore | Client Output Buffer [MAX] | cnt | 1m | Longest output list among current client connections |
| CacheStore | Client Input Buffer [MAX] | cnt | 1m | Largest input buffer among current client connections (CacheStore 5.0) |
| CacheStore | Clients [Sentinel] | cnt | 1m | Number of client connections (sentinel) |
| CacheStore | Connected Slaves | cnt | 1m | Number of connected slaves |
| CacheStore | Connections [Blocked] | cnt | 1m | Number of clients waiting for blocking calls (BLPOP, BRPOP, BRPOPLPUSH) |
| CacheStore | Connections [Current] | cnt | 1m | Number of client connections (excluding slave connections) |
| CacheStore | Copy On Write Allocated Size [AOF] | bytes | 1m | COW allocation size (in bytes) during the last RDB save operation |
| CacheStore | Copy On Write Allocated Size [RDB] | bytes | 1m | COW allocation size (in bytes) during the last RDB save operation |
| CacheStore | CPU Time [Average] | cnt | 1m | Average CPU usage per command execution |
| CacheStore | CPU Time [Total] | usec | 1m | Total CPU time used by these commands |
| CacheStore | CPU Usage [System Process] | % | 1m | System CPU usage by background processes |
| CacheStore | CPU Usage [System] | % | 1m | System CPU usage by the CacheStore server |
| CacheStore | CPU Usage [User Process] | % | 1m | User CPU usage by background processes |
| CacheStore | CPU Usage [User] | % | 1m | User CPU usage by the CacheStore server |
| CacheStore | Dataset Used | bytes | 1m | Dataset size (in bytes) |
| CacheStore | Disk Used | bytes | 1m | Datadir usage |
| CacheStore | Evicted Keys | cnt | 1m | Number of evicted keys due to maxmemory limit |
| CacheStore | Fsyncs [Delayed] | cnt | 1m | Delayed fsync counter |
| CacheStore | Fsyncs [Pending] | cnt | 1m | Number of fsync operations pending in the background I/O queue (in bytes) |
| CacheStore | Full Resyncs | cnt | 1m | Number of full resynchronizations with slaves |
| CacheStore | Keys [Expired] | cnt | 1m | Total number of key expiration events |
| CacheStore | Keys [Keyspace] | cnt | 1m | Number of keys in the keyspace |
| CacheStore | Lastest Fork Duration Time | usec | 1m | Time taken by the last fork operation (in microseconds) |
| CacheStore | Lookup Keys [Hit] | cnt | 1m | Number of successful key lookups in the main dictionary |
| CacheStore | Lookup Keys [Miss] | cnt | 1m | Number of failed key lookups in the main dictionary |
| CacheStore | Lua Engine Memory Used | bytes | 1m | Memory used by the Lua engine |
| CacheStore | Master Last Interaction Time Ago | sec | 1m | Time elapsed since the last interaction with the master (in seconds) |
| CacheStore | Master Last Interaction Time Ago [Sync] | sec | 1m | Time elapsed since the last interaction with the master (in seconds) |
| CacheStore | Master Offset | pid | 1m | Current replication offset of the server |
| CacheStore | Master Second Offset | pid | 1m | Offset of the replication ID that will be accepted |
| CacheStore | Master Sync Left Bytes | bytes | 1m | Number of bytes remaining to be synchronized |
| CacheStore | Memory Fragmentation Rate | % | 1m | Ratio of used_memory_rss to used_memory |
| CacheStore | Memory Fragmentation Rate [Allocator] | % | 1m | Fragmentation ratio |
| CacheStore | Memory Fragmentation Used | bytes | 1m | Difference between used_memory_rss and used_memory (in bytes) |
| CacheStore | Memory Fragmentation Used [Allocator] | bytes | 1m | Resident bytes |
| CacheStore | Memory Max Value | bytes | 1m | Memory limit |
| CacheStore | Memory Resident [Allocator] | bytes | 1m | Resident memory |
| CacheStore | Memory RSS Rate [Allocator] | % | 1m | Resident ratio |
| CacheStore | Memory Used [Active] | bytes | 1m | Active memory |
| CacheStore | Memory Used [Allocated] | bytes | 1m | Allocated memory |
| CacheStore | Memory Used [Resident] | bytes | 1m | Resident bytes |
| CacheStore | Network In Bytes [Total] | bytes | 1m | Total network input (in bytes) |
| CacheStore | Network Out Bytes [Total] | bytes | 1m | Total network output (in bytes) |
| CacheStore | Network Read Rate | cnt | 1m | Network read rate (in KB/sec) |
| CacheStore | Network Write Rate | cnt | 1m | Network write rate (in KB/sec) |
| CacheStore | Partial Resync Requests [Accepted] | cnt | 1m | Number of accepted partial resynchronization requests |
| CacheStore | Partial Resync Requests [Denied] | cnt | 1m | Number of denied partial resynchronization requests |
| CacheStore | Peak Memory Consumed | bytes | 1m | Maximum memory consumed by CacheStore |
| CacheStore | Processed Commands | cnt | 1m | Number of commands processed per second |
| CacheStore | Processed Commands [Total] | cnt | 1m | Total number of commands processed |
| CacheStore | Pub/Sub Channels | cnt | 1m | Global number of pub/sub channels with client subscriptions |
| CacheStore | Pub/Sub Patterns | cnt | 1m | Global number of pub/sub patterns with client subscriptions |
| CacheStore | RDB Saved Duration Time [Current] | sec | 1m | Time taken by the current RDB save operation (in seconds) |
| CacheStore | RDB Saved Duration Time [Last] | sec | 1m | Time taken by the last RDB save operation (in seconds) |
| CacheStore | Received Connections [Total] | cnt | 1m | Total number of connections received |
| CacheStore | Rejected Connections [Total] | cnt | 1m | Total number of connections rejected |
| CacheStore | Replication Backlog Actove Count | cnt | 1m | Replication backlog active flag |
| CacheStore | Replication Backlog Master Offset | cnt | 1m | Master offset of the replication backlog buffer |
| CacheStore | Replication Backlog Size | bytes | 1m | Size of the replication backlog buffer (in bytes) |
| CacheStore | Replication Backlog Size [Total] | bytes | 1m | Total size of the replication backlog buffer (in bytes) |
| CacheStore | Slave Priority | cnt | 1m | Priority of the instance as a failover target |
| CacheStore | Slave Replication Offset | pid | 1m | Replication offset of the slave instance |
| CacheStore | Slow Operations | cnt | 1m | Number of slow operations |
| CacheStore | Sockets [MIGRATE] | cnt | 1m | Number of sockets opened for migration |
| CacheStore | Tracked Keys [Expiry] | cnt | 1m | Number of keys being tracked for expiry (only for writable slaves) |
| State | Instance State [PID] | PID | 1m | PID of the redis-server process |
| State | Sentinel State [PID] | PID | 1m | PID of the sentinel process |
Table. CacheStore (DBaaS) Performance Items
Note
Refer to the performance items of the Virtual Server for the performance items of the DB instance.
EPAS
| Performance Item Group Name | Performance Item Name | Collection Unit | Collection Cycle | Description |
|---|---|---|---|---|
| Activelock | Access Exclusive Locks | cnt | 1m | Number of access exclusive locks |
| Activelock | Access Share Locks | cnt | 1m | Number of access share locks |
| Activelock | Active Locks | cnt | 1m | Number of active locks |
| Activelock | Active Locks [Total] | cnt | 1m | Total number of active locks |
| Activelock | Exclusive Locks | cnt | 1m | Number of exclusive locks |
| Activelock | Row Exclusive Locks | cnt | 1m | Number of row exclusive locks |
| Activelock | Row Share Locks | cnt | 1m | Number of row share locks |
| Activelock | Share Locks | cnt | 1m | Number of share locks |
| Activelock | Share Row Exclusive Locks | cnt | 1m | Number of share row exclusive locks |
| Activelock | Share Update Exclusive Locks | cnt | 1m | Number of share update exclusive locks |
| Activesession | Active Sessions | cnt | 1m | Number of active sessions |
| Activesession | Active Sessions [Total] | cnt | 1m | Total number of active sessions |
| Activesession | Idel In Transaction Sessions | cnt | 1m | Number of idle in transaction sessions |
| Activesession | Idle In Transaction Sessions [Total] | cnt | 1m | Total number of idle in transaction sessions |
| Activesession | Idle Sessions | cnt | 1m | Number of idle sessions |
| Activesession | Idle Sessions [Total] | cnt | 1m | Total number of idle sessions |
| Activesession | Waiting Sessions | cnt | 1m | Number of waiting sessions |
| Activesession | Waiting Sessions [Total] | cnt | 1m | Total number of waiting sessions |
| Connection | Connection Usage | % | 1m | DB connection usage rate (%) |
| Connection | Connection Usage [Total] | % | 1m | Total DB connection usage rate (%) |
| Connection | Connection Usage Per DB | % | 1m | DB connection usage rate per DB (%) |
| DB Age | DB Age Max | age | 1m | Database age (frozen XID) value |
| Lock | Wait Locks | cnt | 1m | Number of sessions waiting for locks |
| Lock | Wait Locks [Long Total] | cnt | 1m | Total number of sessions waiting for locks for a long time |
| Lock | Wait Locks [Long] | cnt | 1m | Number of sessions waiting for locks for a long time |
| Lock | Wait Locks [Total] | cnt | 1m | Total number of sessions waiting for locks |
| Lock | Wait Locks Per DB [Total] | cnt | 1m | Total number of sessions waiting for locks per DB |
| Long Transaction | Transaction Time Max [Long] | sec | 1m | Maximum transaction time (in minutes) |
| Long Transaction | Transaction Time Max Total [Long] | sec | 1m | Maximum transaction time (in minutes) |
| Replica | Apply Lag Time | sec | 1m | Apply lag time |
| Replica | Check No Replication | cnt | 1m | Check no replication value |
| Replica | Check Replication | state | 1m | Check replication state value |
| Slowquery | Slowqueries | cnt | 1m | Number of slow queries |
| State | Instance state [PID] | PID | 1m | PID of the edb-postgres process |
| Tablespace | Tablespace Used Bytes [MB] | bytes | 1m | Filesystem directory usage (in MB) |
| Tablespace | Tablespace [Total] | cnt | 1m | Total number of tablespaces |
| Tablespace | Tablespace Used | bytes | 1m | Used tablespace size |
| Tablespace | Tablespace Used [Total] | bytes | 1m | Total used tablespace size |
Table. EPAS Performance Items
Microsoft SQL Server
| Performance Item Group Name | Performance Item Name | Collection Unit | Collection Cycle | Description |
|---|---|---|---|---|
| Activelock | Active Locks | cnt | 1m | Number of active locks |
| Activesssion | Active Sessions | cnt | 1m | Number of active sessions |
| Activetransaction | Active Transactions [Total] | cnt | 1m | Total number of active transactions |
| Connection | Connected Users | cnt | 1m | Number of users connected to the system |
| Datafile | Datavolume Size [Free] | bytes | 1m | Available space |
| Datafile | DBFiles [Not Online] | cnt | 1m | Number of data files that are not online |
| Datafile | Tablespace Used | bytes | 1m | Used data volume size |
| Lock | Lock Processes [Blocked] | cnt | 1m | Number of SQL processes blocked by other processes |
| Lock | Lock Waits [Per Second] | cnt | 1m | Number of lock waits per second |
| Slowquery | Blocking Session ID | ID | 1m | ID of the session blocking the query |
| Slowquery | Slowqueries | cnt | 1m | Number of slow queries |
| Slowquery | Slowquery CPU Time | ms | 1m | CPU time taken by slow queries |
| Slowquery | Slowquery Execute Context ID | ID | 1m | ID of the execution context of slow queries |
| Slowquery | Slowquery Memory Usage | bytes | 1m | Memory usage of slow queries |
| Slowquery | Slowquery Session ID | ID | 1m | ID of the session executing slow queries |
| Slowquery | Slowquery Wait Duration Time | ms | 1m | Wait duration time of slow queries |
| State | Instance State [Cluster] | state | 1m | State of the MSSQL cluster |
| State | Instance State [PID] | PID | 1m | PID of the sqlservr.exe process |
| State | Page IO Latch Wait Time | ms | 1m | Average wait time for page IO latches |
| Transaction | Transaction Time [MAX] | cnt | 1m | Maximum transaction time |
Table. Microsoft SQL Server
Data Analytics 유형
Event Streams
| Performance Item Group Name | Performance Item Name | Collection Unit | Collection Cycle | Description |
|---|---|---|---|---|
| Broker | Connections [Zookeeper Client] | cnt | 1m | Number of ZooKeeper connections |
| Broker | Failed [Client Fetch Request] | cnt | 1m | Number of failed client fetch requests |
| Broker | Failed [Produce Request] | cnt | 1m | Number of failed produce requests |
| Broker | Incomming Messages | cnt | 1m | Number of incoming messages |
| Broker | Leader Elections | cnt | 1m | Number of leader elections |
| Broker | Leader Elections [Unclean] | cnt | 1m | Number of unclean leader elections |
| Broker | Log Flushes | cnt | 1m | Number of log flushes |
| Broker | Network In Bytes | bytes | 1m | Total network input (in bytes) |
| Broker | Network Out Bytes | bytes | 1m | Total network output (in bytes) |
| Broker | Rejected Bytes | bytes | 1m | Total rejected bytes |
| Broker | Request Queue Length | cnt | 1m | Request queue length |
| Broker | Zookeeper Sessions [Closed] | cnt | 1m | Number of closed ZooKeeper sessions |
| Broker | Zookeeper Sessions [Expired] | cnt | 1m | Number of expired ZooKeeper sessions |
| Broker | Zookeeper Sessions [Readonly] | cnt | 1m | Number of read-only ZooKeeper sessions |
| Broker | Incomming Messages Rate [Topic] | cnt | 1m | Incoming message rate per topic |
| Broker | Incomming Byte Rate [Second] | bytes | 1m | Incoming byte rate per second |
| Broker | Outgoing Byte Rate [Second] | bytes | 1m | Outgoing byte rate per second |
| Broker | Rejected Byte Rate [Second] | bytes | 1m | Rejected byte rate per second |
| Disk | Disk Used | bytes | 1m | Datadir usage |
| State | AKHQ State [PID] | PID | 1m | PID of the akhq process |
| State | Instance State [PID] | PID | 1m | PID of the kafka process |
| State | Zookeeper State [PID] | PID | 1m | PID of the zookeeper process |
Table. Event Streams
Search Engine
| Performance Item Group Name | Performance Item Name | Collection Unit | Collection Cycle | Description |
|---|---|---|---|---|
| Cluster | Shards | cnt | 1m | Number of shards in the cluster |
| Cluster | Shards [Primary] | cnt | 1m | Number of primary shards in the cluster |
| Cluster | Index [Total] | cnt | 1m | Total number of indices in the cluster |
| Cluster | License Expiry Date [ms] | ms | 1m | License expiry date (in milliseconds) |
| Cluster | License Status | state | 1m | License status |
| Cluster | License Type | type | 1m | License type |
| FileSystem | Disk Usage | bytes | 1m | Datadir usage |
| Node | Documents [Deleted] | cnt | 1m | Total number of deleted documents |
| Node | Documents [Existing] | cnt | 1m | Total number of existing documents |
| Node | Filesystem Bytes [Available] | bytes | 1m | Available filesystem bytes |
| Node | Filesystem Bytes [Free] | bytes | 1m | Free filesystem bytes |
| Node | Filesystem Bytes [Total] | bytes | 1m | Total filesystem bytes |
| Node | JVM Heap Used [Init] | bytes | 1m | Initial JVM heap usage (in bytes) |
| Node | JVM Heap Used [MAX] | bytes | 1m | Maximum JVM heap usage (in bytes) |
| Node | JVM Non Heap Used [Init] | bytes | 1m | Initial JVM non-heap usage (in bytes) |
| Node | JVM Non Heap Used [MAX] | bytes | 1m | Maximum JVM non-heap usage (in bytes) |
| Node | Segments | cnt | 1m | Total number of segments |
| Node | Segments Bytes | bytes | 1m | Total size of segments (in bytes) |
| Node | Store Bytes | bytes | 1m | Total size of the store (in bytes) |
| State | Instance state [PID] | PID | 1m | PID of the Elasticsearch process |
| Task | Queue Time | ms | 1m | Queue time |
| Kibana | Kibana state [PID] | PID | 1m | PID of the Kibana process |
| Kibana | Kibana Connections | cnt | 1m | Number of connections |
| Kibana | Kibana Memory Heap Allocated [Limit] | bytes | 1m | Maximum allocated heap size (in bytes) |
| Kibana | Kibana Memory Heap Allocated [Total] | bytes | 1m | Total allocated heap size (in bytes) |
| Kibana | Kibana Memory Heap Used | bytes | 1m | Used heap size (in bytes) |
| Kibana | Kibana Process Uptime | ms | 1m | Process uptime |
| Kibana | Kibana Requests [Disconnected] | cnt | 1m | Number of disconnected requests |
| Kibana | Kibana Requests [Total] | cnt | 1m | Total number of requests |
| Kibana | Kibana Response Time [Avg] | ms | 1m | Average response time |
| Kibana | Kibana Response Time [MAX] | ms | 1m | Maximum response time |
Table. Search Engine
Container 유형
Kubernetes Engine
| Performance Item Group Name | Performance Item Name | Collection Unit | Collection Cycle | Description |
|---|---|---|---|---|
| Cluster | Cluster Namespaces [Active] | cnt | 5m | Number of active namespaces |
| Cluster | Cluster Namespaces [Total] | cnt | 5m | Total number of namespaces |
| Cluster | Cluster Nodes [Ready] | cnt | 5m | Number of ready nodes |
| Cluster | Cluster Nodes [Total] | cnt | 5m | Total number of nodes |
| Cluster | Cluster Pods [Failed] | cnt | 5m | Number of failed pods |
| Cluster | Cluster Pods [Pending] | cnt | 5m | Number of pending pods |
| Cluster | Cluster Pods [Running] | cnt | 5m | Number of running pods |
| Cluster | Cluster Pods [Succeeded] | cnt | 5m | Number of succeeded pods |
| Cluster | Cluster Pods [Unknown] | cnt | 5m | Number of unknown pods |
| Cluster | Instance State | state | 5m | Cluster state |
| Namespace | Namespace Pods [Failed] | cnt | 5m | Number of failed pods in the namespace |
| Namespace | Namespace Pods [Pending] | cnt | 5m | Number of pending pods in the namespace |
| Namespace | Namespace Pods [Running] | cnt | 5m | Number of running pods in the namespace |
| Namespace | Namespace Pods [Succeeded] | cnt | 5m | Number of succeeded pods in the namespace |
| Namespace | Namespace Pods [Unknown] | cnt | 5m | Number of unknown pods in the namespace |
| Namespace | Namespace GPU Clock Frequency | MHz | 5m | GPU clock frequency |
| Namespace | Namespace GPU Memory Usage | % | 5m | GPU memory usage |
| Node | Node CPU Size [Allocatable] | cnt | 5m | Allocatable CPU size |
| Node | Node CPU Size [Capacity] | cnt | 5m | CPU capacity |
| Node | Node CPU Usage | % | 5m | CPU usage |
| Node | Node CPU Usage [Request] | % | 5m | CPU request ratio |
| Node | Node CPU Used | state | 5m | CPU utilization |
| Node | Node Filesystem Usage | % | 5m | Filesystem usage |
| Node | Node Memory Size [Allocatable] | bytes | 5m | Allocatable memory size |
| Node | Node Memory Size [Capacity] | bytes | 5m | Memory capacity |
| Node | Node Memory Usage | % | 5m | Memory usage |
| Node | Node Memory Usage [Request] | % | 5m | Memory request ratio |
| Node | Node Memory Workingset | bytes | 5m | Node memory working set |
| Node | Node Network In Bytes | bytes | 5m | Node network RX bytes |
| Node | Node Network Out Bytes | bytes | 5m | Node network TX bytes |
| Node | Node Network Total Bytes | bytes | 5m | Node network total bytes |
| Node | Node Pods [Failed] | cnt | 5m | Number of failed pods in the node |
| Node | Node Pods [Pending] | cnt | 5m | Number of pending pods in the node |
| Node | Node Pods [Running] | cnt | 5m | Number of running pods in the node |
| Node | Node Pods [Succeeded] | cnt | 5m | Number of succeeded pods in the node |
| Node | Node Pods [Unknown] | cnt | 5m | Number of unknown pods in the node |
| Pod | Pod CPU Usage [Limit] | % | 5m | Pod CPU usage limit ratio |
| Pod | Pod CPU Usage [Request] | % | 5m | Pod CPU request ratio |
| Pod | Pod CPU Usage | mc | 5m | Pod CPU usage |
| Pod | Pod Memory Usage [Limit] | % | 5m | Pod memory usage limit ratio |
| Pod | Pod Memory Usage [Request] | % | 5m | Pod memory request ratio |
| Pod | Pod Memory Usage | bytes | 5m | Pod memory usage |
| Pod | Pod Network In Bytes | bytes | 5m | Pod network RX bytes |
| Pod | Pod Network Out Bytes | bytes | 5m | Pod network TX bytes |
| Pod | Pod Network Total Bytes | bytes | 5m | Pod network total bytes |
| Pod | Pod Restart Containers | cnt | 5m | Number of container restarts in the pod |
| Workload | Workload Pods [Running] | cnt | 5m | - |
Table. Kubernetes Engine performance items
Container Registry
| Performance Item Group Name | Performance Item Name | Collection Unit | Collection Cycle | Description |
|---|---|---|---|---|
| Container Registry | Image Pulls [Denied] | cnt | 1m | Number of denied image tag (digest) pulls |
| Container Registry | Image Pushs [Allowed] | cnt | 1m | Number of allowed image tag (digest) pushes |
| Container Registry | Image Pushs [Denied] | cnt | 1m | Number of denied image tag (digest) pushes |
| Container Registry | Image Scans [Allowed] | cnt | 1m | Number of allowed image tag (digest) scans |
| Container Registry | Image Scans [Denied] | cnt | 1m | Number of denied image tag (digest) scans |
| Container Registry | Image Tags [Deleted] | cnt | 1m | Number of deleted image tags (digests) |
| Container Registry | Images [Created] | cnt | 1m | Number of created images |
| Container Registry | Images [Deleted] | cnt | 1m | Number of deleted images |
| Container Registry | Logins [Allowed] | cnt | 1m | Number of allowed registry logins |
| Container Registry | Logins [Denied] | cnt | 1m | Number of denied registry logins |
| Container Registry | Repositories [Created] | cnt | 1m | Number of created repositories |
| Container Registry | Repositories [Deleted] | cnt | 1m | Number of deleted repositories |
| State | Instance State | state | 1m | Status check |
Table. Container Registry performance items
Networking Type
Internet Gateway
| Performance Item Group Name | Performance Item Name | Collection Unit | Collection Cycle | Description |
|---|---|---|---|---|
| Internet Gateway | Network In Total Bytes [Internet Delta] | bytes | 5m | Cumulative traffic from Internet Gateway to VPC over 5 minutes (Internet) ※ Average traffic bps conversion formula: cumulative traffic (bytes) / 300 (seconds) * 8 (bits) |
| Internet Gateway | Network In Total Bytes [Internet] | bytes | 5m | RX bytes total |
| Internet Gateway | Network Out Total Bytes [Internet Delta] | bytes | 5m | Cumulative traffic from VPC to Internet Gateway over 5 minutes (Internet) ※ Average traffic bps conversion formula: cumulative traffic (bytes) / 300 (seconds) * 8 (bits) |
| Internet Gateway | Network Out Total Bytes [Internet] | bytes | 5m | TX bytes total |
Table. Internet Gateway performance items
Load Balancer (OLD)
| Performance Item Group Name | Performance Item Name | Collection Unit | Collection Cycle | Description |
|---|---|---|---|---|
| Load Balancer | Current Connection | cnt | 5m | Current number of connections |
| Load Balancer | Total Connection | cnt | 5m | Total number of connections |
| Load Balancer | Total Connection [Delta] | cnt | 5m | Total number of connections (delta value) |
| Load Balancer | Network In Bytes | bytes | 5m | In bytes |
| Load Balancer | Network In Bytes [Delta] | bytes | 5m | Cumulative traffic from client to Load Balancer over 5 minutes ※ Average traffic bps conversion formula: cumulative traffic (bytes) / 300 (seconds) * 8 (bits) |
| Load Balancer | Network Out Bytes | bytes | 5m | Out bytes |
| Load Balancer | Network Out Bytes [Delta] | bytes | 5m | Cumulative traffic from Load Balancer to client over 5 minutes ※ Average traffic bps conversion formula: cumulative traffic (bytes) / 300 (seconds) * 8 (bits) |
| Load Balancer | Instance State | state | 5m | Load Balancer status |
Table. Load Balancer performance items
Load Balancer Listener (OLD)
| Performance Item Group Name | Performance Item Name | Collection Unit | Collection Cycle | Description |
|---|---|---|---|---|
| Listener | Connections [Current] | cnt | 5m | Current number of connections |
| Listener | Connections [Total Delta] | cnt | 5m | Total number of connections (delta value) |
| Listener | Connections [Total] | cnt | 5m | Total number of connections |
| Listener | Instance State | state | 5m | LB Listener status |
| Listener | Network In Bytes | bytes | 5m | In bytes |
| Listener | Network In Bytes [Delta] | bytes | 5m | Cumulative traffic from client to Load Balancer over 5 minutes ※ Average traffic bps conversion formula: cumulative traffic (bytes) / 300 (seconds) * 8 (bits) |
| Listener | Network Out Bytes | bytes | 5m | Out bytes |
| Listener | Network Out Bytes [Delta] | bytes | 5m | Cumulative traffic from Load Balancer to client over 5 minutes ※ Average traffic bps conversion formula: cumulative traffic (bytes) / 300 (seconds) * 8 (bits) |
Table. Load Balancer Listener performance items
Direct Connect
| Performance Item Group Name | Performance Item Name | Collection Unit | Collection Cycle | Description |
|---|---|---|---|---|
| Direct Connect | Network In Bytes | bytes | 5m | Cumulative traffic from Direct Connect to VPC |
| Direct Connect | Network In Bytes [Delta] | bytes | 5m | Cumulative traffic from Direct Connect to VPC over 5 minutes ※ Average traffic bps conversion formula: cumulative traffic (bytes) / 300 (seconds) * 8 (bits) |
| Direct Connect | Network Out Bytes | bytes | 5m | Cumulative traffic from VPC to Direct Connect |
| Direct Connect | Network Out Bytes [Delta] | bytes | 5m | Cumulative traffic from VPC to Direct Connect over 5 minutes ※ Average traffic bps conversion formula: cumulative traffic (bytes) / 300 (seconds) * 8 (bits) |
Table. Direct Connect performance items
Load Balancer
| Performance Item Group Name | Performance Item Name | Collection Unit | Collection Cycle | Description |
|---|---|---|---|---|
| State | Instance State | state | 5m | LB status |
| Load Balancer | Current Connection | cnt | 5m | Current number of connections |
| Load Balancer | Total L4 Connection | cnt | 5m | Total number of L4 connections |
| Load Balancer | Total L7 Connection | cnt | 5m | Total number of L7 connections |
| Load Balancer | Total TCP Connection | cnt | 5m | Total number of TCP connections |
| Load Balancer | Total Connection | cnt | 5m | Total number of connections |
| Load Balancer | Bytes processed in forward direction | bytes | 5m | Forward network bytes |
| Load Balancer | Packets processed in forward direction | cnt | 5m | Forward network packets |
| Load Balancer | Bytes processed in reverse direction | bytes | 5m | Reverse network bytes |
| Load Balancer | Packets processed in reverse direction | cnt | 5m | Reverse network packets |
| Load Balancer | Total failure actions | cnt | 5m | Total number of failure actions |
| Load Balancer | Current Request | cnt | 5m | Current number of requests |
| Load Balancer | Current response | cnt | 5m | Current number of responses |
| Load Balancer | Total Request | cnt | 5m | Total number of requests |
| Load Balancer | Total Request Success | cnt | 5m | Total number of successful requests |
| Load Balancer | Peak Connection | cnt | 5m | Peak number of connections |
| Load Balancer | Current Connection Rate | % | 5m | Current SSL connection rate |
| Load Balancer | Last response time | ms | 5m | Last response time |
| Load Balancer | Fastest response time | ms | 5m | Fastest response time |
| Load Balancer | Slowest response time | ms | 5m | Slowest response time |
| Load Balancer | Current SSL Connection | cnt | 5m | Current number of SSL connections |
| Load Balancer | Total SSL Connection | cnt | 5m | Total number of SSL connections |
Table. Load Balancer performance items
Load Balancer Listener
| Performance Item Group Name | Performance Item Name | Collection Unit | Collection Cycle | Description |
|---|---|---|---|---|
| State | Instance State | state | 5m | LB status |
| Load Balancer | Current Connection | cnt | 5m | Current number of connections |
| Load Balancer | Total L4 Connection | cnt | 5m | Total number of L4 connections |
| Load Balancer | Total L7 Connection | cnt | 5m | Total number of L7 connections |
| Load Balancer | Total TCP Connection | cnt | 5m | Total number of TCP connections |
| Load Balancer | Total Connection | cnt | 5m | Total number of connections |
| Load Balancer | Bytes processed in forward direction | bytes | 5m | Forward network bytes |
| Load Balancer | Packets processed in forward direction | cnt | 5m | Forward network packets |
| Load Balancer | Bytes processed in reverse direction | bytes | 5m | Reverse network bytes |
| Load Balancer | Packets processed in reverse direction | cnt | 5m | Reverse network packets |
| Load Balancer | Total failure actions | cnt | 5m | Total number of failure actions |
| Load Balancer | Current Request | cnt | 5m | Current number of requests |
| Load Balancer | Current response | cnt | 5m | Current number of responses |
| Load Balancer | Total Request | cnt | 5m | Total number of requests |
| Load Balancer | Total Request Success | cnt | 5m | Total number of successful requests |
| Load Balancer | Peak Connection | cnt | 5m | Peak number of connections |
| Load Balancer | Current Connection Rate | % | 5m | Current SSL connection rate |
| Load Balancer | Last response time | ms | 5m | Last response time |
| Load Balancer | Fastest response time | ms | 5m | Fastest response time |
| Load Balancer | Slowest response time | ms | 5m | Slowest response time |
| Load Balancer | Current SSL Connection | cnt | 5m | Current number of SSL connections |
| Load Balancer | Total SSL Connection | cnt | 5m | Total number of SSL connections |
Table. Load Balancer Listener performance items
Load Balancer Server Group
| Performance Item Group Name | Performance Item Name | Collection Unit | Collection Cycle | Description |
|---|---|---|---|---|
| Server Group | Instance State | state | 5m | LB Server Group status |
| Server Group | Peak Connection | cnt | 5m | Server group peak number of connections |
| Server Group | Healthy host | cnt | 5m | Server group number of healthy hosts |
| Server Group | Unhealthy host | cnt | 5m | Server group number of unhealthy hosts |
| Server Group | Request Count | cnt | 5m | Number of requests |
| Server Group | Response Count | cnt | 5m | Number of responses |
| Server Group | 2xx Response Count | cnt | 5m | Number of 2xx responses |
| Server Group | 3xx Response Count | cnt | 5m | Number of 3xx responses |
| Server Group | 4xx Response Count | cnt | 5m | Number of 4xx responses |
| Server Group | 5xx Response Count | cnt | 5m | Number of 5xx responses |
Table. Load Balancer Server Group performance items
3.2.9 - Appendix C. Service-specific status check
Compute type
Virtual Server
| Performance Item Name | Description | Value |
|---|---|---|
| Instance State [Basic] | Instance Status | NOSTATE, RUNNING, BLOCKED, PAUSED, SHUTDOWN, SHUTOFF, CRASHED, PMSUSPENDED, LAST |
Fig. Virtual Server Status Check
GPU Server
| Performance Item Name | Description | Value |
|---|---|---|
| Instance State [Basic] | Instance Status | NOSTATE RUNNING, BLOCKED, PAUSED, SHUTDOWN, SHUTOFF, CRASHED, PMSUSPENDED, LAST |
Fig. GPU Server Status Check
Bare Metal Server
| Performance Item Name | Description | Value |
|---|---|---|
| N/A | N/A | N/A |
Fig. Bare Metal Server Status Check
Caution
Bare Metal Server does not provide status information through Cloud Monitoring.
Multi-node GPU Cluster [Cluster Fabric]
| Performance Item Name | Description | Value |
|---|---|---|
| N/A | N/A | N/A |
Fig. Multi-node GPU Cluster [Cluster Fabric] status check
Caution
Multi-node GPU Cluster [Cluster Fabric] does not provide status information through Cloud Monitoring.
Multi-node GPU Cluster [Node]
| Performance Item Name | Description | Value |
|---|---|---|
| N/A | N/A | N/A |
Fig. Multi-node GPU Cluster [Node] Status Check
Caution
Multi-node GPU Cluster [Node] does not provide status information through Cloud Monitoring.
Storage type
File Storage
| Performance Item Name | Description | Value |
|---|---|---|
| Instance State | File Storage volume status | * 1: Online in case * 0: other status values (Offline) |
Fig. File Storage status check
Object Storage
| Performance Item Name | Description | Value |
|---|---|---|
| N/A | N/A | N/A |
Table. Object Storage status check
Caution
Object Storage does not provide status information through Cloud Monitoring.
Block Storage(BM)
| Performance Item Name | Description | Value |
|---|---|---|
| Instance State | Blockstorage Volume Status | * 1: running (normal) * 0: down (abnormal) |
Fig. Block Storage(BM) Status Check
Block Storage(VM)
| Performance Item Name | Description | Value |
|---|---|---|
| Instance State | Blockstorage volume status | * 1: running (normal) * 0: down (abnormal) |
Table. Block Storage(VM) Status Check
Database type
PostgreSQL(DBaaS)
| Performance Item Name | Description | Value |
|---|---|---|
| Instance State [PID] | postgres process PID | * PID: when the postgres process exists * -1: when the process does not exist |
Fig. PostgreSQL(DBaaS) Status Check
MariaDB(DBaaS)
| Performance Item Name | Description | Value |
|---|---|---|
| Safe PID | mariadb_safe process PID | * PID: when the mariadb_safe process exists * -1: when the process does not exist |
| Instance State [PID] | mariadb process PID | * PID: when the mariadb process exists * -1: when the process does not exist |
Fig. MariaDB(DBaaS) Status Check
MySQL(DBaaS)
| Performance Item Name | Description | Value |
|---|---|---|
| Instance State [PID] | mysqld process PID | * PID: when the mysqld process exists * -1: when the process does not exist |
Fig. MySQL(DBaaS) Status Check
Microsoft SQL Server(DBaaS)
| Performance Item Name | Description | Value |
|---|---|---|
| Instance State [Cluster] | MSSQL cluster configuration status | * PID: when the mssql process exists * -1: when the process does not exist |
| Instance State [PID] | sqlservr.exe process pid | * For Microsoft SQL Server, the secondary server is also running with PID, so it’s impossible to check the status with only PID |
Fig. Microsoft SQL Server(DBaaS) status check
EPAS(DBaaS)
| Performance Item Name | Description | Value |
|---|---|---|
| Instance State [PID] | Postgres process PID | * PID: When the postgres process exists * -1: When the process does not exist |
Fig. EPAS(DBaaS) Status Check
CacheStore(DBaaS)
Redis
| Performance Item Name | Description | Value |
|---|---|---|
| Instance State [PID] | Redis-server process PID | * -1: in case the process does not exist |
| Sentinel State [PID] | Sentinel process PID | * -1: in case the process does not exist |
Fig. Redis Status Check
Valkey
| Performance Item Name | Description | Value |
|---|---|---|
| Instance State [PID] | Valkey-server process PID | * -1: in case the process does not exist |
| Sentinel State [PID] | Sentinel process PID | * -1: in case the process does not exist |
Table. Valkey Status Check
Data Analytics type
Event Streams
| Performance Item Name | Description | Value |
|---|---|---|
| AKHQ State [PID] | akhq process PID | * PID: akhq process exists * -1: process does not exist |
| Instance State [PID] | kafka process PID | * PID: when the kafka process exists * -1: when the process does not exist |
| Zookeeper State [Pid] | zookeeper process PID | * PID: when the zookeeper process exists * -1: when the process does not exist |
Fig. Event Streams Status Check
Search Engine
| Performance Item Name | Description | Value |
|---|---|---|
| Instance State [PID] | Elasticsearch process PID | * PID: When the Elasticsearch process exists * -1: When the process does not exist |
| Kibana State [PID] | Kibana process PID | * PID: When the Kibana process exists * -1: When the process does not exist |
Fig. Search Engine Status Check
Elasticsearch
| Performance Item Name | Description | Value |
|---|---|---|
| Instance State [PID] | Elasticsearch process PID | * -1: in case the process does not exist |
| Kibana State [PID] | Dashboard process PID | * -1: in case the process does not exist |
Fig. Elasticsearch Status Check
Opensearch
| Performance Item Name | Description | Value |
|---|---|---|
| Instance State [PID] | Opensearch process PID | * -1: in case the process does not exist |
| Dashboard State [PID] | Dashboard process PID | * -1: in case the process does not exist |
Table. Opensearch status check
Vertica(DBaaS)
| Performance Item Name | Description | Value |
|---|---|---|
| Instance State [PID] | Vertica Process PID | * -1: when the process does not exist |
Fig. Vertica(DBaaS) status check
Container type
Kubernetes Engine
| Performance Item Name | Description | Value |
|---|---|---|
| Instance State | Cluster Status | * 1: Status check query sum(up{job=“kubernetes-apiservers”}) returns a value greater than 0 * 0: Status check query sum(up{job=“kubernetes-apiservers”}) returns a value less than or equal to 0 |
Fig. Kubernetes Engine status check
Container Registry
| Performance Item Name | Description | Value |
|---|---|---|
| Instance State | Container Registry Status | * 1: running (normal) * 0: down (abnormal) |
Fig. Container Registry Status Check
Networking type
Internet Gateway
| Performance Item Name | Description | Value |
|---|---|---|
| N/A | N/A | N/A |
Fig. Internet Gateway Status Check
Caution
Internet Gateway does not provide status information through Cloud Monitoring.
Load Balancer(OLD)
| Performance Item Name | Description | Value |
|---|---|---|
| Instance State | Load Balancer status | Determined by provisioning_status in API call result |
- 1: ACTIVE
- 0: ETC|
Fig. Load Balancer(OLD)
Load Balancer Listener(OLD)
| Performance Item Name | Description | Value |
|---|---|---|
| Instance State | Load Balancer Listener status | Determined by provisioning_status in API call results * 1: ACTIVE * 0: ETC |
Fig. Load Balancer Listener(OLD)
Load Balancer
| Performance Item Name | Description | Value |
|---|---|---|
| Instance State | Load Balancer status | Determined by provisioning_status in API call result |
- 1: ACTIVE
- 0: ETC|
Fig. Load Balancer
Load Balancer Listener
| Performance Item Name | Description | Value |
|---|---|---|
| Instance State | Load Balancer Listener status, determined by provisioning_status in API call results * 1: ACTIVE * 0: ETC |
Fig. Load Balancer Listener
Load Balancer Server Group
| Performance Item Name | Description | Value |
|---|---|---|
| Instance State | Status of Load Balancer Server Group, determined by provisioning_status in API call results * 1: ACTIVE * 0: ETC |
Fig. Load Balancer Server Group
Direct Connect
| Performance Item Name | Description | Value |
|---|---|---|
| N/A | N/A | N/A |
Fig. Direct Connect Status Check
Caution
Direct Connect does not provide status information through Cloud Monitoring.
Cloud WAN
| Performance Item Name | Description | Value |
|---|---|---|
| Instance State | Attachment connection status | * 0: down * 1: up * 2: testing * 3: unknown |
Fig. Cloud WAN Status Check
Global CDN
| Performance Item Name | Description | Value |
|---|---|---|
| Instance State | Global CDN Status | * 1: running (normal) * 0: down (abnormal) |
Fig. Global CDN Status Check
3.3 - API Reference
API Reference
3.4 - Release Note
Cloud Monitoring
2025.07.01
FEATURE
Cloud Monitoring Integration Service Added- In July 2025, a linked service with Cloud Monitoring was added.
- Additional linked services: Compute(Multi-node GPU Cluster [Cluster Fabric], Multi-node GPU Cluster [Node]), Storage(Block Storage(BM), Block Storage(VM)), Networking(Cloud WAN, Global CDN), Database(Valkey), Data Analytics(Opensearch, Vertica(DBaaS))
2025.02.27
FEATURE
Cloud Monitoring Integration Service Added- In February 2025, a linked service with Cloud Monitoring was added.
- Additional linked services: Container(Container Registry), Database(EPAS, Microsoft SQL Server), Data Analytics(Event Streams, Search Engine), Networking(Load Balancer, Load Balancer Listener, Load Balancer Server Group, VPN)
2024.10.01
NEW
Cloud Monitoring Service Official Version Release- Cloud Monitoring service has been released. It collects usage and change information of operating infrastructure resources, and supports a stable cloud operating environment through event occurrence/notification when exceeding the set threshold.
4 - IAM
4.1 - Overview
Service Overview
IAM (Identity and Access Management) is a service that controls the accessible range of services and resources by verifying the identity of registered users on the Samsung Cloud Platform and granting access rights. Administrators can create and manage user, permission group, policy, and role items in detail through IAM.
The user can create a new user if they are a Root user or a user who has been granted user registration authority from the Root user. Policies cannot be directly granted to users, but by adding users to a user group and linking policies to that user group, specific users can be granted access or management rights to resources. In other words, the tasks that can be performed within an Account vary depending on which user group the user belongs to and which policies are linked to that user group.
Provided Features
IAM provides the following features.
- User Authentication: Provides multi-factor authentication (MFA) when accessing the console and API, and also blocks unauthorized access by only allowing access from permitted IP ranges.
- Access Control: Users are added to user groups based on their tasks to limit their access rights to the parts necessary for their tasks. Administrators can manage and grant custom policies.
- Role Management: You can switch to another role from your account to access the Account.
- Credential Provider Supplied: It can be accessed and used in the Console Account through the credential provider.
- Access Control Policy Management: Creates access control policies for each service, including control/action/resource type and authentication method/IP. This enables the application of the principle of least privilege when granting access rights to cloud resources, allowing for access control based on user.
Component
The user can create and manage user groups, users, and policies through Identity and Access Management(IAM).
User Group
In the user group, you can register users and add policies. You can register users by forming a user group suitable for each task, and grant and manage the same authority to users by linking a policy suitable for the task.
User
The administrator can create users and add them to user groups. The administrator can automatically generate or directly create a user’s password and provide account access information to the user.
User Policy
You can create policies for services provided. Authority management is possible according to control type, applied resources, and authentication type.
Role
It is fictional user information with separate permissions, and is not affected by the permissions of the original user account.
Preceding service
Identity and Access Management(IAM) has no preceding service.
4.2 - How-to Guides
Users can create and manage user groups, users, policies, and My Info. through Identity and Access Management (IAM).
Getting Started with IAM
- Click on the All Services > Management > IAM menu. This will take you to the Service Home page of IAM.
- On the Service Home page, My Info., Account information, Quick Link, and IAM status are provided as widgets.
| Category | Detailed Description |
|---|---|
| My Info. | The username, email, and user group information of the user logged in to the Samsung Cloud Platform Console. Clicking the More button will take you to the My Info. page |
| Account Information | Provides the user’s Account ID, Account alias, and IAM user login URL if the user is an IAM user
|
| Quick Link | Description of My Info. and a button to click to go to the corresponding page.
|
| IAM Status | The number of user groups, users, and policies |
Table. IAM Service Home Widget Items
Editing Account Alias
You can edit the Account alias in the Service Home > Account widget of IAM.
- Click on the All Services > Management > IAM menu. This will take you to the Service Home page of IAM.
- On the Service Home page, click the Edit button for the Account alias in the Account widget. This will take you to the Edit Account Alias popup window.
- In the Edit Account Alias popup window, confirm the instructions and edit the Account alias, then click the OK button.NoteWhen editing the Account alias, the current alias can no longer be used for Console login URL.
After editing, if the alias is not used in another Account, you can use the previous alias again.
Deleting Account Alias
You can delete the Account alias in the Service Home > Account widget of IAM.
- Click on the All Services > Management > IAM menu. This will take you to the Service Home page of IAM.
- On the Service Home page, click the Delete button for the Account alias in the Account widget. This will take you to the Delete Account Alias popup window.
- In the Delete Account Alias popup window, confirm the instructions and click the OK button.Warning
Deleting the Account alias will prevent IAM users from logging in using the Account alias.
- The IAM login URL will also be unavailable.
4.2.1 - User Group
The user can enter the essential information of the user group and select detailed options through the Samsung Cloud Platform Console to create the corresponding service.
Create a user group
To create a user group, follow the following procedure.
- All services > Management > IAM menu is clicked. It moves to the Service Home page of Identity and Access Management(IAM).
- Service Home page, click the User Group menu. It moves to the User Group List page.
- User Group List page, click the Create User Group button. It moves to the Create User Group page.
- Basic Information Input, Add User, Policy Link, Additional Information Input area, please enter the necessary information.
Classification NecessityDetailed Description User Group Name Required Enter User Group Name - Use a value between 3 and 24 characters using Korean, English, numbers, and special characters (
+=,.@-_) to input
Description Select Description of the user group name - A detailed description of the user group name, up to 1,000 characters can be entered
User Select User to add to the user group - The list of users registered in the account is retrieved, and when the check box is selected, the user name of the selected user is displayed at the top of the screen
- By clicking the X button for each user at the top of the screen or unchecking the check box in the user list, the selection of the selected user is canceled
- If there are no users to add, click Create User at the bottom of the user list to proceed with new user registration first
- After user creation is complete, the user list is refreshed, and when the user is retrieved, user selection is possible
- For more information on creating a user group, see Create User
Policy Select Policy to be linked to the user group - The list of policies registered in Account is retrieved, and if the check box is selected, the policy name of the selected policy is displayed at the top of the screen
- At the top of the screen, you can cancel the selection of the policy by clicking the X button for each policy or unchecking the check box in the policy list
- If there is no policy to be linked, click Policy Creation at the bottom of the policy list to proceed with new policy registration first
- After policy creation is complete, the policy list is refreshed, and if the policy is retrieved, policy selection is possible
- For more information on policy creation, refer to Creating a Policy
Tag Selection Tags to add to the user group - Up to 50 tags can be added per resource
Table. Input Items for Creating User Group Information - Use a value between 3 and 24 characters using Korean, English, numbers, and special characters (
- Complete button click. Move to the User Group List page.
Check user group detailed information
In the user group, you can check and modify the user group list and detailed information. The User Group Details page consists of Basic Information, Users, Policies, Tags tabs.
To check the detailed information of the user group service, follow the following procedure.
- All services > Management > IAM menu, click. It moves to the Service Home page of Identity and Access Management(IAM).
- Service Home page, click the User Group menu. It moves to the User Group List page.
- User Group List page, click the user group name to check the detailed information. It moves to the User Group Details page.
- User Group Details page displays basic information, and consists of Basic Information, User, Policy, Tag tabs.
Basic Information
User Group List page where you can check the basic information of the selected user group, and modify the user group name and description if necessary.
| Classification | Detailed Description |
|---|---|
| Service | Service Name |
| Resource Type | Resource Type |
| SRN | Unique resource ID in Samsung Cloud Platform |
| Resource Name | Resource Name
|
| Resource ID | Unique Resource ID |
| Creator | The user who created the service |
| Creation Time | The time when the service was created |
| Editor | User who modified the service information |
| Revision Time | Time when service information was revised |
| User Group Name | The name of the user group |
| Description | A description of the user group name |
Table. Basic information tab items of user group
User
User Group List page where you can check the users included in the selected user group, and add or delete users as needed.
- User for more information about the user, please refer to User
| Classification | Detailed Description |
|---|---|
| Exclusion | Exclude users from the user group
|
| Add User | Add another user to the user group
|
| User Name | User’s Name |
| User Group | Number of user groups the user belongs to
|
| Creation Time | The time when the user was created |
Table. User Group Details - User Tab Items
Policy
User Group List page where you can check the policy linking information of the selected user group and modify the policy linking information for the user group if necessary.
- Policy details can be found in the policy guide.
Classification Detailed Description Release Connection Release the connection of the selected policy - Activated when a policy is selected from the policy list
- For more information, refer to Releasing Policy Connection
Policy Connection Connect a new policy to a user group - When the button is clicked, it moves to the Policy Connection page
- For more information, refer to Connecting Policy
policy name the name of the policy Policy Type Type of connected policy - Basic: basic policy provided by Samsung Cloud Platform
- Custom: policy created directly by the user
Description Description of the policy Creation Time The time when the policy was created Revision Time Time when the policy was revised Table. User Group Details - Policy Tab Items
Tag
User Group List page where you can check the tag information of the selected user group, and add, change or delete it.
| Classification | Detailed Description |
|---|---|
| Tag List | Tag list
|
Table. User Group Tag Tab Items
Managing User Groups
You can change the name of the user group, add users, attach policies, or modify tags. If management of the user group is required, you can perform tasks from the user group list or user group details page.
Modify basic information
You can modify the name and description of the user group. To modify the name and description of a user group, follow the following procedure.
- All services > Management > IAM menu is clicked. It moves to the Service Home page of Identity and Access Management(IAM).
- Service Home page, click the User Group menu. It moves to the User Group List page.
- User Group List page, click the user group name to modify the basic information. It moves to the User Group Details page.
- User Group Details page, check the basic information to be modified, and then click the Modify button.
- User Group Name: You can change the user group name. When the Edit button is clicked, the Edit User Group Name popup window opens.
- Description: you can modify the description of the user group. when the Modify button is clicked, the Description Modification popup window opens.
- In the popup window, modify it to the content to be changed, then click the Confirm button.
Managing Users
You can add or remove users from the user group.
Add User
To add a user to a user group, follow the following procedure.
- All services > Management > IAM menu is clicked. It moves to the Service Home page of Identity and Access Management(IAM).
- Service Home page, click the User Group menu. It moves to the User Group List page.
- User Group List page, click the user group name to add a user. It moves to the User Group Details page.
- User Group Details page, click the User tab. It moves to the User tab.
- User tab, click the Add User button, and move to the Add User page.
- Add User page’s User list, select the user you want to add, then click the Complete button. A popup window announcing the addition of the user will open.
| Classification | Detailed Description |
|---|---|
| Added user | Display users included in the user group |
| User | Select a user to add to the user group from the list of users registered in the Account
|
Table. Additional User Details
- In the popup window notifying user addition, click the Confirm button. You can check the added user in the list of the User tab.
Excluding Users
To exclude a user from a user group, follow the following procedure.
- All services > Management > IAM menu is clicked. It moves to the Service Home page of Identity and Access Management(IAM).
- Service Home page, click the User Group menu. It moves to the User Group List page.
- User Group List page, click the user group name to exclude the user. It moves to the User Group Details page.
- User Group Details page, click the User tab. It moves to the User tab.
- User tab, select the user to be excluded from the list of users to be retrieved, and click the Exclude User button.
- The selected user is excluded and the user list is newly retrieved.
Managing Policies
You can attach a policy to a user group or detach an attached policy.
Connect Policy
To link a policy to a user group, follow these procedures.
- All services > Management > IAM menu is clicked. It moves to the Service Home page of Identity and Access Management(IAM).
- Service Home page, click the User Group menu. It moves to the User Group List page.
- User Group List page, click the user group name to link the policy, it moves to the User Group Details page.
- User Group Details page, click the Policy tab. It moves to the Policy tab.
- Policy tab, click the Policy Link button. It moves to the Policy Link page.
- Select the policy to link to the user group, then click the Complete button. A popup window announcing the policy connection will open.
| Classification | Detailed Description |
|---|---|
| Connected Policy | Displays policies directly connected to the user group |
| Policy | Select a policy to be linked to the user group from the list of policies registered in the Account
|
Table. Policy Link Details
- Click the Confirm button in the pop-up window notifying policy connection. You can check the connected policy in the list of the Policy tab.
Policy Disconnection
To detach a policy from a user group, follow the following procedure.
- All services > Management > IAM menu, click. It moves to the Service Home page of Identity and Access Management(IAM).
- Service Home page, click the User Group menu. It moves to the User Group List page.
- User Group List page, click the user group name to detach the policy link, it moves to the User Group Details page.
- User Group Details page, click the Policy tab. It moves to the Policy tab.
- Policy tab where you can select the policy to be disconnected from the list of policies and click the Disconnect button.
- The selected policy will be disconnected and the policy list will be retrieved again.
Managing tags
You can modify the tags of the user group. To modify tags in the user group, follow the following procedure.
- All services > Management > IAM menu, click. It moves to the Service Home page of Identity and Access Management(IAM).
- Service Home 페이지에서 User Group 메뉴를 클릭하세요. User Group List 페이지로 이동합니다.
- User Group List page, click the user group name to modify the tag information. It moves to the User Group Details page.
- User Group Details page, click the Tags tab. It moves to the Tags tab.
- Tag tab, click the Edit Tag button.
- After adding or modifying the tag, click the Save button. A popup window announcing the tag modification will open.
- You can modify the Key, Value of the previously registered tag.
- Add tag button to click to add a new tag.
- Clicking the X button in front of the added tag will delete the tag.
- Confirm button should be clicked. You can check the modified tag information from the list.
Delete user group
To delete a user group, follow the following procedure.
- All services > Management > IAM menu, click. It moves to the Service Home page of Identity and Access Management(IAM).
- Service Home page, click the User Group menu. It moves to the User Group List page.
- User Group List page, click the user group name to be deleted, it moves to the User Group Details page.
- User Group Details page, click the Delete User Group button.
- The user group is deleted, and it moves to the User Group List page.
To delete multiple user groups simultaneously, follow the procedure below.
- All services > Management > IAM menu is clicked. It moves to the Service Home page of Identity and Access Management(IAM).
- Service Home page, click the User Group menu. It moves to the User Group List page.
- Check the user groups to be deleted from the user group list.
- Confirm the selected user groups, and click the delete button.
- The selected user groups are deleted and the User Group List page is refreshed.
4.2.2 - User
The user can enter the required information of the policy and select detailed options through the Samsung Cloud Platform Console to create the corresponding service.
Create User
To create a user, follow the following procedure.
- All services > Management > IAM menu, click. It moves to the Service Home page of Identity and Access Management(IAM).
- Service Home page, click the User menu. It moves to the User List page.
- User List page, click the Create User button. It moves to the Create User page.
- User Creation page’s Basic Information Input, Authority Setting, Additional Information Input area, enter the necessary information, then click the Complete button. A pop-up window announcing user creation will open.
| Classification | Necessity | Detailed Description |
|---|---|---|
| username | required | user’s name
|
| Description | Select | Description of the username
|
| Password | Required | The method of creating a password for the user to use is two-fold.
|
| Password change setting | Selection | Password change setting when user logs in for the first time
|
| Add to user group | Select | Select a user group to include users from the list of user groups registered in the account
|
| Policy Direct Connection | Select | Select a policy to directly connect to the user from the list of policies registered in the Account
|
| Tag | Selection | Tags to add to the user group
|
Table. User-generated information input items
| Classification | Detailed Description |
|---|---|
| Account ID | Account ID value |
| User Name | Created User Name |
| password | the password of the authenticated user
|
| IAM user login URL | IAM user’s login URL information |
| Excel Download | Download IAM user login information as an Excel file |
| Email transmission | An Excel file containing IAM user login information is sent via email
|
Table. IAM user login information items
Password Creation Rules
- Uppercase letters (English), lowercase letters (English), numbers, special characters (
!@#$%&*^) must each be included at least once. - The length is 9~20 characters.
- ID or username cannot be used as a password.
- The same character cannot be used three times or more.
- Easily guessable passwords cannot be used.
- Recently used passwords cannot be used.
- 4 characters or more of consecutive characters/numbers cannot be used.
- The password change cycle is 90 days.
Check user details
In the user section, users can check and modify the user list and detailed information. The User Details page consists of Basic Information, User Group, Tags tabs.
To check the detailed information of the user service, please follow the following procedure.
- All services > Management > IAM menu is clicked. It moves to the Service Home page of Identity and Access Management(IAM).
- Service Home page, click the User menu. It moves to the User List page.
- User List page, click the username to check the detailed information. It moves to the User Details page.
- User Details page displays basic information, and consists of Basic Info, User, Policy, Tags tabs.
Basic Information
User List page where you can check the basic information of the selected user, and if necessary, modify the user’s description and options.
| Classification | Detailed Description |
|---|---|
| Service | Service Name |
| Resource Type | Resource Type |
| SRN | Unique resource ID in Samsung Cloud Platform |
| Resource Name | Resource Name
|
| Resource ID | Unique Resource ID |
| Creator | The user who created the service |
| Creation Time | The time when the service was created |
| Editor | User who modified the service information |
| Revision Time | Time when service information was revised |
| User Name | The user’s name |
| Last Login | The time when the user last logged in |
| Description | A description of the username |
| Password | The last time the password was changed
|
| Password Reuse Restriction | Restricts the reuse of recently used passwords
|
| Email Verification Status | |
| Mobile Phone Number | Mobile Phone Number Authentication Status |
Table. User Details - Basic Information Tab Items
User Group
User List page, you can check the user group registered to the selected user and add or exclude the user group if necessary.
- User Group details can be found in User Group please refer to it.
| Classification | Detailed Description |
|---|---|
| Exclusion | Exclude the user from the user group
|
| Add User Group | Add users to another user group
|
| User Group Name | Name of the User Group |
| Connected Policies | Number of policies connected to the user group
|
| Description | Description of the user group |
| Revision Time | Time when the user group was revised |
Table. User Details - User Group Tab Items
Policy
User List page where you can check the policy information of the selected user, and add, change or delete it.
| Classification | Detailed Description |
|---|---|
| Release Connection | Release the connection of the selected policy
|
| View more | You can remove the direct connection or exclude from the user group
|
| Policy Connection | Connect a new policy to the user
|
| Policy Name | Policy’s Name
|
| Type | Type of Policy |
| Description | Description of the policy |
| Connection Method | Policy Connection Method
|
| Revision Time | The time when the policy was last revised |
Table. User Details - Policy Tab Items
Tag
User List page where you can check the tag information of the selected user, and add, change or delete it.
| Classification | Detailed Description |
|---|---|
| Tag List | Tag list
|
Table. User Details - Tags Tab Items
Managing Users
You can change the user’s basic information, add a user group, or modify tags. If management of the user is required, you can perform tasks from the user list or user details page.
Modify basic information
You can modify the user’s basic information.
Caution
The username cannot be modified.
Modify the description
To modify the user’s description, follow the following procedure.
- All services > Management > IAM menu is clicked. It moves to the Service Home page of Identity and Access Management(IAM).
- Service Home page, click the User menu. It moves to the User List page.
- User List page, click the username to modify the description, it will move to the User Details page.
- User Details page where you check the description, and click the Edit description button. Edit Description popup window opens.
- Description Modification In the popup window, change the description content and then click the Confirm button.
Modify password
To modify the user’s password, follow the following procedure.
- All services > Management > IAM menu is clicked. It moves to the Service Home page of Identity and Access Management(IAM).
- Service Home page, click the User menu. It moves to the User List page.
- User List page, click the username to modify the password. It moves to the User Details page.
- User Details page, click the Modify password button. Password Reset popup window opens.
- After modifying the password, click the Confirm button. The IAM User Login Information popup window will open.
- Password has the following 2 settings.
- Auto Generation: A random password will be generated.
- Direct Input: It will be created with the password directly entered by the user. It must include at least one of each: uppercase letters (English), lowercase letters (English), numbers, and special characters (
!@#$%&*^). Please refer to the password creation rules. - Password change settings: It is recommended to change the password when logging in for the first time after resetting the password.
Password Creation Rules
- Uppercase letters (English), lowercase letters (English), numbers, special characters (
!@#$%&*^) must each be included at least once. - The length is 9~20 characters.
- ID or username cannot be used as a password.
- The same character cannot be used three times or more.
- Easily guessable passwords cannot be used.
- Recently used passwords cannot be used.
- 4 characters or more of consecutive characters/numbers cannot be used.
- The password change cycle is 90 days.
- After checking the user-generated information, click the Confirm button. The password change will be completed.
Classification Detailed Description Account ID Account ID value User Name Created User Name password password of the authenticated user - view icon to check the password
IAM user login URL IAM user’s login URL information Excel Download Download IAM user login information as an Excel file Email transmission An Excel file containing IAM user login information is sent via email - After clicking the button, enter the email address to receive the email
Table. IAM user login information items
Restricting password reuse
Specifies the number of password history to check so that recently used passwords cannot be reused. To limit the reuse of a user’s password, follow the following procedure.
- All services > Management > IAM menu is clicked. It moves to the Service Home page of Identity and Access Management(IAM).
- Service Home page, click the User menu. It moves to the User List page.
- User List page, click the username to modify the password reuse restriction, it will move to the User Details page.
- User Details page, click the Modify button to restrict password reuse. The Modify Password Reuse Restriction popup window will open.
- Password Reuse Restriction: Select the number of recent password history records to be used, as a number between 1 and 24.
- Confirmation button should be clicked. Password reuse restriction count change can be confirmed.
User Group Management
You can add or remove users from a user group.
Add User Group
To add a user to a user group, follow the following procedure.
- All services > Management > IAM menu is clicked. It moves to the Service Home page of Identity and Access Management(IAM).
- Service Home page, click the User menu. It moves to the User List page.
- User List page, click the username to add to the user group. It moves to the User Details page.
- User Details page, click the User Group tab. It moves to the User Group tab.
- User Group tab, click the Add User Group button. It moves to the Add User Group page.
- Add User Group page’s User Group list, select the user group you want to add, then click the Complete button. A pop-up window announcing the addition of the user group will open.
| Classification | Detailed Description |
|---|---|
| Added user group | Display user groups that the user is included in |
| Add to user group | Select a user group to add users from the list of user groups registered in the Account
|
Table. Add User Group Detailed Items
- Click the Confirm button in the popup window notifying the addition of a user group. The added user group can be confirmed in the list of the User Group tab.
Excluding User Groups
To exclude a user from a user group, follow the following procedure.
- All services > Management > IAM menu is clicked. It moves to the Service Home page of Identity and Access Management(IAM).
- Service Home page, click the User menu. It moves to the User List page.
- User List page, click on the user name to be excluded from the user group. It moves to the User Details page.
- User Details page, click the User Group tab. It moves to the User Group tab.
- User Group tab, select the user group to be excluded from the list of user groups to be retrieved, and click the Exclude User Group button.
- The selected user group is excluded and the user group list is newly retrieved.
Managing Policies
You can link a policy to the user or unlink a linked policy.
Connect Policy
You can include the user in a user group to link policies or link directly to policies.
To link a policy to a user, follow the next procedure.
All services > Management > IAM menu is clicked. It moves to the Service Home page of Identity and Access Management(IAM).
Service Home page, click the User menu. It moves to the User List page.
User List page, click the username to link the policy. It moves to the User Details page.
User Details page, click the Policy tab. It moves to the Policy tab.
Policy tab, click the Policy Link button. It moves to the Policy Link page.
Select the user group and policy to connect to the user, then click the Complete button. A popup window announcing the policy connection will open.
Classification Detailed Description Added user group Displays the user group that the user is included in Add to user group Select a user group connected to the policy being used from the list of user groups registered in the Account - When you select a check box, the name of the selected user group is displayed at the top of the list
- You can cancel the selected user group by clicking the X button for the added user group name at the top of the list or by unchecking the check box in the user group list
- If the desired user group is not available, you can click the Create User Group item at the bottom of the user group list to register a new user group first
- After creating a user group, you can refresh the user group list and select the created user group
- For more information on creating a user group, see Creating a User Group
Directly Linked Policies Display policies directly linked to the user Policy Direct Connection Select a policy to directly connect to the user from the list of policies registered in the Account - If you select the check box, the selected policy name will be displayed at the top of the list
- The selected policy can be canceled by clicking the X button at the top of the list or by unchecking the check box in the policy list
- If there is no policy to connect, click the Create Policy item at the bottom of the policy list to register a new policy first
- After policy creation is complete, you can refresh the policy list and select the created policy
- For more information on policy creation, see Create Policy
Table. Policy Link DetailsClick the Confirm button in the pop-up window notifying policy connection. You can check the connected policy in the list of the Policy tab.
Policy Disconnection
You can release the policies connected to the user.
To release the policy linked to the user, follow the following procedure.
- All services > Management > IAM menu is clicked. It moves to the Service Home page of Identity and Access Management(IAM).
- Service Home page, click the User menu. It moves to the User List page.
- User List page, click the username to detach the policy link, it will move to the User Details page.
- User Details page, click the Policy tab. It moves to the Policy tab.
- Policy list, select the policy to disconnect, then click the Disconnect button. A pop-up window notifying disconnection will open.
- More button is clicked, then you can either disable the directly connected policy or exclude only the user group that the user is included in.
- After checking the policy information to be disconnected, click the Confirm button. The policy will be disconnected.
Guide
Policies linked to a user group can be unlinked by excluding the user from the group. If a user is excluded from a user group, policies linked only through that group will have all links removed.
Managing tags
You can modify the user’s tag. To modify tags from the user, follow the following procedure.
- All services > Management > IAM menu, click. It moves to the Service Home page of Identity and Access Management(IAM).
- Service Home page, click the User menu. It moves to the User List page.
- User List page, click the username to modify the tag information. It moves to the User Details page.
- User Details page, click the Tags tab. It moves to the Tags tab.
- Tag tab, click the Edit Tag button.
- After adding or modifying the tag, click the Save button. A popup window announcing the tag modification will open.
- You can modify the Key, Value of the previously registered tag.
- Add tag button to click to add a new tag.
- Clicking the X button in front of the added tag will delete the corresponding tag.
- Confirm button, you can check the modified tag information from the list.
Delete user
To delete a user, follow the following procedure.
- All services > Management > IAM menu is clicked. It moves to the Service Home page of Identity and Access Management(IAM).
- Service Home page, click the User menu. It moves to the User List page.
- User List page, click the username to be deleted, it will move to the User Details page.
- User Details page, click the Delete User button.
- the user is deleted, and it moves to the user list page.
To delete multiple users at the same time, follow the following procedure.
- All services > Management > IAM menu is clicked. It moves to the Service Home page of Identity and Access Management(IAM).
- Service Home page, click the User menu. It moves to the User List page.
- Check the users to be deleted from the user list.
- Confirm the selected users, and click the delete button.
- The selected users are deleted and the user list page is newly retrieved.
4.2.3 - Policy
The user can enter the required information of the policy and select detailed options through the Samsung Cloud Platform Console to create the corresponding service.
Create a policy
To create a policy, follow the following procedure.
- All services > Management > IAM menu is clicked. It moves to the Service Home page of Identity and Access Management(IAM).
- Service Home page, click the Policy menu. It moves to the Policy List page.
- Policy List page, click the Create Policy button. It moves to the Create Policy page.
- Basic Information Input, Additional Information Input area, enter the required information, then click the Next button. It moves to the Permission Setting area.
Classification MandatoryDetailed Description Policy Name Required Policy Name Input - Use Hangul, English, numbers, and special characters (
+=,.@-_) to enter a value between 3 and 128 characters
Description Selection A detailed description of the policy name - A detailed description of the policy name, up to 1,000 characters can be entered
tag selection policy to add tag - up to 50 tags can be added per resource
Table. Policy Creation Information Input Items - Basic Information and Additional Information - Use Hangul, English, numbers, and special characters (
- Select the service for which you want to set permissions. The permission settings item will be displayed under the name of the selected service.
- You can select the desired service or set up all services.
- Permission Setting area, please enter the required information.
Classification MandatoryDetailed Description control type required policy control type selection - Allow policy: a policy that allows the defined authorities
- Deny policy: a policy that denies the defined authorities
Action Required Select actions provided for each service - Actions that allow individual resource selection are displayed in purple
- Actions that target all resources are displayed in black
- Add Action Directly: Multiple actions can be specified at once using the Wildcard
*
Applied Resource Required Resource to which the action is applied - All Resources: Apply to all resources for the selected action
- Individual Resource: Apply only to the specified resource for the selected action
- Individual resources are only possible when selecting individual resources during purple action selection
- Click the Add Resource button to specify the target resource by resource type
- For more information on Add Resource, see Registering individual resources as applied resources
Authentication Type Required Authentication method for the target users to apply the policy - All Authentication: Applies regardless of authentication method
- API Key Authentication: Applies to users who use API key authentication
- Session Key Authentication, Console Login: Applies to users who use session key authentication or console login
Applied IP Required IP that allows policy application - Custom IP: IP that users directly register and manage
- Applied IP: IP that users directly register and apply policies, which can be registered in IP address or range format
- Excluded IP: IP to be excluded from Applied IP, which can be registered in IP address or range format
- All IP: Does not restrict IP access
- Allows access to all IPs, but if an exception is needed, Excluded IP can be registered to restrict access to registered IPs
Additional Conditions Select Add conditions for Attribute-Based Access Control (ABAC) - Condition Key: Select from Global Condition Key and Service Condition Key list
- Qualifier: Default, Any value in request, All values in request
- Operator: Bool, Null
- Value: True, False
Table. Policy Creation Information Input Items - Authority Settings
Caution
In the authority setting, it provides basic mode and JSON mode.
- Basic Mode에서 작성 후 JSON Mode 진입 또는 화면 이동 시, becomes * When entering JSON Mode or moving the screen after writing in Basic Mode, identical services are integrated into one and services with incomplete settings are deleted.
- JSON mode content written in a format that does not match JSON format cannot be converted to default mode.
- Authority Setting area, please select the service to set the authority first.
- Policy Import allows you to create a policy by importing an existing registered policy. For more information on Policy Import, please refer to Policy Import.
- Next button will be clicked. It moves to the Input Information Confirmation page.
- Check the input information and click the Complete button. It will move to the Policy List page.
Policy Import
You can bring in existing policies and refer to them when creating policies. To bring in existing policies, follow these steps.
- All services > Management > IAM menu is clicked. It moves to the Service Home page of Identity and Access Management(IAM).
- Service Home page, click the Policy menu. It moves to the Policy List page.
- Policy List page, click the Create Policy button. It moves to the Create Policy page.
- Basic Information Input, Additional Information Input area, please enter the necessary information.
- Next button click. It moves to the Permission Settings area.
- Policy Import button is clicked. Policy Import popup window opens.
- The list of policies registered in the Account will be retrieved. Select the policy you want to import and click Confirm.
- The imported policy is entered in the permission setting area and can be edited.
Note
Policy Import will be executed, then all previously entered contents will be deleted and replaced with the setting values of the selected policy.
Registering individual resources as applied resources
Authority Setting area where you can register individual resources as applied resources. To register individual resources as applied resources, follow the next procedure.
- All services > Management > IAM menu is clicked. It moves to the Service Home page of Identity and Access Management(IAM).
- Service Home page, click the Policy menu. It moves to the Policy List page.
- Policy List page, click the Create Policy button. Move to the Create Policy page.
- Basic Information Input, Additional Information Input area, please enter the necessary information.
- Next button click. It moves to the Permission Settings area.
- Authorization settings area, select the service to set authorization.
- Action 선택에서 Individual Resource 선택이 가능한 Action을 선택하세요.
- Actions that allow individual resource selection are displayed in purple.
- Applied Resources에서 Individual Resource을 클릭하세요.
- Resource Addition button should be clicked. Resource Addition popup window will be opened.
- Resource Addition tab where you add resources to apply policies. Resource addition is possible in two ways: Resource Selection, Direct Input.
- Resource Selection: Checks and selects resources retrieved by resource type.
- Direct Input: Add the target resource by directly entering it by resource type.
- Wildcard
*,?can be used. Select all is checked, all resources of the corresponding resource type are added, and subsequently newly added resources are also automatically included.
Reference
When you change the additional method, the entered contents will be deleted.
- Check the input information and click the Confirm button.
Check policy details
In the policy, you can check and modify the policy list and detailed information. The policy details page consists of basic information, permissions, connected targets, tags tabs.
To check the detailed information of the policy service, follow the next procedure.
- All services > Management > IAM menu is clicked. It moves to the Service Home page of Identity and Access Management(IAM).
- Service Home page, click the Policy menu. It moves to the Policy List page.
- Policy List page, click on the policy name to check the detailed information. It moves to the Policy Details page.
- Policy Details page displays basic information, and consists of Basic Information, Authorities, Connection Targets, Tags tabs.
Basic Information
Policy List page where you can check the basic information of the selected policy and modify the policy name and description if necessary.
| Classification | Detailed Description |
|---|---|
| Service | Service Name |
| Resource Type | Resource Type |
| SRN | Unique resource ID in Samsung Cloud Platform |
| Resource Name | Resource Name
|
| Resource ID | Unique Resource ID |
| Creator | The user who created the service |
| Creation Time | The time when the service was created |
| Editor | User who modified the service information |
| Revision Time | The time when service information was revised |
| Policy Name | The name of the policy |
| Policy Type | Type of policy
|
| Description | Description of the policy name |
Table. Policy Details - Basic Information Tab Items
Authority
Policy List page where you can check the authority information of the selected policy and modify the authority if necessary.
- Authority information to confirm the service name’s unfold button is clicked, detailed policy information will be displayed.
Note
In the permission settings, it provides basic mode and JSON mode.
| Classification | Detailed Description |
|---|---|
| Modify Authority | Authority modification is possible
|
| View Mode | Policy Control Type
|
| Control Type | Policy Control Type
|
| Action | Functions provided for each service that is the target of the policy |
| Applied Resource | Resource to which the action is applied
|
| Authentication Type | Authentication method for the target users to apply the policy
|
| Applied IP | IP that allows policy application
|
Table. Policy Details - Permissions Tab Items
Connection target
Policy List page where you can check the user groups registered for the selected policy, and add or exclude user groups as needed.
- User Group details can be found in User Group please refer to it.
| Classification | Detailed Description |
|---|---|
| User | List of users connected to the policy
|
| User Group | List of user groups linked to the policy
|
| Role | Display a list of roles linked to the policy
|
Table. Policy Details - Connected Target Tab Items
Tag
Policy List page where you can check the tag information of the selected policy, and add, change or delete it.
| Classification | Detailed Description |
|---|---|
| Tag List | Tag list
|
Table. Policy Details - Tags Tab Items
Managing Policies
You can change the name of the policy, or modify permissions, connection targets, or tags. If management of policies is required, you can perform tasks from the policy list or policy details page.
Modify basic information
You can modify the name and description of the policy. To modify the policy name and description, follow the following procedure.
- All services > Management > IAM menu is clicked. It moves to the Service Home page of Identity and Access Management(IAM).
- Service Home page, click the Policy menu. It moves to the Policy List page.
- Policy List page, click the policy name to modify the basic information. It moves to the Policy Details page.
- Policy Details page, check the basic information to be modified, and then click the Modify button.
- Policy Name: You can change the policy name. When the Edit button is clicked, the Edit Policy Name popup window opens.
- Description: You can modify the description of the policy. When the Modify button is clicked, the Description Modification popup window opens.
- Modify the content to be changed in the popup window, then click the Confirm button.
Managing Permissions
You can modify the authority of the policy. To modify the authority of the policy, follow the following procedure.
- All services > Management > IAM menu, click. It moves to the Service Home page of Identity and Access Management(IAM).
- Service Home page, click the policy menu. It moves to the policy list page.
- Policy List page, click the policy name to modify the policy authority. It moves to the Policy Details page.
- Policy Details page, click the Authority tab. It moves to the Connection Authority tab.
- Policy Details page, click the Edit Permissions button. It moves to the Edit Permissions page.
- Modify Authority page where you modify the necessary authority, click the Next button. It moves to the Check Input Information page.
- For a detailed description of each item in the authorization information, please refer to Creating a Policy.
- Input Information Confirmation page, confirm the modified authority information and click the Complete button. Move to the Authority tab.
Managing User Connections
- Policy > Connected Targets tab where you can check the users registered in the policy and connect or disconnect users as needed.
- User for more information about the user, please refer to User
Connect User
To connect a user to a policy, follow the next procedure.
- All services > Management > IAM menu is clicked. It moves to the Service Home page of Identity and Access Management(IAM).
- Service Home 페이지에서 Policy 메뉴를 클릭하세요. Policy List 페이지로 이동합니다. should be translated to: 2. Service Home page, click the Policy menu. It moves to the Policy List page. So the correct translation is: 2. Service Home page, click the Policy menu. It moves to the Policy List page.
- Policy List page, click the policy name to link the user. It moves to the Policy Details page.
- Policy Details page, click the Connection Target tab. It moves to the Connection Target tab.
- Connection Target tab, click the User Connection button, move to the User Connection page.
- User Connection page’s User list, select the user you want to connect to, then click the Complete button. A pop-up window announcing the user connection will open.
| Classification | Detailed Description |
|---|---|
| Connected User Group | Display users connected to the policy |
| User Group | Select a user to link the policy from the list of users registered in the Account
|
Table. User Connection Details
Disconnecting the user
To disconnect a user’s connection linked to the policy, follow the next procedure.
- All services > Management > IAM menu is clicked. It moves to the Service Home page of Identity and Access Management(IAM).
- Service Home page, click the policy menu. It moves to the policy list page.
- Policy List page, click the policy name to disconnect the user connection. It moves to the Policy Details page.
- Policy Details page, click the Connection Target tab. It moves to the Connection Target tab.
- Connection Target tab, select the user to disconnect from the list of user groups, then click the Disconnect button. A pop-up window notifying disconnection will open.
- Click the Confirm button in the pop-up window to notify the disconnection. The connection of the selected user will be released and the user group list will be refreshed.
Managing User Group Connections
- Policy > Connected Targets tab where you can check the user groups registered in the policy, and connect or disconnect user groups as needed.
- User Group details can be found in the User Group guide.
Connect User Group
To link a user group to a policy, follow these procedures.
- All services > Management > IAM menu, click. It moves to the Service Home page of Identity and Access Management(IAM).
- Service Home page, click the Policy menu. It moves to the Policy List page.
- Policy List page, click on the policy name to link the user group. It moves to the Policy Details page.
- Policy Details page, click the Connection Target tab. It moves to the Connection Target tab.
- Connection Target tab, click the User Group Connection button, and move to the User Group Connection page.
- User Group Linking page, select the user group you want to link from the User Group list, then click the Complete button. A popup window announcing the user group connection will open.
| Classification | Detailed Description |
|---|---|
| Connected User Group | Displays the user group connected to the policy |
| User Group | Select a user group to link the policy from the list of user groups registered in the Account
|
Table. User Group Link Details
Disconnecting User Groups
To disconnect the connection of the user group connected to the policy, follow the following procedure.
- All services > Management > IAM menu should be clicked. It moves to the Service Home page of Identity and Access Management(IAM).
- Service Home page, click the policy menu. It moves to the policy list page.
- Policy List page, click the policy name to release the user group link, it moves to the Policy Details page.
- Policy Details page, click the Connection Target tab. It moves to the Connection Target tab.
- Connection Target tab, select the user group to disconnect from the list of user groups, then click the Disconnect button. A pop-up window notifying disconnection will open.
- Click the Confirm button in the pop-up window to notify the disconnection. The connection of the selected user group will be released and the user group list will be refreshed.
Role Connection Management
- Policy > Connected Targets tab where you can check the roles registered in the policy, and connect or disconnect roles as needed.
- Role details can be found in the role guide.
Connecting Roles
To link a role to a policy, follow these procedures.
- All services > Management > IAM menu is clicked. It moves to the Service Home page of Identity and Access Management(IAM).
- Service Home page, click the policy menu. It moves to the policy list page.
- Policy List page, click on the policy name to link the role. It moves to the Policy Details page.
- Policy Details page, click the Connection Target tab. It moves to the Connection Target tab.
- Connection Target tab, click the Role Binding button, move to the Role Binding page.
- Role Connection page’s Role list, select the role you want to connect, then click the Complete button. A pop-up window announcing the role connection will open.
| Classification | Detailed Description |
|---|---|
| Connected Role | Display roles connected to the policy |
| Role | Select a role to link policies from the list of roles registered in the Account
|
Table. Detailed Items of Role Linkage
Disconnecting Roles
To disconnect the connection of a role connected to a policy, follow the following procedure.
- All services > Management > IAM menu should be clicked. It moves to the Service Home page of Identity and Access Management(IAM).
- Service Home page, click the Policy menu. It moves to the Policy List page.
- Policy List page, click the policy name to release the role link, it will move to the Policy Details page.
- Policy Details page, click the Connection Target tab. It moves to the Connection Target tab.
- Connection Target tab, select the role to disconnect from the list of roles and click the Disconnect button. A pop-up window notifying disconnection will open.
- Click the Confirm button in the pop-up window to notify the disconnection. The connection of the selected role will be released and the role list will be refreshed.
Tag management
You can modify the tags of the policy.
To modify tags in the policy, follow the following procedure.
- All services > Management > IAM menu is clicked. It moves to the Service Home page of Identity and Access Management(IAM).
- Service Home page, click the Policy menu. It moves to the Policy List page.
- Policy List page, click the policy name to add a user. It moves to the Policy Details page.
- Policy Details page, click the Tags tab. It moves to the Tags tab.
- Tag tab, click the Edit Tag button.
- After adding or modifying the tag, click the Save button. A popup window announcing the tag modification will open.
- You can modify the Key, Value of the previously registered tag.
- Add tag button to click on to add a new tag.
- Clicking the X button in front of the added tag will delete the tag.
- Confirm button, you can check the modified tag information from the list.
Policy deletion
To delete a policy, follow the following procedure.
- All services > Management > IAM menu is clicked. It moves to the Service Home page of Identity and Access Management(IAM).
- Service Home page, click the Policy menu. It moves to the Policy List page.
- Policy List page, click the policy name to be deleted. It moves to the Policy Details page.
- Policy Details page, click the Delete Policy button.
- The policy is deleted, and it moves to the policy list page.
To delete multiple policies at the same time, follow the following procedure.
- All services > Management > IAM menu is clicked. It moves to the Service Home page of Identity and Access Management(IAM).
- Service Home page, click the policy menu. It moves to the policy list page.
- Select the policy to delete from the policy list.
- Confirm the selected policies and click the policy deletion button.
- The selected policies are deleted and the policy list page is newly retrieved.
4.2.4 - Role
The user can create a role with separate permissions and switch from their own account to another role to access the Account.
Creating a role
To create a role, follow the following procedure.
- All services > Management > IAM menu is clicked. It moves to the Service Home page of Identity and Access Management(IAM).
- Service Home page, click the role menu. It moves to the role list page.
- Role List page, click the Create Role button. It moves to the Create Role page.
- Role Creation page where you enter information for role creation, click the Complete button.
- Basic Information Input를 입력하세요.
Classification NecessityDetailed Description Role Name Required Enter the name of the role - Use English letters, numbers, and special characters (
+=-_@,.) to enter within 64 characters
Description Selection Enter a description of the role within 1,000 characters Maximum session persistence time Required Enter the session time allowed for the user when switching roles in the console - Time selection: 1 hour, 2 hours, 4 hours, 8 hours, 12 hours
- Job input: Input possible in seconds from 3,200 seconds (1 hour) to 43,200 seconds (12 hours)
Table. Basic Information Items for Role Creation - Use English letters, numbers, and special characters (
- Execution Entity를 연결하세요.
Classification MandatoryDetailed Description Classification Essential Select the performing entity - Current Account, Different Account, User SRN, Credential Provider, Service
Value Required Enter the Value value for the performing entity - Current Account: Display the current Account ID
- Different Account: Enter the Account ID to use this role
- User SRN: Enter the SRN of the user registered in the Console
- Credential Provider: Select the credential provider name
- Service: Select Virtual Server or Cloud Functions
Add Select A button to add the performing entity - Up to 20 additional connections are possible
Table. Role Creation Performing Subject Connection Items - Policy을 연결하세요 -> * Connect the policy.
Classification MandatoryDetailed Description Policy Required Select a policy to link to the role - If you select the check box, the selected policy name will be displayed at the top of the list
- You can cancel the policy by clicking the X button for the added policy name at the top of the list or by unchecking the check box in the policy list
- If there is no policy to link, you can click the Create Policy item at the bottom of the policy list to register a new policy first
- After policy creation is complete, you can refresh the policy list and select the created policy
- For more information on policy creation, see Create Policy
Table. Role Creation Policy Link Items - Additional information를 입력하세요.
Classification MandatoryDetailed Description Tag Selection Tags to add to the role - Up to 50 tags can be added per resource
Table. Role Creation Additional Information Items
- When the popup window notifying role creation opens, click the Confirm button.
Check detailed role information
Role List page where you can check and modify the detailed information of the selected role.
To check the detailed information of the role, follow the next procedure.
- All services > Management > IAM menu, click. It moves to the Service Home page of Identity and Access Management(IAM).
- Service Home page, click the role menu. It moves to the role list page.
- Role List page, click the identity provider to verify. It moves to the Identity Provider Details page.
- Role Details page displays basic information, and consists of Basic Information, Performing Entity, Policy, Tag tabs.
Basic Information
You can check and modify the basic information of the role.
| Classification | Detailed Description |
|---|---|
| Service | Service Name |
| Resource Type | Resource Type |
| SRN | Unique resource ID in Samsung Cloud Platform |
| Resource Name | Resource Name
|
| Resource ID | Unique Resource ID |
| Creator | The user who created the service |
| Creation Time | The time when the service was created |
| Modifier | User who modified the service information |
| Revision Time | The time when service information was revised |
| Role Name | Role’s Name |
| Description | Description of the role proof provider
|
| Maximum session duration | The role session duration allowed for an IAM user switching roles in the Console
|
Table. Role Details - Basic Information Tab Items
Performing Entity
You can confirm and manage the subject of role performance.
| Classification | Detailed Description |
|---|---|
| Division | Name of the executing entity |
| Value | Value of the performing entity |
| Modify Executor | Modify the executor button
|
Table. Role Details - Performing Entity Tab Items
Policy
| Classification | Detailed Description |
|---|---|
| Disconnect | Disconnects the selected policy from the role
|
| Policy Connection | Connect a new policy to the role
|
| Policy Name | Policy’s Name
|
| Type | Type of Policy |
| Description | Description of the policy |
| Modification Time | The time when the policy was last modified |
Table. Role Details - Policy Tab Items
Tag
You can check, add, change, or delete the tag information of the credential provider.
| Classification | Detailed Description |
|---|---|
| Tag List | Tag list
|
Table. Role Supervisor - Tag Tab Items
Managing Roles
You can change the basic information of the role, or modify or delete the performing entity, connected policies, or tag information of the role.
Modify basic information
You can modify the maximum session persistence time and description in the role details. To modify the basic information, follow the following procedure.
- All services > Management > IAM menu is clicked. It moves to the Service Home page of Identity and Access Management(IAM).
- Service Home page, click the role menu. It moves to the role list page.
- Role List page, click the user role name to modify the basic information. It moves to the Role Details page.
- Role Details page, check the basic information to be modified, and then click the Modify button.
- Maximum session duration: You can set the role session duration allowed for an IAM user switching roles in the Console. When you click the Edit button, the Edit maximum session duration popup window opens.
- Description: You can modify the description of the role. When the Modify button is clicked, the Description Modification popup window opens.
- In the popup window, modify it to the content to be changed, then click the confirm button.
Managing the Performing Entity
You can add, modify, or delete the subject of the role’s performance.
To manage the performing subject of a role, follow the following procedure.
- All services > Management > IAM menu, click. It moves to the Service Home page of Identity and Access Management(IAM).
- Service Home page, click the role menu. It moves to the role list page.
- Role List page, click the user name to modify the performing subject. It moves to the Role Details page.
- Role Details page, click the Performing Entity tab. It moves to the Performing Entity tab.
- Execution Entity tab, click the Modify Execution Entity button. It moves to the Modify Execution Entity page.
- Modify the performing entity page, modify the performing entity, and then click the Complete button. A pop-up window announcing the modification of the performing entity will open.
| Classification | Mandatory | Detailed Description |
|---|---|---|
| Classification | Essential | Select the performing entity
|
| Value | Required | Enter the Value value for the performing entity
|
| Add | Select | Button to add the performing entity
|
Table. Items to be revised by the performing entity
- Click the Confirm button in the pop-up window notifying the modification of the performing entity. You can check the modified performing entity in the list of the Performing Entity tab.
Managing Policies
You can link policies to roles or unlink linked policies.
Connect Policy
You can link policies to a role.
To link a policy to a role, follow these procedures.
All services > Management > IAM menu, click. It moves to the Service Home page of Identity and Access Management(IAM).
Service Home page, click the role menu. It moves to the role list page.
Role List page, click the role name to link the policy. It moves to the User Detail page.
Role Details page, click the Policy tab. It moves to the Policy tab.
Policy tab, click the Policy Link button. It moves to the Policy Link page.
After selecting the policy to be linked to the role, click the Complete button. A popup window announcing the policy connection will open.
Classification Detailed Description Connected Policy Displays the policy connected to the role Policy Select a policy to be linked to the role from the list of policies registered in the Account - When you select a check box, the selected policy name is displayed at the top of the list
- The selected policy can be canceled by clicking the X button at the top of the list or by unchecking the check box in the policy list
- If there are no policies to link, click the Create Policy item at the bottom of the policy list to register a new policy first
- After policy creation is complete, you can refresh the policy list and select the created policy
- For more information on policy creation, see Create Policy
Table. Policy Link DetailsClick the Confirm button in the pop-up window notifying policy connection. You can check the connected policy in the list of the Policy tab.
Policy Disconnecting
You can release the policies connected to the user.
To release the policy linked to the user, follow the following procedure.
- All services > Management > IAM menu, click. It moves to the Service Home page of Identity and Access Management(IAM).
- Service Home page, click the role menu. It moves to the role list page.
- Role List page, click the role name to disconnect the policy link. It moves to the Role Details page.
- Role Details page, click the Policy tab. It moves to the Policy tab.
- Policy list, select the policy to disconnect, then click the Disconnect button. A pop-up window notifying disconnection will open.
- After checking the policy information to be disconnected, click the Confirm button. The policy will be disconnected.
Managing tags
You can add, modify, or delete the role’s tag.
To manage the role’s tags, follow the following procedure.
- All services > Management > IAM menu, click. It moves to the Service Home page of Identity and Access Management(IAM).
- Service Home page, click the Role menu. It moves to the Role List page.
- Role List page, click the role name to modify the tag information. It moves to the Role Details page.
- Role Details page, click the Tags tab. It moves to the Tags tab.
- Tag tab, click the Edit Tag button.
- After adding or modifying the tag, click the Save button. A popup window announcing the tag modification will open.
- You can modify the Key, Value of the previously registered tag.
- Add tag button to click and add a new tag.
- Clicking the X button in front of the added tag will delete the tag.
- Confirm button, you can check the modified tag information in the list.
Switching roles
To switch roles in the Samsung Cloud Platform Console, follow the following procedure.
Click the profile-shaped button at the top right of the Console. My menu popup window will open.
My menu popup window, click the role switch button. Role switch popup window opens.
Role Switching In the role switching popup window, enter the role switching information and click the Confirm button.
Classification MandatoryDetailed Description Account ID required Enter the Account ID that the user wants to enter with role switching Role Name Mandatory Enter the role name that the user wants to enter through role switching Alias Select Name to be used when the user enters with role switching Color Required Select a color to use as the background of the Account when entering the role - Not selected: Apply the existing Account background color
Table. Role Transition Information ItemsWhen the popup window notifying role switching opens, click the Confirm button.
Check the role
Console you can check the role information switched by clicking the profile-shaped button at the top right of the console.
| Provided Function | Description |
|---|---|
| Account ID | Account ID logged in to Samsung Cloud Platform Console |
| Role Name | Alias set when switching roles
|
| Time Zone | Time zone set by the user
|
| Account | Account information
|
| Cost Management | You can check the usage and billing details, payment history, and cost analysis, and manage Credits, budgets, Accounts, and payment methods
|
| Login user information | Role switched IAM user name and user’s Account ID |
| Switch to my account | Switch to the IAM user account and move to the Console Home page
|
| Role Switching | Can be switched to another role
|
| Log out | Log out from Samsung Cloud Platform Console |
Table. My Info. items when role switching
Delete role
To delete a role, follow the following procedure.
- All services > Management > IAM menu is clicked. It moves to the Service Home page of Identity and Access Management(IAM).
- Service Home page, click the role menu. It moves to the role list page.
- Role List page, click the role name to be deleted. It moves to the Role Details page.
- Role Details page, click the Delete Role button.
- The role is deleted, and it moves to the role list page.
To delete multiple roles at the same time, follow the procedure below.
- All services > Management > IAM menu, click. It moves to the Service Home page of Identity and Access Management(IAM).
- Service Home page, click the role menu. It moves to the role list page.
- Check the role to be deleted from the role list.
- Confirm the selected role, and click the role deletion button.
- The selected role is deleted and the role list page is newly retrieved.
4.2.5 - Credential Provider
You can access and use the Account resource through an identity provider.
Creating a Credential Provider
To create a credential provider, follow these procedures.
- All services > Management > IAM menu is clicked. It moves to the Service Home page of Identity and Access Management(IAM).
- Service Home page, click the credential provider menu. It moves to the credential provider list page.
- Credential Provider List page, click the Create Credential Provider button. It moves to the Create Credential Provider page.
- Basic Information Input, Additional Information Input areas, enter the information and click the Confirm button.
| Classification | Mandatory | Detailed Description |
|---|---|---|
| Credential Provider Name | Required | Name of the credential provider
|
| Description | Select | Enter a description of the identity provider within 1,000 characters |
| Type | Required | Select the type of authentication provider
|
| Metadata | Select | Attach a metadata file provided by the IdP, only one file can be uploaded by clicking the File Attach button
|
| Tag | Selection | Tags to be added to the authentication provider group
|
Table. Input Items for Creating Credential Provider Information
Reference
Credential Provider from OIDC type is scheduled to be available in 2026.
- When the popup window notifying the creation of a credential provider opens, click the Confirm button.
Check the details of the certificate provider
You can check and modify the credential provider details. The Credential Provider page consists of Basic Information, Tags tabs.
To check the detailed information of the certification provider, follow the next procedure.
- All services > Management > IAM menu is clicked. It moves to the Service Home page of Identity and Access Management(IAM).
- Service Home page, click the credential provider menu. It moves to the credential provider list page.
- Credential Provider List page, click the credential provider to check, it moves to the Credential Provider Details page.
- Credential Provider Details page displays basic information, and consists of Basic Information tab, Tags tab.
Basic Information
You can check and modify the basic information of the certification provider.
| Classification | Detailed Description |
|---|---|
| Service | Service Name |
| Resource Type | Resource Type |
| SRN | Unique resource ID in Samsung Cloud Platform |
| Resource Name | Resource Name
|
| Resource ID | Unique Resource ID |
| Creator | User who created the service |
| Creation Time | The time when the service was created |
| Editor | User who modified the service information |
| Revision Time | The time when service information was revised |
| Credential Provider Name | Credential provider’s name
|
| Type | The type of credential provider |
| Description | Description of the identity provider
|
| Login URL | Login URL |
| Metadata | Metadata
|
Table. Credential Provider Basic Information Tab Items
Reference
ID Center에서 사용 중인 자격 증명 공급자 정보는 수정할 수 없습니다 -> The credential provider information being used in the ID Center cannot be modified.
Tag
You can check, add, change or delete the tag information of the credential provider.
| Category | Detailed Description |
|---|---|
| Tag List | Tag list
|
Table. Credential Provider Tags Tab Items
Deleting Credential Providers
Guidance
ID Center에서 사용 중인 자격 증명 공급자 정보는 수정할 수 없습니다. -> ID Center에서 사용 중인 자격 증명 공급자 정보는 수정할 수 없습니다. is incorrect, here is the correct translation: The credential provider information currently in use at the ID Center cannot be modified.
To delete an identity provider, follow the following procedure.
- All services > Management > IAM menu is clicked. It moves to the Service Home page of Identity and Access Management(IAM).
- Service Home page, click the credential provider menu. It moves to the credential provider list page.
- Credential Provider List page, click the credential provider name to be deleted, it moves to the Credential Provider Details page.
- Credential Provider Details page, click the Delete Credential Provider button.
- The credential provider is deleted, and it moves to the Credential Provider List page.
To delete multiple identity providers at the same time, follow these steps.
- All services > Management > IAM menu, click. It moves to the Service Home page of Identity and Access Management(IAM).
- Service Home page, click the credential provider menu. It moves to the credential provider list page.
- Check the certification provider to be deleted from the list of certification providers.
- Confirm the selected credential provider and click the Credential Provider Delete button.
- The selected credential provider is deleted and the Credential Provider List page is refreshed.
4.2.6 - My Info.
My Info. provides the function of managing the user’s basic information and authentication key.
My Info. Check
The user can check and change the user’s basic information on the My Info screen, and manage the authentication key.
My Info.’s information to confirm, please follow the next procedure.
- All services > Management > IAM menu is clicked. It moves to the Service Home page of Identity and Access Management(IAM).
- Service Home page, click the My Info. menu. It moves to the My Info. page.
- My Info. page displays basic information, and it consists of basic information, user, policy, tag tabs.
Notice
My Info. page can be accessed from My menu > My Info. at the top of the Console screen and My Info. of Console Home.
Basic Information
My Info. > Basic Information tab where you can check the user’s basic information and modify email, password, mobile phone number, password reuse restriction, and time zone if necessary.
| Classification | Detailed Description |
|---|---|
| User Name | User’s Name |
| SRN | user’s SRN |
| User’s Email | |
| Mobile Phone Number | User’s Mobile Phone Number |
| Password | User’s password |
| Password Reuse Limit | Number of password reuse limits for users |
| Time Zone | User’s Time Zone |
| Terms of Service | User’s Name |
Table. Basic info tab items of My Info.
Notice
The way to modify basic information is to refer to Modify Basic Information.
Key Management
My Info. > Authentication Key Management tab where you can check the user’s authentication key information and create an authentication key if necessary.
| Classification | Detailed Description |
|---|---|
| Authentication Key | Authentication key created by user
|
| Security Settings | Security settings for authentication key
|
Table. My Info.'s authentication key management tab items
Access IP Control
My Info. > Access IP Control tab where you can register and manage accessible IPs.
| Classification | Detailed Description |
|---|---|
| Console access IP control | Whether to use the access IP control function
|
| Access IP List | List of IPs that can access the Console |
Table. Access IP Control Tab Items
Notice
- The access IP control function can only be used by Root users and IAM users, it cannot be used by ID Center and roles.
- You can add and manage IPs even if you don’t use the access IP control feature.
Basic Information Modification
My Info. > Basic Information tab where you can modify email, password, mobile phone number, password reuse restriction, and timezone.
Editing email
You can modify the user’s email. To modify the user’s email, follow the following procedure.
- All services > Management > IAM menu, click. It moves to the Service Home page of Identity and Access Management(IAM).
- Service Home page, click the My Info. menu. It moves to the My Info. page.
- My Info. page’s basic information tab, click edit email. edit email popup window will be opened.
- Email Modification popup window, enter the characters displayed for auto-input prevention and press the Confirm button.
- Email을 입력하고 Authentication 버튼을 클릭하세요. 입력된 Email로 인증번호가 발송됩니다.
- Enter the authentication number sent to the entered email and click the confirm button.
- Email modification popup window, click the Confirm button. Password confirmation popup window opens.
- Password Confirmation popup window, enter the password, then click the Confirm button. It moves to the Basic Information tab.
Caution
Please enter your email information accurately, if the authentication number is not received, please check the spam message box.
Modify password
You can modify the user’s password. To modify the user’s password, follow the following procedure.
- All services > Management > IAM menu is clicked. It moves to the Service Home page of Identity and Access Management(IAM).
- Service Home page, click the My Info. menu. It moves to the My Info. page.
- My Info. page’s basic information tab, click password modification. The password change popup window opens.
- Password Change popup window, enter Existing Password, New Password, and Password Confirmation.
- Password change popup window, click the Confirm button. It moves to the Basic Information tab.
Caution
Precautions when changing password
- Uppercase letters (English), lowercase letters (English), numbers, special characters (
!@#$%&*^) must each be included at least once. - The length is 9~20 characters.
- ID or username cannot be used as a password.
- The same character cannot be used three times or more.
- Easily guessable passwords cannot be used.
- Recently used passwords cannot be used.
- 4 characters or more of continuous characters/numbers cannot be used.
- The password change cycle is 90 days.
Modify phone number
You can modify the user’s mobile phone number. To modify the user’s mobile phone number, follow the following procedure.
- All services > Management > IAM menu, click. It moves to the Service Home page of Identity and Access Management(IAM).
- Service Home page, click the My Info. menu. It moves to the My Info. page.
- My Info. page’s basic information tab, click the change mobile phone number button. The change mobile phone number popup window will open.
- Cell phone number change popup window, enter the characters shown for auto-input prevention and press the Confirm button.
- Phone number를 입력하고 Verify 버튼을 클릭하세요. 입력된 Phone number로 인증번호가 발송됩니다.
- Enter the authentication number sent to the entered mobile phone number and click the confirm button.
- Change mobile phone number popup window, click the Confirm button. Password confirmation popup window opens.
- Password Confirmation popup window, enter the password and click the Confirm button. Move to the Basic Information tab.
Caution
Please enter the mobile phone number information in your name accurately. If the authentication number is not received, please check the spam message box.
Modify password reuse restrictions
You can modify the number of times a user’s password can be reused. To modify the number of times a user’s password can be reused, follow the following procedure.
- All services > Management > IAM menu is clicked. It moves to the Service Home page of Identity and Access Management(IAM).
- Service Home page, click the My Info. menu. It moves to the My Info. page.
- My Info. page’s basic information tab, click Modify password reuse restriction. The Modify password reuse restriction popup window will open.
- Password Reuse Restriction Modification In the popup window, select the number of recently used passwords that cannot be reused.
- Password Reuse Restriction Modification popup window, click the Confirm button. Move to the Basic Information tab.
Modifying the Time Zone
You can modify the user’s time zone. To modify the user’s time zone, follow the following procedure.
- All services > Management > IAM menu is clicked. It moves to the Service Home page of Identity and Access Management(IAM).
- Service Home page, click the My Info. menu. It moves to the My Info. page.
- My Info. page’s basic information tab, click time zone modification, the time zone modification popup window opens.
- Time Zone Modification Please select the user’s time zone.
- Time modification popup window, click the Confirm button. It moves to the Basic Information tab.
Managing authentication keys
My Info. > Authentication Key Management tab where you can generate authentication keys and manage security settings.
Creating an authentication key
You can generate the user’s authentication key. To generate the user’s authentication key, follow the following procedure.
- All services > Management > IAM menu, click. It moves to the Service Home page of Identity and Access Management(IAM).
- Service Home page, click the My Info. menu. It moves to the My Info. page.
- My Info. page’s Key Management tab should be clicked. It moves to the Key Management tab.
- API Key Management tab, click the Generate API Key button. This will move to the Generate API Key page.
- Generate authentication key page where you enter the expiration period and usage.
- Expiration period can be entered as a number from 1 to 365.
- Expiration period where selecting permanent allows permanent use.
- Check the authentication key creation information and click the Confirm button. It moves to the Authentication Key Management tab.
Reference
- The authentication key can only be created up to 2 times.
- After generating a new authentication key, you must apply the changed API authentication key to the service you are using.
- In the security settings, you can set the authentication method and access allowed IP usage settings.
- You can call the API with the generated authentication key to issue a temporary key, and up to 5 can be issued per authentication key.
Check the details of the authentication key
To view the detailed information of the authentication key, proceed with the following procedure.
- All services > Management > IAM menu is clicked. It moves to the Service Home page of Identity and Access Management(IAM).
- Service Home page, click the My Info. menu. It moves to the My Info. page.
- My Info. page’s Key Management tab should be clicked. It moves to the Key Management tab.
- Authentication Key Management tab, click on the authentication key you want to inquire, it will move to the Authentication Key Details page.
- API Key Details page consists of Basic Information, API Key Management tabs.
Basic Information
Authentication Key Details > Basic Information tab where you can check the basic information of the selected authentication key.
| Classification | Detailed Description |
|---|---|
| Use of authentication key | Indicates whether to use the authentication key
|
| Delete authentication key | Delete the authentication key |
| Authentication Key | Access Key and Secret Key information
|
| Usage | Purpose of using the authentication key |
| Creation Time | The time when the user created the authentication key |
| Expiration Time | Expiration time of the authentication key created by the user |
| Secret Vault | Secret Vault service usage status
|
Table. My Info.'s authentication key management > Basic information items
User Lim Sik-i
Authentication Key Details > User Key tab where you can view the list of user keys for the selected authentication key.
Notice
임시키는 API로만 생성이 가능하며 사용자 임시키 탭에서는 조회 및 삭제만 가능합니다. is translated to: IMSI key can only be created via API, and on the User IMSI key tab, only inquiry and deletion are possible.
| Classification | Detailed Description |
|---|---|
| Delete | Delete the selected license key from the user license key list
|
| More | Select the usage of the selected IMSI from the user IMSI list
|
| Access Key | A unique string to call the API |
| Secret Key | Security token used with Access Key
|
| Creation Time | The time when the user created the authentication key |
| Expiration Time | Expiration time of the authentication key created by the user |
| Status | Whether to use the authentication key |
Table. My Info.'s authentication key management > User Private Key Details
Secret Vault Administrator
인증키 상세 > Secret Vault 임시키 tab allows you to view the list of Secret Vault 임시키 for the selected authentication key.
Notice
- Secret Vault service can be checked when using.
- The shim key can only be created via API, and in the Secret Vault tab, only viewing and deletion are possible.
| Classification | Detailed Description |
|---|---|
| Delete | Delete the selected license key from the user license key list
|
| More | Select the usage of the selected IMSI from the user IMSI list
|
| Access Key | a unique string for calling the API |
| Secret Key | Security token used with Access Key
|
| Creation Time | The time when the user created the authentication key |
| Expiration Time | Expiration time of the authentication key created by the user |
| Status | Whether to use the authentication key |
Table. My Info.'s authentication key management > Secret Vault detailed items
Modify authentication key security settings
You can register security settings for the user’s authentication key. To register security settings for the user’s authentication key, follow the procedure below.
- All services > Management > IAM menu is clicked. It moves to the Service Home page of Identity and Access Management(IAM).
- Service Home page, click the My Info. menu. It moves to the My Info. page.
- My Info. page’s Key Management tab should be clicked. It moves to the Key Management tab.
- Authentication Key Management tab, click the Edit Security Settings button. It moves to the Authentication Key Security Settings Edit page.
- Modify authentication key security settings page where you enter the authentication method and allowed access IP.
- Authentication method: One-time key, authentication key
- You can access it only when the set authentication is set as the authentication method when calling the API.
- Issued key: issued key using authentication key and authentication number for authentication
- Authentication key: authenticated with the authentication key created in the Console
- Allowed IP for Access: IP that controls user access
- Usage settings only allow access to specific IP ranges when enabled.
- Usage settings after IP unregistration will deny access to all IPs.
- Do not use setting allows access to all IPs.
- Up to 50 can be registered.
- You can enter an IP address or CIDR.
- Check the security settings information for the authentication key and click the Confirm button. It moves to the Authentication Key Management tab.
Note
- South Korea (kr-south) region restrictions
- Access allowed IP is set to Use, only IP addresses can be entered, CIDR cannot be entered.
Caution
- It is recommended to use IMSI authentication and allow access to IP usage.
- When authenticating the authentication key, the email or text authentication step may be omitted, which may cause a security risk.
- Access allowed IP if not used, it can be accessed from any IP, which can cause a security risk.
- Allowed IP for access when used, if the IP is not registered, all access will be restricted.
- The authentication key with a temporary key generated by Secret Vault can be stopped and deleted after canceling the Secret Vault service in each region of the Account.
Delete authentication key
Guidance
- The authentication key can only be deleted when it is in the suspended state. Please stop using the authentication key before deleting it.
- When using the Secret Vault service, you cannot stop using the authentication key. Please cancel the Secret Vault service first.
To delete the authentication key, follow the following procedure.
- All services > Management > IAM menu, click. It moves to the Service Home page of Identity and Access Management(IAM).
- Service Home page, click the My Info. menu. It moves to the My Info. page.
- My Info. page’s Key Management tab should be clicked. It moves to the Key Management tab.
- Authentication Key Management tab, click the authentication key to be deleted from the list of authentication keys. It moves to the Authentication Key Details page.
- Authentication Key Details page, click the Delete Authentication Key button.
- The authentication key is deleted, and it moves to the Authentication Key Management tab.
To delete multiple policies at the same time, follow the following procedure.
- All services > Management > IAM menu is clicked. It moves to the Service Home page of Identity and Access Management(IAM).
- Service Home page, click the My Info. menu. It moves to the My Info. page.
- My Info. page’s Key Management tab should be clicked. It moves to the Key Management tab.
- Key Management tab’s key list, check the authentication key to be deleted from there.
- Check the selected authentication keys and click the Delete Authentication Key button.
- The selected authentication keys are deleted and the Authentication Key Management tab is newly retrieved.
Managing Access IP
My Info. > Access IP Control tab where you can register and manage IP addresses that can access the Console.
You can restrict access to the Console only from registered IP ranges by using the access IP control feature.
Notice
- The access IP control function can only be used by Root users and IAM users, it cannot be used by ID Center and roles.
- You can add and manage IPs even if you don’t use the access IP control feature.
To use the access IP control function and manage IP, follow the following procedure.
- All services > Management > IAM menu is clicked. It moves to the Service Home page of Identity and Access Management(IAM).
- Service Home page, click the My Info. menu. It moves to the My Info. page.
- My Info. page, click the Access IP Control tab. It moves to the Access IP Control page.
- Access IP Control page, click the Edit button of Console Access IP Control. The Password Confirmation popup window opens.
- After entering the password, click the Confirm button. The Console Access IP Control Modification popup window will open.
- After setting the access IP control function to use, register the IP to be allowed access.
| Classification | Detailed Description |
|---|---|
| Console access IP removal | Whether to use the access IP control function
|
| IP list | List of IPs allowed to access
|
Table. Console Access IP Control Modification Items
4.2.7 -
4.3 - API Reference
API Reference
4.4 - CLI Reference
CLI Reference
4.5 - Release Note
IAM
2025.10.23
FEATURE
IP access control feature added and other features enhanced- When creating a user or changing a password, related information can be shared by email.
- The entities that perform the role function have been added as Virtual Server and Cloud Function.
- When the role is changed, you can check the session expiration time in My Menu.
- You can register and manage IP addresses that can access the Console.
- The Root user and IAM user with the same information (phone number, email) can switch to each other even after logging in.
2025.07.01
FEATURE
Role, Authentication Provider Functionality Provided- Role function has been added.
- The user can switch from their account to another role to access the Account.
- Credential provider feature has been added.
- You can create an identity provider and access the Account resource in the Console through the created identity provider.
- You can directly connect users and policies.
- When creating a policy, you can add conditions for attribute-based access control (ABAC).
2025.04.28
FEATURE
My info feature change- The mandatory conditions for creating a user password have been changed.
- When modifying the authentication key, CIDR input is applied selectively.
- When the user’s email or phone number is changed, a password re-confirmation procedure has been added.
2025.02.27
FEATURE
IAM user group, user, policy, and authentication key feature changes- IAM(Identity and Access Management) function change
- Added user group and user function, policy creation function.
- App authentication key and storage authentication key are integrated to provide as an authentication key.
- Samsung Cloud Platform common feature change
- Account 및 Service Home, tags etc common CX change items have been reflected.
2024.07.02
NEW
Official Release of IAM Service- IAM(Identity and Access Management) service has been released.
- provides user authentication and authorization management
- provides access control policy management
2024.07.02
NEW
IAM Beta Service Release- IAM(Identity and Access Management) service has been released.
- provides user authentication and authorization management
- access control policy management provided
5 - ID Center
5.1 - Overview
Service Overview
ID Center is a service that allows you to easily manage access permissions for account-based resources on the Samsung Cloud Platform from a central location. You can manage to perform tasks according to user permissions by creating authority policies for each service and assigning accounts and policies associated with the Organization service to users.
Features
- Easy Access Control: Through SAML (Security Assertion Markup Language) based qualification authentication, it is possible to access the resources of multiple accounts within the organization by granting authentication and authorization from the Samsung Cloud Platform.
- Efficient Account Management: Integrated management of costs and resource usage from all accounts owned by the organization is possible by linking with the Organization service.
- Account Security Enhancement: Security can be enhanced by allowing only authorized ID Center users to access through the Access Portal, which is provided separately from the Samsung Cloud Platform Console. Through the Access Portal, it is possible to prevent other users outside the customer organization from accessing the account in the first place.
Composition
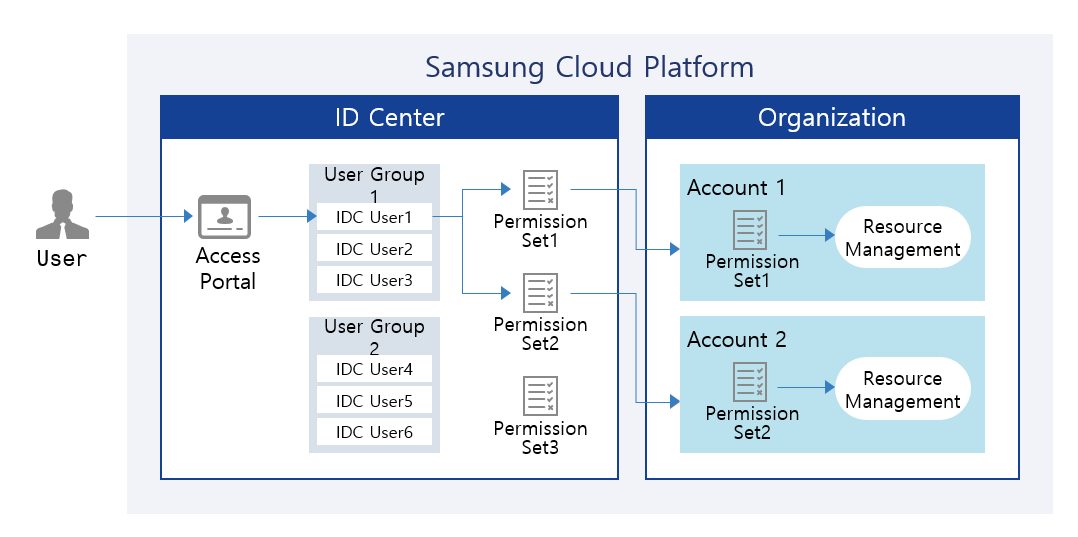
Provided Features
ID Center provides the following functions.
- User and User Group Management: User and user group management can be created and service-specific authority management policies can be configured. Users must have MFA (Multi-Factor Authentication) applied to strengthen account access management.
- Account Assignment Management: You can assign and manage accounts corresponding to each user’s task.
- Permission Set Management: You can create and manage permission sets using default policies or custom policies for each account, or by configuring policies directly.
- Access Portal Provided: An Access Portal is provided instead of Samsung Cloud Platform Console, allowing only ID Center users to access.
Components
User
The administrator can create users and add them to user groups. The administrator can automatically generate or manually create user passwords and provide users with Access Portal connection information. Additionally, administrators can assign users to accounts that match each task.
Reference
For more information on user management, see How-to guides > Managing Users.
User Group
You can link users and accounts through user groups. You can configure user groups suitable for each task and register users to assign them to accounts.
Reference
For more information about user groups, see How-to guides > Managing user groups.
Permission Set
You can create a set of permissions by utilizing the default policies and custom policies existing in the Account or by directly composing a policy.
Reference
For more information about permission sets, see How-to guides > Managing Permission Sets.
Regional Provision Status
ID Center can be provided in the following environment.
| Region | Availability |
|---|---|
| Western Korea(kr-west1) | Provided |
| Korea East(kr-east1) | Provided |
| South Korea (kr-south1) | Provided |
| South Korea (kr-south2) | Provided |
| South Korea, southern region 3(kr-south3) | Not provided |
Table. ID Center Regional Provision Status
Preceding Service
This is a list of services that must be pre-configured before creating this service. Please refer to the guide provided for each service and prepare in advance.
| Service Category | Service | Detailed Description |
|---|---|---|
| Management | Organization | A service that organizes accounts by organizational unit, manages them hierarchically, and controls resource access permissions |
Table. ID Center Preceding Service
5.2 - How-to guides
The user can enter the required information of ID Center through the Samsung Cloud Platform Console, select detailed options, and create the service.
ID Center Create
You can create and use an ID Center in the Samsung Cloud Platform Console.
Guide
ID Center can only be managed in the region where the ID Center was created.
Reference
Only the Organization’s Management Account can create an ID Center.
To create an ID Center, follow the steps below.
- Click the All Services > Management > ID Center menu. Go to the Service Home page of ID Center.
- Click the ID Center Application button on the Service Home page. Navigate to the ID Center Creation page.
- ID Center creation page, after entering the basic information, click the Complete button.
Category RequiredDetailed description ID Center name Required Enter the name of the ID Center - Enter using English letters, numbers, special characters (
+=-_@,.) within 3~128 characters
Description Select Enter a description of the organizational unit within 1,000 characters Credential Source Required Select Credential Source Type - ID Center’s own directory: Use directory within ID Center
- AD (Active Directory): Use Active Directory managed directly by the user
- For detailed information on settings when selected, refer to Change Credential Source Type
- Automatically synchronize AD information upon creation
Table. ID Center creation basic information - Enter using English letters, numbers, special characters (
- When the popup notifying the creation of ID Center opens, click the Confirm button.
- Service Home Check the ID Center dashboard on the page.
Category Detailed description ID Center Information Displays the name, ID, and Access Portal URL of the ID Center - Clicking the ID Center Information item navigates to the ID Center Settings page where detailed ID Center information can be viewed
User Number of users created in ID Center - Clicking the user count moves to the User List page
- Clicking the Create item moves to the User Creation page. Create User refer
User Group Number of user groups created in ID Center - Clicking the group count moves to the User Group List page
- Clicking the Create item moves to the User Group Creation page. See Create User Group
Permission Set Number of permission sets created in ID Center - Click the number of permission sets to go to the Permission Set List page
- Click the Add item to go to the Create Permission Set page. Create Permission Set see
Table. ID Center Service Home Dashboard Items
ID Center Check detailed information
You can view detailed information of the ID Center and manage permissions.
To view detailed information of the ID Center and manage permissions, follow the steps below.
- All Services > Management > ID Center Click the menu. Navigate to ID Center’s Service Home page.
- Service Home page, click the ID Center Settings menu. Navigate to the ID Center Settings page.
| Category | Detailed description |
|---|---|
| ID Center Delete | Button to delete ID Center
|
| service | service name |
| Resource Type | Resource Type |
| SRN | Unique resource ID in Samsung Cloud Platform |
| Resource Name | Resource Name |
| Resource ID | Unique resource ID in the service |
| Creator | User who created the service |
| Creation time | Time the service was created |
| Editor | User who modified the service information |
| Modification Date and Time | Date and time when service information was edited |
| ID Center name | ID Center name
|
| Region | Region that created the ID Center |
| Description | Description of ID Center
|
| Organization ID | Organization’s ID |
| Credential Source | Type of Credential Source
|
| Access Portal URL | URL to access the Access Portal |
| Delegated Authority | Display Account Name, Account ID, Email, Delegation Date/Time information of the Account that delegated ID Center management authority
|
Table. ID Center configuration items
Managing Credential Sources
You can change the credential source type or change and manage the setting values of the AD (Active Directory) type.
AD (Active Directory) Apply for Integration
To use a user-managed AD (Active Directory) integration, you must first prepare the VPC and Load Balancer, then submit a request via SR. To apply for AD integration, follow the steps below.
Secure a VPC to integrate with the user’s AD.
- If network connection is required, connect to the network where the user’s AD exists via the Direct Connect service.
- For more details, refer to Create Direct Connect.
Configure the Load Balancer.
- Create a Load Balancer and an LB server group.
- Add the IP to be linked with AD as a member of the connected resources of the LB server group.
- Create a Listener from the connected resources of the Load Balancer and connect the LB server group.Guide
- Through the Load Balancer service, call information for AD synchronization from ID Center can pass through the user’s VPC to call the user’s AD.
- For detailed information on creating and using the Load Balancer service, please refer to Using Load Balancer Service.
Configure the PrivateLink Service in the user’s VPC.
- Create the PrivateLink Service of the user VPC that will be called from ID Center.
- When creating a PrivateLink Service, select the Load Balancer created in step 2 as the connection resource.
When the preparation work is finished, click the All Services > Management > Support Center menu. Move to the Service Home page.
From the Service Home page, click the Service Request menu. Navigate to the Service Request List page.
Click the Service Request button on the Service Request List page.
- Select and enter the information required for the service request.
Category RequiredDetailed description Title Required Title for service request - Enter within 64 characters using Korean, English, numbers, special characters (
+=,.@-_)
Region Required Select the region to request the service Service Required Management service group’s ID Center service selection Work Category Required ID Center AD Integration Request Optional Content Required Information input for ID Center AD linkage application Table. ID Center AD Integration Application Items - Enter within 64 characters using Korean, English, numbers, special characters (
- Select and enter the information required for the service request.
Check the input information and click the Request button.
- When creation is complete, check on the Service Request List page.
Notice
After requesting the service, you cannot edit or delete the content you wrote.
Change Credential Source Type
You can change the credential source or modify the settings.
Caution
If you change the credential source, all configuration information and resources such as previously set users, user groups, account assignments, and permission sets will be deleted.
Follow the steps below to change the credential source type.
- All Services > Management > ID Center Click the menu. Navigate to ID Center’s Service Home page.
- Click the ID Center Settings menu on the Service Home page. Navigate to the ID Center Details page.
- ID Center Details page, click the Edit button of the Credential Source item. Credential Source Change popup opens.
- After selecting the credential source type to use, click the Confirm button. A popup window notifying the credential source change will open.
| Category | Detailed description |
|---|---|
| ID Center own directory | Use directory within ID Center
|
| AD (Active Directory) | Use Active Directory that the user manages directly
|
Table. Credential Source Type Change Items
AD (Active Directory) Information Synchronization
You can synchronize AD information.
Reference
- AD information is automatically synchronized daily from 0:00 to 06:00 (Asia/Seoul, GMT +09:00).
- If a new AD information connection is required, click the AD Reset button to change the AD information, then synchronize.
To synchronize AD information, follow the steps below.
- All Services > Management > ID Center Click the menu. Navigate to ID Center’s Service Home page.
- Click the ID Center Settings menu on the Service Home page. Navigate to the ID Center Details page.
- ID Center Details on the page, click the Sync button next to the sync time of the Credential Source item. The AD Information Sync popup window opens.
- After checking the synchronization notification, click the Confirm button. AD information synchronization will start.
- The change time varies depending on the scale.
Manage Permissions
You can delegate the administrative rights of the ID Center to another Account, or revoke the delegated rights.
Delegating Permissions
You can delegate the management authority of the ID Center to another account.
Follow the steps below to delegate management rights to another account.
- All Services > Management > ID Center Click the menu. Navigate to ID Center’s Service Home page.
- Click the ID Center Settings menu on the Service Home page. Navigate to the ID Center Details page.
- Click the Permission Delegation button on the ID Center Details page. You will be taken to the Permission Delegation page.
- Permission Delegation button is displayed only when there is no Account that has currently delegated authority.
- Permission Delegation on the page, after selecting the account to delegate authority to, click the Complete button.
Category Detailed description Account name Account name Account ID Account’s ID email Account email Additional Date Account creation or registration date/time in Organization Add Type Method of adding Account in Organization - Create: Add by creating new on Add Account page
- Join: Add an already created Account
Table. ID Center Delegated Authority Account List
Note
When you click the View Hierarchy button, you can view the Account list in a hierarchical structure.
Cancel Delegation
You can revoke the administrative privileges of the ID Center delegated to another Account.
To cancel the delegation of administrative authority, follow the steps below.
- All Services > Management > ID Center Click the menu. Navigate to the Service Home page of ID Center.
- Click the ID Center Settings menu on the Service Home page. Navigate to the ID Center Details page.
- Click the Cancel Delegation button on the ID Center Details page.
- If a popup notifying the revocation of delegation opens, click the Confirm button.
ID Center Delete
Caution
An account delegated with the management of the ID Center cannot delete the ID Center.
Caution
When ID Center is deleted, all users, user groups, and permission sets within the ID Center are deleted, and all entries assigned to the Account are deleted.
To delete the ID Center, follow these steps.
- All Services > Management > ID Center menu, click. Go to ID Center’s Service Home page.
- Service Home on the page, click the ID Center 설정 menu. Navigate to the ID Center 설정 page.
- ID Center Settings on the page click the ID Center Delete button. ID Center Delete popup window opens.
- ID Center Delete After entering the name of the ID Center to delete in the popup window, click the Confirm button. Navigate to the Service Home page.
- ID Center deletion time varies depending on the scale, and you can confirm via notification when deletion is complete.
- While deleting the ID Center, you cannot navigate to other menu pages.
5.2.1 - ID Center User Management
ID Center’s user can be checked and managed.
Create User
You can create a user and add it to the ID Center.
To create a user, follow the following procedure.
- All services > Management > ID Center menu, click. It moves to the Service Home page of ID Center.
- Service Home page, click the User menu. It moves to the User List page.
- User List page, click the Create User button. It moves to the Create User page.
- User Created page, enter the basic information and additional information, then click the Complete button.
Classification NecessityDetailed Description Username Required Enter the user’s name - Use English letters, numbers, and special characters (
+=-_@,.) within 128 characters
- The username cannot be changed after creation
Description Selection Enter a description of the user within 1,000 characters Password Required Password creation method selection - Automatic generation: Automatically generate a password and provide it in a popup window when user creation is complete
- Direct input: Refer to the password creation rules and enter directly
User Real Name Required Enter the user’s last name and first name in real name Affiliation Information Input Select Enter business unit, department, administrator, and employee number information, each within 128 characters User Group Selection Select Select the user group to which you want to add users - To create a user group, refer to How to Create a User Group
Table. User-generated information - Use English letters, numbers, and special characters (
Password Creation Rules
- Uppercase letters (English), lowercase letters (English), numbers, special characters (
!@#$%&*^) must each be included at least once. - The length is 9~20 characters.
- ID or username cannot be used as a password.
- The same character cannot be used three times or more.
- Easily guessable passwords cannot be used.
- Recently used passwords cannot be used.
- 4 characters or more of continuous characters/numbers cannot be used.
- The password change cycle is 90 days.
- When the popup window notifying user addition opens, click the Confirm button. The ID Center user login information popup window will open.
- ID Center check the user login information, then click the confirm button.
| Classification | Detailed Description |
|---|---|
| Access Portal URL | URL information to access the Access Portal |
| User Name | Created User Name |
| password | the password of the authenticated user
|
| Excel Download | Download ID Center user login information as an Excel file |
| Email transmission | An Excel file containing ID Center user login information is sent via email
|
Table. ID Center user login information items
Check user details
You can check and manage detailed information about the user, user groups, and account information.
To check the user details, follow the next procedure.
- All services > Management > ID Center menu, click. It moves to the Service Home page of ID Center.
- Service Home page, click the User menu. It moves to the User List page.
- User List page, click the username to check the detailed information. It moves to the User Details page.
- User Details page displays basic information, and consists of Basic Information, User Group, Account tabs.
Basic Information
You can check the user’s basic information and modify the user’s description and options if necessary.
| Category | Detailed Description |
|---|---|
| Delete User | Button to delete the user
|
| User Name | The user’s name |
| User Real Name | The user’s actual name
|
| Description | A description of the username
|
| Last Login | The time when the user last logged in |
| Password | Password last changed time
|
| Password reuse restriction | The number of recently used passwords that cannot be set as a password
|
Email authentication status
| |
| Mobile Phone Number | Mobile Phone Number Authentication Status |
| affiliation information | user’s business unit, department, administrator, employee number information
|
Table. User's basic information tab items
User Group
The user can check the registered user group and add or exclude the user group as needed.
Reference
User Group details can be found in User Group, please refer to it.
| Category | Detailed Description |
|---|---|
| Exclusion | Exclude the selected user group from the user group list
|
| Add user group | Add a user group to register users
|
| User Group Name | Name of the User Group |
| description | description of the user group |
| Revision Time | The time when the user group was revised |
Fig. User's user group tab items
Account
You can check the Account assigned to the user and add a set of permissions or assign an Account as needed.
Note
- Permission Set details can be found in Permission Set.
- Account Assignment에 대한 자세한 내용은 Account Assignment을 참고하세요.
| Classification | Detailed Description |
|---|---|
| Add permission set | Add a new permission set to the Account
|
| View more > Exclude all direct applications | Exclude all permission sets directly applied to the Account
|
| Account assignment | Assign a new account to the user
|
| Account name | Account’s name |
| Set of permissions | Number of sets of permissions applied to the Account
|
| Application method | Method of applying the set of privileges to the Account
|
Fig. User's Account tab items
Change password
You can change the user’s password.
To change the user’s password, follow the following procedure.
- All services > Management > ID Center menu, click. It moves to the Service Home page of ID Center.
- Service Home page, click the User menu. It moves to the User List page.
- User List page, click the username to change the password. It moves to the User Details page.
- User Details page, click the Password item’s Edit button. The Password Reset popup window opens.
- Password Reset popup window, set the password, then click the Confirm button. ID Center User Login Information popup window will open.
- Auto Generation: Automatically generate a password
- Direct Input: Refer to the password creation rules and enter directly
Password Creation Rules
- Uppercase letters (English), lowercase letters (English), numbers, special characters (
!@#$%&*^) must each be included at least once. - The length is 9~20 characters.
- ID or username cannot be used as a password.
- The same character cannot be used three times or more.
- Easily guessable passwords cannot be used.
- Recently used passwords cannot be used.
- 4 characters or more of continuous characters/numbers cannot be used.
- The password change cycle is 90 days.
- ID Center user login information popup window, check the user information after, confirm button click.
| Classification | Detailed Description |
|---|---|
| Access Portal URL | URL information to access the Access Portal |
| User Name | Created User Name |
| password | the password of the authenticated user
|
| Excel Download | Download ID Center user login information as an Excel file |
| Email transmission | An Excel file containing ID Center user login information is sent via email
|
Table. ID Center user login information items
Add user group
You can add a new user group.
To add a user group, follow the following procedure.
All services > Management > ID Center menu, click. It moves to the Service Home page of ID Center.
Service Home page, click the User menu. It moves to the User List page.
User List page, click the username to add to the user group. It moves to the User Details page.
User Details page, click the User Group tab. The user group list will be displayed.
Add User Group button will be clicked. It moves to the Add User Group page.
Add User Group page, select the user group to be added from the user group list, and then click the Complete button.
Classification NecessityDetailed Description Added user group - Name of the user group that the user was added to User Group Required Select a user group to add users to - If selected, add to Added User Group item
Table. Items to Add User GroupWhen the popup window notifying the addition of a user group opens, click the Confirm button.
Add permission set
You can add a set of permissions to the Account.
To add a set of permissions to the Account, follow the following procedure.
All services > Management > ID Center menu, click. It moves to the Service Home page of ID Center.
Service Home page, click the User menu. It moves to the User List page.
User List page, click the username to add the permission set. It moves to the User Details page.
User Details page, click the Account tab. The list of accounts will be displayed.
Select the Account to add a set of permissions from the Account list, then click the Add Permission Set button. It moves to the Add Permission Set page.
Add Permission Set page’s permission set list, select the permission set you want to add, then click the Complete button.
Classification NecessityDetailed Description Selected Account - Account name to add permission set Applied permission set - Name of the permission set applied to the selected Account Permission Set Required Select one or more permission sets to apply to the Account - When selected, add to the Applied Permission Set item
Table. Adding Permission Set ItemsWhen the popup window notifying the addition of the authority set opens, click the Confirm button.
Account assignment
You can assign a new Account to the user.
To assign a new Account, follow the next procedure.
- All services > Management > ID Center menu, click. It moves to the Service Home page of ID Center.
- Service Home page, click the User menu. It moves to the User List page.
- User List page, click the username to assign the Account. It moves to the User Details page.
- User Details page, click the Account tab. The list of accounts will be displayed.
- Account Assignment 버튼을 클릭하세요. Account Assignment 페이지로 이동합니다.
- Account assignment page where you assign the account to be assigned and the set of privileges to be applied to the account, click the Complete button.
Classification MandatoryDetailed Description Account Selection Required Select the Account to be assigned to the user - Hierarchical Structure View: Display Accounts in the form of the organization’s hierarchical structure
- Account List View: Display Accounts in a list format
Permission Set Selection Required Select the permission set to be applied to the selected Account Table. Assigning User Account Items
Notice
If there is no IAM policy name that matches the custom policy name of the selected permission set, you cannot assign an Account.
- Account 할당을 사용자 그룹 추가를 알리는 팝업창이 열리면 확인 버튼을 클릭하세요 -> 7. When the popup window notifying the addition of a user group to the account allocation opens, click the Confirm button.
Delete user
To delete a user, follow the following procedure.
- All services > Management > ID Center menu is clicked. It moves to the Service Home page of ID Center.
- Service Home page, click the User menu. It moves to the User List page.
- Select one or more users to delete from the user list.
- After confirming the selected users, click the delete button.
- You can also delete them individually from the user details page of the user to be deleted.
- When a popup window notifying user deletion opens, click the Confirm button.
5.2.2 - ID Center User Group Management
ID Center’s user group can be checked and managed.
Create a user group
You can create a user group and add it to the ID Center.
To create a user group, follow the following procedure.
All services > Management > ID Center menu, click. It moves to the Service Home page of ID Center.
Service Home page, click the User Group menu. It moves to the User Group List page.
User Group List page, click the Create User Group button. Move to the Create User Group page.
Create User Group page, enter the basic information and additional information, then click the Complete button.
Classification NecessityDetailed Description User Group Name Required Enter the name of the user group - Use English letters, numbers, and special characters (
+=-_@,.) to enter within 3-30 characters
Description Select Enter a description of the user group within 1,000 characters Add User Select Select a user to add to the user group - Displays a list of users registered in the account
- To create a new user, refer to Create User
- If there are no users to add when linked to AD, add the user from the AD provider and proceed with synchronization on the ID Center Settings > Credential Source page
Table. User Group Creation Information- Use English letters, numbers, and special characters (
When the popup window notifying the addition of a user group opens, click the Confirm button.
Check user group detailed information
You can check and manage detailed information about the user group and user group, account information.
To check the user group details, follow the following procedure.
- All services > Management > ID Center menu is clicked. It moves to the Service Home page of ID Center.
- Service Home page, click the User Group menu. It moves to the User Group List page.
- User Group List page, click the user group name to check the detailed information. It moves to the User Group Details page.
- User Group Details page displays basic information, and consists of Basic Information, User, Account tabs.
Basic Information
You can check the basic information of the user group and modify the description and options of the user group if necessary.
| Classification | Detailed Description |
|---|---|
| Delete user group | A button to delete the user group |
| User Group Name | The name of the user group |
| User Group ID | The ID of the user group |
| Creator | The user who created the service |
| Creation Time | The time when the service was created |
| Editor | User who modified the service information |
| Revision Time | Time when service information was revised |
| User Group Name | The name of the user group
|
| Description | A description of the user group name
|
Table. Basic information tab items of user group
User
You can check the users registered in the user group and add or exclude users as needed.
Reference
User details can be found in the User guide.
| Classification | Detailed Description |
|---|---|
| Exclusion | Excludes the user selected from the user list
|
| Add User | Add a user group to be registered in the user group
|
| Username | User’s Name |
| User Group | Number of user groups the user is registered to |
| Creation Time | The time when the user was created |
Table. User tab items of the user group
Account
You can check the Account assigned to the user and add a set of permissions or assign an Account as needed.
Reference
- Permission Set details can be found in Permission Set.
- Account Assignment에 대한 자세한 내용은 Account Assignment을 참고하세요. should be translated to: * Account Assignment for more information, please refer to Account Assignment.
| Classification | Detailed Description |
|---|---|
| Add permission set | Add a new permission set to the Account
|
| More > Cancel Assignment | Cancel the assignment of the selected Account
|
| Account assignment | Assign a new Account to the user group
|
| Account name | Account’s name |
| Permission Set | Number of permission sets applied to the Account
|
Table. Account tab items of the user group
Add User
You can add a new user to the user group.
To add a user, follow the following procedure.
All services > Management > ID Center menu is clicked. It moves to the Service Home page of ID Center.
Service Home page, click the User Group menu. It moves to the User Group List page.
User Group List page, click the user group name to add a user, it will move to the User Group Details page.
User Group Details page, click the User tab. The user list will be displayed.
Add User button should be clicked. It moves to the Add User page.
Add User page’s user list, select the user you want to add, then click the Complete button.
Classification MandatoryDetailed Description Added User - Name of the user group to which the user is added User Required List of user groups to which no users have been added - Display the list of users registered in the account
- When selected, add to the added user item
- To create a new user, refer to Create a user
- If there are no users to add when linked to AD, add the user from the AD provider and proceed with synchronization on the ID Center Settings > Credential Source page
Table. Add User ItemsCheck if the added user has been added to the list.
Add permission set
You can add a set of permissions to the Account.
To add a set of permissions to an Account, follow these procedures.
All services > Management > ID Center menu, click. It moves to the Service Home page of ID Center.
Service Home page, click the User Group menu. It moves to the User Group List page.
User Group List page, click the user group name to add the permission set. It moves to the User Group Details page.
User Group Details page, click the Account tab. The account list will be displayed.
Select the Account to add a set of permissions from the Account list, then click the Add Permission Set button. It moves to the Add Permission Set page.
Add Permission Set page, select the permission set you want to add from the list of permission sets, and then click the Complete button.
Classification MandatoryDetailed Description Selected Account - Account name to add permission set Applied permission set - Name of the permission set applied to the selected Account Permission Set Required Select one or more permission sets to apply to the Account - When selected, add to the Applied Permission Set item
Table. Adding Permission Set ItemsPlease check if the added set of permissions has been applied to the Account.
Account assignment
You can assign a new account to the user group.
To assign a new Account, follow the next procedure.
- All services > Management > ID Center menu is clicked. It moves to the Service Home page of ID Center.
- Service Home page, click the User Group menu. It moves to the User Group List page.
- User Group List page, click the user group name to assign to the Account. It moves to the User Group Details page.
- User Group Details page, click the Account tab. The account list will be displayed.
- Account Assignment 버튼을 클릭하세요. Account Assignment 페이지로 이동합니다.
- Account assignment page where you assign an account and select a set of permissions to be applied to the account, click the Complete button.
Classification NecessityDetailed Description Account Selection Required Select the Account to be assigned to the user group - Hierarchical View: Display Accounts in the form of the organization’s hierarchical structure
- Account List View: Display Accounts in the form of a list
Permission Set Selection Required Select the permission set to be applied to the selected Account Table. Assigning Account Items
Notice
If there is no IAM policy name that matches the custom policy name of the selected permission set, you cannot assign an Account.
- Check if the added Account has been assigned to the user.
Delete user group
To delete a user group, follow the following procedure.
- All services > Management > ID Center menu, click. It moves to the Service Home page of ID Center.
- Service Home page, click the User Group menu. It moves to the User Group List page.
- Select one or more user groups to delete from the user group list.
- After verifying the selected user group, click the Delete User Group button.
- You can also delete them individually from the User Group Details page of the user group to be deleted.
- When a pop-up window notifying the deletion of the user group opens, click the Confirm button.
5.2.3 - ID Center Account assignment
ID Center’s Account can be checked and assigned to a user or a user group.
Account assignment
You can assign an Account to a user or a user group.
To assign an Account, follow the following procedure.
- All services > Management > ID Center menu, click. It moves to the Service Home page of ID Center.
- Service Home page, click the Account assignment menu. It moves to the Account list page.
- Account list page, select the account to be assigned, and then click the Assign to user or group button. It moves to the Assign to user or group page.
- Assign to user or group page’s Select assignment target area, select the assignment target, then click the Next button.
- You must select at least one user or user group to assign to the Account.
Classification NecessityDetailed Description Account to Assign - Name of the Account to assign to a user or a group of users User Select Select the user to assign the Account to User Group Select Select the user group to assign the Account Table. Selecting account allocation target items
Permission Set Selection area, select the permission set to be applied to the Account, and then click the Next button.
Classification MandatoryDetailed Description Account to Assign - Name of the Account to assign to a user or a group of users Permission Set Required Select one or more permission sets to apply to the Account Table. Account Permission Set Selection ItemsInput Information Confirmation area, check the assignment target and authority set, then click the Complete button.
Account allocation notification popup window opens, click the Confirm button.
Account detailed information check
You can check and manage detailed information about the account, the target to be assigned, and the set of authorities.
To check the detailed information of the Account, follow the next procedure.
- All services > Management > ID Center menu, click. It moves to the Service Home page of ID Center.
- Service Home page, click the Account assignment menu. It moves to the Account information page.
- Account information 페이지에서 상세 정보를 확인할 Account를 클릭하세요. Account details 페이지로 이동합니다.
- Account Details page displays basic information, and consists of Basic Information, Assignment Targets, Permission Sets tabs.
Basic Information
Account’s basic information can be checked.
| Classification | Detailed Description |
|---|---|
| Account name | Account full name |
| Account ID | Account’s ID |
| Creator | The user who created the Account |
| Creation Time | Time when the Account was created |
| Editor | User who modified the Account |
| Revision Time | Time when the Account was revised |
Table. Account Basic Information Tab Items
Assignment Target
Account can check and manage the assigned user and user group.
Reference
User details can be found in the User guide.
| Classification | Detailed Description |
|---|---|
| Revoke Assignment | Revoke the account assignment for the selected user or user group
|
| View more > Add permission set | Add a permission set to the selected Account
|
| Assign to user or group | Assign the selected Account to a new user or user group
|
| Assignment Target Name | Assignment Target’s Name |
| Target Type | Type of assigned target (user, user group) |
| Permission Set | Number of permission sets applied to the Account
|
Table. Account Allocation Target Tab Items
Authority Set
Account에 applied 권한 set를 확인하고 필요한 경우, 제외할 수 있습니다 becomes Account applied authority set can be checked and excluded if necessary, However the correct translation is: The set of permissions applied to the Account can be checked and excluded if necessary,
| Classification | Detailed Description |
|---|---|
| Exclusion of permission set | Excludes the selected permission set from the Account
|
| Permission Set Name | The name of the permission set |
| Description | Description of the set of permissions |
| Revision Time | The time the permission set was last modified |
Table. Account Permission Set Tab Items
Add permission set
You can add a set of permissions to an account assigned to a user or a group of users.
To add a set of permissions to an Account, follow these procedures.
All services > Management > ID Center menu, click. It moves to the Service Home page of ID Center.
Service Home page, click the Account assignment menu. It moves to the Account list page.
Account list 페이지에서 할당할 Account를 클릭하세요. Account details 페이지로 이동합니다. -> 3. Account list page, click the Account to be assigned. It moves to the Account details page.
Account details page, click the target allocation tab. The list of allocation targets will be displayed.
After selecting the assignment target to which you want to add a permission set from the list of assignment targets, click the More > Add Permission Set button. It moves to the Add Permission Set page.
Add Permission Set page, select the permission set you want to add from the list of permission sets, then click the Complete button.
Classification MandatoryDetailed Description Assignment Target - Name of the assignment target to which the permission set is to be added Applied permission set - Name of the permission set applied to the selected Account Permission Set Required Select one or more permission sets to apply to the Account - When selected, add to the Applied Permission Set item
Table. Adding Permission Set ItemsWhen the popup window notifying the addition of the permission set opens, click the Confirm button.
Please confirm that the added set of permissions has been applied to the Account.
Add additional assignments to a user or group
You can additionally assign an Account to new users or user groups.
To assign an Account to a new user or a group of users, follow the next procedure.
- All services > Management > ID Center menu, click. It moves to the Service Home page of ID Center.
- Service Home page, click the Account assignment menu. It moves to the Account list page.
- Account list 페이지에서 할당할 Account를 클릭하세요. Account details 페이지로 이동합니다. -> 3. Account list page, click the Account to be assigned. It moves to the Account details page.
- Account details page, click the target allocation tab.
- Assignment target tab, click the Assign to user or group button. Move to the Assign to user or group page.
- Select Target area, select the target to be assigned, then click the Next button.
- You must select at least one user or user group to assign to the Account.
Classification NecessityDetailed Description Assigned User - The current account assigned user name User Select Select a user to assign to the Account - When selected, it is added to the Assigned User item
- To create a new user, refer to Create User
- If there are no users to add when linked to AD, add the user from the AD provider and proceed with synchronization on the ID Center Settings > Credential Source page
Assigned User Group - Name of the user group to which the current Account is assigned User Group Select Select the user group to assign the Account to - When selected, it is added to the Assigned User Group item
Table. Selecting Items for Account Allocation
Permission Set Selection area, select the permission set to be applied to the Account, and then click the Next button.
Classification MandatoryDetailed Description Permission Set Required Select one or more permission sets to apply to the Account Table. Account Permission Set Selection ItemsInput Information Confirmation area, check the assignment target and authority set, then click the Complete button.
Account allocation notification popup window opens, click the Confirm button.
Account assignment cancellation
To cancel the account assignment for a user or a user group, follow the following procedure.
- All services > Management > ID Center menu, click. It moves to the Service Home page of ID Center.
- Service Home page, click the Account assignment menu. It moves to the Account list page.
- Account list 페이지에서 할당할 Account를 클릭하세요. Account details 페이지로 이동합니다. -> 3. Account list page, click the Account to be assigned. It moves to the Account details page.
- Account details page, click the Target allocation tab. The list of allocation targets will be displayed.
- Select the assignment target to be canceled from the list of assignment targets and then click the Cancel Assignment button.
- Account allocation cancellation notification popup window opens, click the Confirm button.
5.2.4 - ID Center Permission Set Management
You can check and manage the set of permissions for the ID Center.
Create a set of permissions
You can create a set of permissions and add it to the ID Center.
To create a set of permissions, follow these steps.
- All services > Management > ID Center menu is clicked. It moves to the Service Home page of ID Center.
- On the Service Home page, click the Authority set menu. It moves to the Authority Set List page.
- On the Authority Set List page, click the Create Authority Set button. It moves to the Create Authority Set page.
- On the Create Permission Set page, in the Enter Basic Information section, enter the basic information and then click the Next button.
| Classification | Necessity | Detailed Description |
|---|---|---|
| Permission Set Name | Required | Enter the name of the permission set
|
| Enter a description of the permission set within 1,000 characters | ||
| Maximum Session Duration | Required | Enter the session time allowed for the user when accessing the Console through the Access Portal
|
Table. Permission Set Basic Information Items
- In the 권한 세트 설정 area, select a policy to use and set the policy, then click the 다음 button.
| Classification | Necessity | Detailed Description |
|---|---|---|
| Default Policy | Optional | Connects the default policy provided by Samsung Cloud Platform Console
|
| Custom Policy | Optional | Link the custom policy created under the Account
|
| Inline Policy | Optional | Set the policy to be applied to the permission set directly
|
Table. Permission Set Setting Items
Notice
The permission set can have up to 20 policies linked to it, which is the sum of the default policies and custom policies.
- In the 입력 정보 확인 area, check the basic information and permission policies of the permission set, and then click the 완료 button.
- When the popup window for creating a set of permissions opens, click the Confirm button.
Check details of permission set
You can check and manage detailed information about the permission set, user group, and account information.
To view detailed information about a set of permissions, follow these steps.
- Click all services > Management > ID Center menu. It moves to the Service Home page of ID Center.
- On the Service Home page, click the 권한 세트 menu. It moves to the 권한 세트 목록 page.
- On the Authority Set List page, click the authority set to view detailed information. It moves to the Authority Set Details page.
- Authority Set Details page displays basic information and consists of Basic Information, Authority, Account tabs.
Basic Information
You can check and modify the basic information of the permission set.
| Classification | Detailed Description |
|---|---|
| Permission Set Delete | Button to delete the permission set |
| Service | Service Name |
| Resource Type | Resource Type |
| SRN | Unique resource ID in Samsung Cloud Platform |
| Resource Name | Resource Name
|
| Resource ID | Unique Resource ID |
| Creator | User who created the service |
| Creation Time | Time when the service was created |
| Modifier | User who modified the service information |
| Modified Time | Time when service information was modified |
| Permission Set Name | Policy Name |
| Maximum session persistence time | The session time allowed for users when accessing the Console through the Access Portal
|
| Description | Description of policy name
|
Table. Basic information tab items of the authority set
Authority
You can view and manage policies attached to a set of permissions.
| Classification | Detailed Description |
|---|---|
| Default Policy | The default policy linked to the set of permissions
|
| User-defined policy | User-defined policies linked to the authority set
|
| Inline Policy | Service name of inline policy connected to the authority set
|
Table. Authority information items of the authority set
Account
You can check and modify the account information of the authority set.
| Classification | Detailed Description |
|---|---|
| Account name | Account Name |
| Account ID | Account ID |
| Account’s Email |
Table. Account tab items of the permission set
Connect Basic Policy
You can attach a new default policy to the set of permissions.
To link a basic policy, follow these procedures.
- Click on 모든 서비스 > Management > ID Center menu. It moves to the Service Home page of ID Center.
- On the Service Home page, click the 권한 세트 menu. It moves to the 권한 세트 목록 page.
- On the Authority Set List page, click the authority set to link to the basic policy. It moves to the Authority Set Details page.
- Authority Set Details page, click the Authority tab.
- Click the Policy Link button in the Basic Policy area. It moves to the Basic Policy Link page.
- On the Basic Policy Linkage page, select the policy you want to link from the list of basic policies, and then click the Complete button.
| Classification | Necessity | Detailed Description |
|---|---|---|
| Connected Base Policy | - | Name of the base policy connected to the authority set |
| Default Policy Link | Required | Select the default policy to link to the authority set
|
Fig. Attaching a Default Policy to a Permission Set Item
- When the policy connection notification popup window opens, click the Confirm button.
Connect custom policies
You can attach a new custom policy to a set of permissions.
To link a custom policy, follow these steps.
- Click all services > Management > ID Center menu. It moves to the Service Home page of ID Center.
- On the Service Home page, click the Authority Set menu. It moves to the Authority Set page.
- On the Authority Set List page, click the authority set to which you want to attach a custom policy. It moves to the Authority Set Details page.
- Authority Set Details page, click the Authority tab.
- Click the Policy Link button in the Custom Policy area. It moves to the Custom Policy Link page.
- Custom Policy Connection page, select the policy you want to connect from the list of custom policies, and then click the Complete button.
| Classification | Necessity | Detailed Description |
|---|---|---|
| Connected User-Defined Policy | - | Default Policy Name Connected to the Authority Set |
| User-defined policy linking | Required | Enter the user-defined policy to be linked to the permission set directly
|
Table. Items for attaching custom policies to permission sets
- When the policy connection notification popup window opens, click the Confirm button.
Creating an inline policy
You can modify the inline policies attached to a set of permissions.
To modify the in-line policy, follow the next procedure.
- Click all services > Management > ID Center menu. It moves to the Service Home page of ID Center.
- On the Service Home page, click the Authority Set menu. It moves to the Authority Set List page.
- On the Authority Set List page, click the authority set you want to modify the in-line policy for. It moves to the Authority Set Details page.
- Authority Set Details page, click the Authority tab.
- In the 인라인 정책 area, click the 정책 생성 button. This will take you to the 인라인 정책 생성 page.
- On the 인라인 정책 생성 page, in the 권한 설정 section, select the policy setting method and the service to apply, then click the 다음 button.
| Classification | Necessity | Detailed Description |
|---|---|---|
| Basic Mode/JSON Mode | Required | Select the policy setting method
|
| Service | Required | Select the service to set the policy
|
Table. Inline Policy Creation - Service Settings
Caution
In policy settings, we provide default mode and JSON mode.
- When entering JSON mode or moving the screen after writing in basic mode, services with duplicated control requirements are integrated into one, and services with incomplete settings are deleted.
- JSON mode where the contents written in does not match the JSON format can not be converted to default mode.
- After setting the permissions, click the Next button.
- To register individual resources as applied resources, please refer to Registering individual resources as applied resources and proceed.
| Classification | Necessity | Detailed Description |
|---|---|---|
| Control Type | Required | Policy Control Type Selection
|
| Action | Required | Select actions provided by each service
|
| Applied Resource | Required | Resource to which the action is applied
|
| Authentication Type | Required | Authentication method for the target users to apply the policy
|
| Applied IP | Required | IP that allows policy application
|
| Additional Conditions | Optional | Add conditions for Attribute-Based Access Control (ABAC)
|
Table. Policy Creation - Permission Setting
- Check Input Information page, check the entered information and click the Complete button.
- If the policy modification notification popup window opens, click the Confirm button.
Registering individual resources as applied resources
You can register individual resources as applied resources when setting permissions.
To register individual resources as applied resources, follow the next procedure.
- Select an action where individual resources can be selected from the action options.
- Actions that allow individual resource selection are displayed in purple.
- Applied Resource에서 Individual Resource을 클릭하세요.
- Click the Add Resource button. The Add Resource popup window will open.
| Classification | Necessity | Detailed Description |
|---|---|---|
| Free Type | Required | Select the type of resource to add |
| SRN | - | Unique resource ID in Samsung Cloud Platform
|
| Account | Required | Account ID setting
|
| Region | Select | Directly enter the region information of the resource within 100 characters
|
| Resource ID | Required | Directly enter the resource ID to be added within 100 characters
|
Fig. Policy Creation - Registering Individual Resources as Applied Resources
Delete permission set
Notice
If a set of permissions is applied to an Account, it cannot be deleted.
To delete a set of permissions, follow these steps.
- All services > Management > ID Center menu is clicked. It moves to the Service Home page of ID Center.
- On the Service Home page, click the 권한 세트 menu. It moves to the 권한 세트 목록 page.
- Select one or more authorization sets to delete from the authorization set list.
- After confirming the selected set of permissions, click the Delete button. You can also delete them individually from the Delete permission set’s Permission set details page.
- When the popup window notifying the deletion of the permission set opens, click the Confirm button.
5.2.5 - ID Center Access Portal use
Access Portal을 통해 Account 자원에 접근하고 이용할 수 있습니다. -> Access Portal through which you can access and use Account resources.
Notice
- To use Access Portal, you must be registered as a user in the ID Center of the Samsung Cloud Platform Console.
- For more information about user registration, please refer to Create User.
Access Portal first access
Access Portal에 처음으로 접속할 때에는 서비스 요청을 통해 Access Portal 접속 URL을 신청한 후, 로그인해야 합니다. -> When accessing the Access Portal for the first time, you must apply for the Access Portal access URL through a service request and then log in.
Access Portal connection URL application
Samsung Cloud Platform Console에서 service request을 통해 Access Portal 접속 URL을 신청할 수 있습니다 should be translated to: Samsung Cloud Platform Console where you can apply for Access Portal access URL through a service request.
Access Portal connection URL을 신청하려면 is translated to: To apply for Access Portal connection URL, please follow the next procedure: becomes To apply for Access Portal connection URL, please follow the next procedure, so the translation is: To apply for Access Portal connection URL, please follow the next procedure.
All services > management > ID Center menu, click. It moves to the Service Home page of ID Center.
Service Home page, click the ID Center settings button. It moves to the ID Center settings page.
Access Portal URL item, click the URL application button. It moves to the service request page of the Support Center.
Classification NecessityDetailed Description title required Title for Access Portal URL application - Use Hangul, English, numbers, and special characters (
+=,.@-_) to enter within 64 characters
Region Required Select a region to apply for Access Portal URL Service Required Management service group’s ID Center service selection Task Classification Required Apply for Access Portal URL Optional Content Required Information input for Access Portal URL application Table. Access Portal URL Request Items- Use Hangul, English, numbers, and special characters (
Check the input information and click the request button.
Notice
- After requesting the service, you cannot modify or delete the written content.
- After requesting a service, you can check the details of the request on the Service Request List page of the Support Center. Please refer to Checking Service Request Details for more information.
Access Portal Initial Login
Access Portal for the first time, please follow the following procedure.
- 로그인 페이지에서 사용자명과 비밀번호를 입력하세요. -> 1. On the login page, enter your username and password.
Notice
Username and Password information, please contact the ID Center administrator.
Select a means to send the authentication number, and click the Send Authentication Number button.
Enter the received authentication number and click the next button. A pop-up window for multi-authentication (MFA) self-authentication will open.
Multi-factor authentication (MFA) for self-identification In the popup window for MFA self-identification, complete the personal information input and terms confirmation for MFA, then click the Confirm button. The Password Change popup window will open.
Item MandatoryDescription Automatic input prevention Required Enter the characters output in the image into the input window and click the Confirm button Mobile phone number Required Enter mobile phone number - Enter the mobile phone number and click the authentication button to issue an authentication number
- Enter the authentication number issued to your mobile phone and click the confirm button
- If the authentication number is valid, the identity verification is complete
Email Required Enter the email to be used for self-authentication within 60 characters - For accounts linked to the AD type as the authentication source, select Provide email information registered on the AD side as Read-Only
Region Required Region selection for personal information collection Personal information collection and use Required After checking the terms and conditions for personal information collection and use, check I agree Table. Self-authentication items for multi-factor authentication (MFA)Password Change popup window, enter the password change information and click the Confirm button. The Access Portal Terms of Service popup window will open.
Item MandatoryDescription Existing password Required Enter the password received from the ID Center administrator New Password Required Enter directly referring to the password creation rules Password Confirmation Required Re-enter the password to use Table. Password Change Items
Password Creation Rules
- Uppercase letters (English), lowercase letters (English), numbers, special characters (
!@#$%&*^) must each be included at least once. - The length is 9~20 characters.
- ID or username cannot be used as a password.
- The same character cannot be used three times or more.
- Easily guessable passwords cannot be used.
- Recently used passwords cannot be used.
- 4 characters or more of consecutive characters/numbers cannot be used.
- The password change cycle is 90 days.
- Access Portal terms of use after confirmation, confirm button click. Access Portal page to move.
Access Portal Login
Guidance
- If you are accessing the Access Portal for the first time, refer to Access Portal initial access to apply for the Access Portal URL first, and then log in.
Access Portal에 로그인하려면 다음 절차를 따르세요. -> To log in to Access Portal, follow the following procedure:
- Enter the Access Portal connection URL received through the service request in the browser’s address input window. It moves to the Access Portal login page.
- 로그인 페이지에서 사용자명과 비밀번호를 입력하세요. -> 2. On the login page, enter your username and password.
- Select a means to send the authentication number and click the next button. It moves to the authentication number confirmation page.
- If you do not receive the authentication number or it has expired, click the Resend Authentication Number button to request the authentication number again.
- Enter the received authentication number and click the 로그인 button, which translates to enter the received authentication number and click the login button, you will be moved to the Access Portal page.
ID/Password Find
- ID or password is lost, in the case of password find button, click, Access Portal registered email or phone number to change using available.
- Accounts linked to AD type certification source have password retrieval restricted, please contact the ID Center administrator.
Caution
- Please enter your password and authentication number correctly. If you enter your password or authentication number incorrectly more than 5 times, your account will be locked for security reasons.
- If the account is locked, it provides the user with the locked account information.
Access Portal usage
Access Portal에 로그인하면 Access Portal 페이지로 이동합니다 translates to: When you log in to Access Portal, it moves to the Access Portal page. Access Portal page is composed of Account tab and My Info tab.
Account
You can check the account and set of permissions assigned to the user and access the Samsung Cloud Platform Console with the account’s set of permissions.
Temporary Key Issuance can be used to obtain a temporary key to access the Account.
| Classification | Detailed Description |
|---|---|
| Account list | Assigned account name and ID to the user, root user email information
|
| Permission Set List | Permission set applied to Account
|
Table. Account tab items
My Info.
You can check the user’s basic information and modify the user’s description and options if necessary.
| Classification | Detailed Description |
|---|---|
| User Name | The user’s name |
Email to be used for self-authentication
| |
| Mobile phone number | Mobile phone number to use for self-authentication
|
| Last Login | The time when the user last logged in |
| Password | Password last changed time
|
| Password Reuse Restriction | The number of recently used passwords that cannot be set as a password
|
| Time Zone | User Time Zone(Time Zone)
|
| Terms and Conditions | Terms and Conditions agreement status
|
Table. My Info. Tab Items
Password Generation Rules
- Uppercase letters (English), lowercase letters (English), numbers, special characters (
!@#$%&*^) must each be included at least once. - The length is 9~20 characters.
- ID or username cannot be used as a password.
- You cannot use the same character three times or more.
- Easily guessable passwords cannot be used.
- Recently used passwords cannot be used.
- 4 characters or more of continuous characters/numbers cannot be used.
- The password change cycle is 90 days.
Account
You can check the account and permission set assigned to the user and access the Samsung Cloud Platform Console with the account’s permission set or receive an access token for access.
| Classification | Detailed Description |
|---|---|
| Account list | Assigned account name and ID to the user, and root user email information
|
| Permission Set List | Permission set applied to Account
|
Table. Account Tab Items
Issue Certificate
Access Portal에서 Samsung Cloud Platform Console에 접속하기 위한 임시키를 발급받을 수 있습니다. -> Access Portal where you can obtain an API key to access the Samsung Cloud Platform Console. To receive the IMSI key, follow the next procedure.
- Enter the Access Portal access URL received through the service request in the browser’s address input window. It moves to the Access Portal login page.
- Log in to Access Portal. Access Portal page will be moved.
- Access Portal page, click the Account tab. It moves to the Account tab.
- Click the Issue License Key button of the license set for which you want to issue a license key in the license set list. A pop-up window announcing the issue of the license key will open.
- Check the account name, then click the Confirm button. The ID Center Issuance popup window will open.
- Check the issuance information, then click the Confirm button.
Caution
- ID Center issuance popup window’s information cannot be checked again, so please be careful.
- In case the license key issuance information is lost, the license key must be re-issued.
5.3 - Release Note
ID Center
2025.10.23
FEATURE
AD (Active Directory) Credential Linkage Provision- You can choose to use AD (Active Directory) as a credential source.
- AD (Active Directory) is used so that users can directly manage the authentication source.
2025.07.01
NEW
ID Center Service Official Launch- ID Center service has been officially launched.
- You can manage to perform tasks according to user permissions by creating authority policies for each service and assigning policies and accounts linked to the Organization service to users.
- Access Portal을 통해 권한이 있는 ID Center 사용자만 접근하도록 보안을 강화할 수 있습니다 -> * Security can be enhanced to allow only authorized ID Center users to access through the Access Portal.
6 - Logging&Audit
6.1 - Overview
Service Overview
Logging&Audit saves the history of all tasks performed by the user, allowing it to be used for change tracking, troubleshooting, security checks, and more on cloud resources. The collected task history can be checked for 90 days, and can be stored in the user’s Object Storage through Trail creation and management.
Provided Features
Logging&Audit provides the following functions.
- Work Log Collection: All logs that occur are collected and stored in real-time. For the entire log collected from multiple servers and services, search is possible through web-based Console by various conditions such as resource type, resource name, period, and worker name.
- Activity Record Audit: All recorded activity history is stored for 90 days and can be checked at any time through the Console.
- Log Management: While using cloud services, numerous logs generated can be stored in the user’s Object Storage by creating a Trail.
- Log Integrity Verification: After creating a trail, you can verify if the log files stored in Object Storage have been changed, modified, or deleted through the log file verification function.
Component
Activity History
It can be used for change tracking, troubleshooting, security checks, and more by storing all activity records performed by users in cloud resources. It stores activity records for 90 days without separate settings, and effective log management is possible by analyzing logs using various search functions.
Trail
Trail allows you to store user activity records that occur through Console and API calls in Object Storage for a long time. In addition, you can select the services and accounts you want to save and use them to track changes to cloud resources, troubleshoot, and perform security checks.
Preceding Service
This is a list of services that must be pre-configured before creating the service. Please refer to the guide provided for each service and prepare in advance for more details.
| Service Category | Service | Detailed Description |
|---|---|---|
| Storage | Object Storage | Object storage that is convenient for data storage and search |
Fig. Logging&Audit Preceding Service
6.2 - How-to guides
The user can check the activity history through the Samsung Cloud Platform Console, and store the corresponding activity history using the Trail service without any time restrictions. When problems such as security risks or resource change history occur, you can check this activity history to identify the cause of the problem.
Note
Activity records will be deleted after 90 days. If long-term storage is necessary, create a Trail and store it in Object Storage. For more information, see Creating a Trail.
Activity Record Inquiry
To check the list of user’s activity history, please follow the following procedure.
- All services > Management > Logging&Audit menu is clicked. It moves to the Service Home page of Logging&Audit.
- Service Home page, click the activity record menu. It moves to the activity record list page.
- Activity Record List page where you can check the activity record.
Classification Detailed Description file download save activity history list in JSON or CSV file format Period Filter Select the list search period - All, Last 30 minutes, Last 1 hour, Last 12 hours, Direct Input to choose from
- Direct Input: Start and end times can be entered
Time Zone Select a searchable time zone Search input window Enter search terms to search the list Detailed Search Search by category by entering search terms or selecting information to search the list Setting Icon Setting of column items to be displayed in the list Table. List of activity record items
Guidance
- The list is automatically refreshed every 1 minute.
- The list will only show the list of selected regions.
Activity Record Comparison
You can select up to 5 work histories from the activity record list to compare information.
If you check and select the work history you want to compare, it will be added to the Activity Comparison page, where you can compare and check the information.
Activity record detailed information check
You can check the list of all activity records and detailed information. The activity record details page consists of work history details, activity record details tabs.
To check the detailed information of the activity record, follow the next procedure.
- All services > Management > Logging&Audit menu is clicked. It moves to the Service Home page of Logging&Audit.
- Service Home page, click the activity history menu. It moves to the activity history list page.
- Activity Record List page, click on the activity record to check the detailed information. It moves to the Activity Record Details page.
- Activity Details page consists of Work History Details, Work Details tabs.
Work History Details
Work History Details page where you can check the detailed information of the work history.
| Classification | Detailed Description |
|---|---|
| Job Execution Time | Log Occurrence Time |
| Worker Information | Worker Account |
| Service | Service Name |
| Role Name | Role Name of the User Who Entered the Role |
| Resource Name | Resource Title |
| Region | Work Region |
| Resource Type | Resource Type |
| Work Record | Work Details |
| Resource ID | Resource’s unique ID |
| work result | work result |
| Event Topic | Event Content |
Table. Work History Detail Tab Items
Work history details
Work History Details page where you can check the detailed information of the work history.
| Classification | Detailed Description |
|---|---|
| Basic Mode JSON Mode | Select view mode for job history details |
| code copy | code copy available when JSON mode is selected |
| accountId | Account ID |
| productName | service name |
| requestedBy | Requester ID |
| resourceName | resource name |
| resourceType | Service Type |
| state | work result |
Table. Work history detailed tab items
6.2.1 - Trail Management
The user can check the activity history through the Samsung Cloud Platform Console, and store the corresponding activity history using the Trail service without time constraints. The activity history is kept for 90 days, so to keep it for a long time, you need to create a Trail service and store it in Object Storage.
Trail creation
You can store activity records without any time constraints using the Trail service of Logging&Audit in the Samsung Cloud Platform Console.
To create a Trail, follow the following procedure.
- All services > Management > Logging&Audit menu is clicked. It moves to the Service Home page of Logging&Audit.
- Service Home page, click the Trail menu. It moves to the Trail list page.
- Trail list 페이지에서 Create Trail 버튼을 클릭하세요. Create Trail 페이지로 이동합니다.
- Service Information Input area, please enter or select the required information.
Division NecessityDetailed Description Trail name Required Trail name - Use English, numbers, and special characters (-) to enter 5-26 characters
Target Region Required The region where the activity history occurred - Services created without specifying a region select the target region as All
- If a specific region selection is required, select from the region list
- The target region can be changed after creation
Target resource type Required Resource type of activity history to be stored in Trail - Default: All
- To change to specify only a specific resource type, click the Select button to select the resource type to be stored
- Refer to the Service-specific resource type list for selectable resource types
- The target resource type can be changed after creation
Target User Required User of activity history to be saved in Trail - Default: All
- If you want to change to specify only specific users, click the Select button to select the user to save
- Target user can be changed after creation
Storage bucket region Required Location (region) of the Object Storage bucket to store activity history - Storage bucket cannot be changed after creation
Storage Bucket Required Name of the Object Storage bucket to store activity history - Storage bucket cannot be changed after creation
Storage format Required File type to be saved (JSON, CSV) - Storage format can be changed after creation
Log file verification Select Whether to use log file verification - Use is selected, a Digest file is stored in the same bucket to verify the change and deletion of the Trail log file
- Whether to use log file verification can be changed after creation
Table. Trail Service Information Input Items - Additional Information Input area, please enter or select the required information.
Classification NecessityDetailed Description Description Selection Enter additional information or description about the Trail Tag Selection Add Tag - Up to 50 can be added per resource
- Click the Add Tag button and enter or select Key, Value
Table. Additional Information Input Items for Trail
Note
If the save file type is CSV, it opens the log file in a text editor (e.g. Notepad++).
- Summary panel where you created detailed information and estimated billing amount, and click the Complete button.
- Once creation is complete, check the created resource on the Trail list page.
Trail detailed information check
Trail 서비스는 전체 목록과 상세 정보 확인하고 수정할 수 있습니다. Trail 상세 페이지에서는 상세 정보, 태그, 작업 이력 탭으로 구성되어 있습니다. -> Trail service allows you to view and modify the entire list and detailed information. The Trail detail page consists of detailed information, tags, and work history tabs.
Trail detailed information to confirm, please follow the next procedure.
- All services > Management > Logging&Audit menu should be clicked. It moves to the Service Home page of Logging&Audit.
- Service Home page, click the Trail menu. It moves to the Trail list page.
- Trail list page, click on the resource to check the detailed information. It moves to the Trail details page.
- Trail details page displays status information and additional feature information, and consists of details, tags, work history tabs.
Classification Detailed Description Trail status status of the Trail created by the user - Active: Trail in operation
- Stopped: Trail operation stopped
Trail Control Trail status can be changed with a button - Start: Starts a stopped Trail. Activity records will be saved again from the day the Trail was started.
- Stop: Stops a running Trail. Activity record logging will be stopped, and existing saved activity records will be maintained.
Trail delete Button to delete the Trail Table. Trail status information and additional features
Detailed Information
Trail list page where you can check the detailed information of the selected resource and modify the information if necessary.
| Classification | Detailed Description |
|---|---|
| Service | Service Name |
| Resource Type | Resource Type |
| SRN | Unique resource ID in Samsung Cloud Platform
|
| Resource Name | Resource Name
|
| Resource ID | Unique resource ID in the service |
| Creator | The user who created the service |
| Creation Time | The time when the service was created |
| Editor | User who modified the service information |
| Revision Time | Time when service information was revised |
| Trail name | Trail title |
| Target Region | The region where the activity history occurred
|
| Target resource type | The type of resource stored in the activity history of Trail
|
| Target User | The user of the activity history stored in Trail
|
| Storage Bucket Region | Region of the Object Storage bucket where activity history is stored |
| Storage Bucket | Object Storage bucket name that stores activity history |
| Storage format | File type stored in bucket (JSON, CSV)
|
| Description | Additional information or description of the Trail
|
| Log file verification | Whether to use log file verification
|
| Initial Collection Time | The initial collection time of the activity history stored in Trail |
| Final Collection Time | The final collection time of the activity history stored in Trail |
| Final Execution Result | The final execution result of the activity history stored in Trail |
Table. Trail detailed information tab items
Tag
Trail list page where you can check the tag information of the selected resource, and add, change or delete it.
| Classification | Detailed Description |
|---|---|
| Tag List | Tag list
|
Table. Trail tag tab item
Work History
Trail list page where you can check the work history of the selected resource.
| Classification | Detailed Description |
|---|---|
| Work History List | Resource Change History
|
Table. Trail work history tab detailed information items
Trail Resource Control
You can start or stop according to the state of Trail. To control the resources of Trail, follow the following procedure.
Trail Getting Started
You can start the Trail that has been stopped(Stopped). The activity history from the day the Trail was started will be saved again.
- All services > Management > Logging&Audit menu is clicked. It moves to the Service Home page of Logging&Audit.
- Service Home page, click the Trail menu. It moves to the Trail list page.
- Trail list page, click the resource (Trail) to restart the suspended Trail. It moves to the Trail details page.
- Trail details page, click the Start button at the top to start the server. Check the status of the changed Trail in the Status Display item.
- Trail 시작이 완료되면 상태가 Stopped에서 Active로 변경됩니다 becomes: * When the trail starts, the status changes from Stopped to Active.
- For more information about the Trail status, please refer to Check Trail detailed information.
Trail stopping
You can stop the Trail that is (Active) running. It stops recording activity history in the Trail, and the existing saved activity history is maintained.
- All services > Management > Logging&Audit menu is clicked. It moves to the Service Home page of Logging&Audit.
- Service Home page, click the Trail menu. It moves to the Trail list page.
- Trail list page, click the resource (Trail) to stop working. It moves to the Trail details page.
- Trail details page, click the Stop button at the top to stop the server. Check the status of the changed Trail in the Status Display item.
- Trail suspension is completed, then the status changes from Active to Stopped.
- For more information about the Trail status, please refer to Check Trail detailed information.
Trail Resource Management
If you need control and management functions for the generated Trail resources, you can perform tasks on the Trail details page.
Modifying target region
You can modify the target region of Trail. To modify the target region of Trail, follow the following procedure.
- All services > Management > Logging&Audit menu is clicked. It moves to the Service Home page of Logging&Audit.
- Service Home page, click the Trail menu. It moves to the Trail list page.
- Trail list page, click the resource (Trail) to change the target region. It moves to the Trail details page.
- Trail details page, click the target region’s edit button. It moves to the target region edit popup window.
- Select the target region to change from the region list and click the confirm button. It moves to the Trail detail page.
- Trail details page where you can check the changed target region.
Reference
Trail에 저장되는 이벤트 로그의 변경 사항은 생성 및 수정한 시점부터 적용되며, 1시간 단위로 저장됩니다 becomes Changes to the event log stored in Trail are applied from the time of creation and modification, and are saved in 1-hour units.
Modifying target resource types
You can modify the target resource type of Trail. To modify the target resource type of Trail, follow the following procedure.
- All services > Management > Logging&Audit menu should be clicked. It moves to the Service Home page of Logging&Audit.
- Service Home page, click the Trail menu. It moves to the Trail list page.
- Trail list page, click the resource (Trail) to change the target resource type. It moves to the Trail details page.
- Trail details page, click the Edit button of the Target resource type. It moves to the Target resource type edit popup window.
- Add or change the target resource type to select and check if the selected resource type is displayed in the Selected Items below.
- The selectable resource types are referenced in the service-specific resource type list.
- If you have completed adding or changing the target resource type, click the Confirm button. It will move to the Trail Details page.
- Trail details page where you can check the changed target resource type.
Modify target user
You can modify the target users of Trail. To modify the target users of Trail, follow the following procedure.
- All services > Management > Logging&Audit menu is clicked. It moves to the Service Home page of Logging&Audit.
- Service Home page, click the Trail menu. It moves to the Trail list page.
- Trail list page, click the resource (Trail) to change the target user. It moves to the Trail details page.
- Trail details page, click the target user’s edit button. Target user edit popup window opens.
- Add or change the target user to select and check if the selected user is displayed in the Selected Items below.
- If you have completed adding or changing the target user, click the Confirm button. It will move to the Trail Detail page.
- Trail details page where you can check the changed target user.
Modify the storage format
You can modify the log file format stored in the Trail’s bucket. To modify the Trail’s storage format, follow the next procedure.
- All services > Management > Logging&Audit menu should be clicked. It moves to the Service Home page of Logging&Audit.
- Service Home page, click the Trail menu. It moves to the Trail list page.
- Trail list page, click the resource (Trail) to change the log file storage format. It moves to the Trail details page.
- Trail details page, click the edit button of storage format. Edit storage format popup window will open.
- Change the file format and click the confirm button. It will move to the Trail details page.
- Trail details page where you can check the changed storage format.
Log file validation modification
You can modify whether to use the log file verification of Trail. To modify whether to use the log file verification of Trail, follow these procedures.
- All services > Management > Logging&Audit menu should be clicked. It moves to the Service Home page of Logging&Audit.
- Service Home page, click the Trail menu. It moves to the Trail list page.
- Trail list page, click the resource (Trail) to change the log file storage format. It moves to the Trail details page.
- Trail details page, click the log file verification edit button. Move to the log file verification edit popup window.
- Use is selected, it stores the Digest file in the same bucket to verify the change and deletion of the Trail log file. Select whether to use it, and click the OK button. It moves to the Trail details page.
- Trail details page where you can check the changed storage format.
Trail description modification
You can modify the description of the Trail. To modify the description of the Trail, follow the following procedure.
- All services > Management > Logging&Audit menu should be clicked. It moves to the Service Home page of Logging&Audit.
- Service Home page, click the Trail menu. It moves to the Trail list page.
- Trail list page, click the resource (Trail) to modify the description to be changed. It moves to the Trail details page.
- Trail details page click the description of the edit button. Description edit popup window opens.
- Complete the description modification, and click the confirm button. It moves to the Trail detail page.
- Trail details page where you can check the changed description.
Trail delete
You can delete unused Trails to reduce operating costs. However, deleting a Trail can immediately stop a service that is currently in operation, so you should consider the impact of stopping the service sufficiently before proceeding with the cancellation work.
Caution
Trail deletion is irreversible, so please be careful after deleting the data.
To delete the Trail, follow the next procedure.
- All services > Management > Logging&Audit menu is clicked. It moves to the Service Home page of Logging&Audit.
- Service Home page, click the Trail menu. It moves to the Trail list page.
- Trail list page, click the resource (Trail) you want to delete. It moves to the Trail details page.
- Trail details page where you click the Trail delete button.
- Once the deletion is complete, check if the resource has been deleted on the Trail list page.
Caution
Deleting the Trail will stop saving activity records. Please proceed with the deletion after fully considering the impact that occurs when the service is stopped.
Service-specific resource type list
This is a list of resource types by service. When creating a Trail and modifying the target resource type, this is a list of target resource types that can be selected.
| Division | Target Resource Type | Scope of Application |
|---|---|---|
| AI&MLOps Platform | aiml-brightix:aimlops-platform | Region |
| API Gateway | apigateway:api | Region |
| Archive Storage | archivestorage:bucket | Region |
| Backup | backup:backup | Region |
| Backup | backup:backup-agent | Region |
| Bare Metal Server | baremetal:baremetal | Region |
| Block Storage(BM) | baremetal-blockstorage:volume | Region |
| Block Storage(BM) | baremetal-blockstorage:volume-group | Region |
| CacheStore | cachestore:cache-store | Region |
| Certificate Manager | certificatemanager:certificate | Region |
| Cloud Functions | scf:cloud-function | Region |
| Cloud LAN-Campus | clancampus:campus-network | Region |
| Cloud LAN-Datacenter | clandc:cloud-lan-network | Region |
| Cloud LAN-Datacenter | clandc:interface | Region |
| Cloud LAN-Datacenter | clandc:vcable | Region |
| Cloud LAN-Datacenter | clandc:vdevice | Region |
| Cloud WAN | clanwan:attachment | Region |
| Cloud WAN | clanwan:network | Region |
| Cloud WAN | clanwan:segment | Region |
| Cloud WAN | clanwan:segment-location | Region |
| Cloud WAN | clanwan:segment-sharing | Region |
| CloudML | aiml-brightix:cloud-ml | Region |
| Config Inspection | configinspection:config-inspection | Region |
| Container Registry | scr:container-registry | Region |
| Cost Savings | billingplan:cost-savings | Region |
| Data Flow | dataanalytics-brightix:data-flow | Region |
| Data Flow Service | dataanalytics-brightix:data-flow-service | Region |
| Data Ops | dataanalytics-brightix:data-ops | Region |
| Data Ops Service | dataanalytics-brightix:data-ops-service | Region |
| DevOps Service | devopsservice:devops-service | Region |
| Direct Connect | direct-connect:direct-connect | Region |
| EPAS(DBaaS) | epas:epas | Region |
| Edge Server | edgeserver:edge-server | Region |
| Event Streams | eventstreams:event-streams | Region |
| File Storage | filestorage:volume | Region |
| Firewall | firewall:firewall | Region |
| GPU Server | gpuserver:image | Region |
| GPU Server | gpuserver:server | Region |
| GSLB | gslb:gslb | Region |
| Global CDN | cdn:cdn | Region |
| Hosted Zone | dns:hosted-zone | Region |
| Identity Access Management | iam:access-key | Region |
| Identity Access Management | iam:group | Region |
| Identity Access Management | iam:policy | Region |
| Identity Access Management | iam:role | Region |
| Identity Access Management | iam:user | Region |
| Key Management Service | kms:kms | Region |
| Kubernetes Engine | ske:cluster | Region |
| Kubernetes Engine | ske:nodepool | Region |
| LB Health Check | loadbalancer:lb-health-check | Region |
| LB Listener | loadbalancer:lb-listener | Region |
| LB Server Group | loadbalancer:lb-server-group | Region |
| Load Balancer Listener Old | loadbalancer-old:listener | Region |
| Load Balancer Old | loadbalancer-old:loadbalancer | Region |
| Load Balancer Pool | loadbalancer-old:pool | Region |
| Load Balancer | loadbalancer:loadbalancer | Region |
| Logging&Audit | loggingaudit:tral | Region |
| MariaDB(DBaaS) | mariadb:mariadb | Region |
| Marketplace | marketplace:product-service | Region |
| Microsoft SQL Server(DBaaS) | sqlserver:sqlserver | Region |
| Multi-node GPU Cluster | multinodegpucluster:gpu-node | Region |
| Multi-node GPU Cluster | multinodegpucluster:cluster-fabric | Region |
| MySQL(DBaaS) | mysql:mysql | Region |
| Network Logging | network-logging:network-logging | Region |
| Object Storage | objectstorage:bucket | Region |
| Organization | organization:delegation-policy | Region |
| Organization | organization:invitationi | Region |
| Organization | organization:organization | Region |
| Organization | organization:organization-account | Region |
| Organization | organization:ou | Region |
| Organization | organization:service-control-policy | Region |
| Planned Compute | billingplan:planned-compute | Region |
| PostgreSQL(DBaaS) | postgresql:postgresql | Region |
| Private 5G Cloud | private-fivegen-cloud:private-fivegen-cloud | Region |
| Private DNS | dns:private-dns | Region |
| Private NAT | vpc:private-nat | Region |
| Public Domain Name | dns:public-domain-name | Region |
| Public IP | vpc:publicip | Region |
| Quick Query | dataanalytics-brightix:quick-query | Region |
| Repository | scr:repository | Region |
| Search Engine | searchengine:search-engine | Region |
| Secret Vault | secretvault:secretvault | Region |
| Security Group | security-group:security-group | Region |
| SingleID | singleid:singleid | Region |
| Support Plan | billingplan:support-plan | Region |
| Trail | loggingaudit:trail | Region |
| Transit Gateway | vpc:transit-gateway | Region |
| VPC | vpc:vpc | Region |
| VPC | vpc:internet-gateway | region |
| VPC | vpc:vpc-endpoint | Region |
| VPC | vpc:vpc-peering | region |
| VPC | vpc:nat-gateway | Region |
| VPC | vpc:port | Region |
| VPC | vpc:subnet | Region |
| VPC | vpc:private-nat | Region |
| VPC | vpc:privatelink-endpoint | Region |
| VPC | vpc:privatelink-service | Region |
| VPC | vpc:publicip | Region |
| VPC | vpc:transit-gateway | Region |
| VPN | vpn:vpn-gateway | Region |
| VPN | vpn:vpn-tunnel | Region |
| Vertica | vertica:vertica | Region |
| Virtual Server | virtualserver:server | Region |
| Virtual Server | virtualserver:auto-scaling-group | Region |
| Virtual Server | virtualserver:launch-configuration | Region |
| Virtual Server | virtualserver:image | Region |
| Virtual Server | virtualserver:keypair | Region |
| Virtual Server | virtualserver:server-group | Region |
| Virtual Server | virtualserver:volume | Region |
Table. List of resource types by service
6.3 - API Reference
API Reference
6.4 - CLI Reference
CLI Reference
6.5 - Release Note
Logging&Audit
2025.07.01
FEATURE
Logging&Audit new release service addition connection- Logging&Audit new release service added connection
- API Gateway, Archive Storage, Backup Agent, Cloud Functions, Cloud LAN-Datacenter, Cloud WAN, CloudML, Cost Savings, GSLB, Global CDN, IAM > role, Load Balancer > LB Health Check, Marketplace, Organization, Private DNS, Private NAT, Public Domain Name, Quick Query, Secret Vault, SingleID, Support Plan, Transit Gateway, VPC Peering, Vertica When viewing activity history, added period filter/time zone and activity history comparison functions.
2025.04.28
FEATURE
Logging&Audit new release service added connection- Logging&Audit new release service added connection
- Data Flow, Data Ops
2025.02.27
FEATURE
Logging&Audit new release service added connection- Logging&Audit new release service added connection
- AI&MLOps Platform, Multi-node GPU Cluster, VPN, Cloud LAN-Campus, KMS, Event Streams, Serch Engine, EPAS, Microsoft SQL Server
- Samsung Cloud Platform common feature changes
- Account, IAM and Service Home, tags, etc. reflected common CX changes.
2024.10.01
NEW
Logging&Audit Service Official Version Release- Logging&Audit service has been released. It stores/searches all activity records (Console, API, CLI) performed by customers, and provides functions such as tracking changes to cloud resources, troubleshooting, and security inspections.
2024.07.02
NEW
Beta version release- Logging&Audit service has been released. It stores/searches all activity records (Console, API, CLI) performed by customers, and provides functions such as tracking changes to cloud resources, troubleshooting, and security inspections.
7 - Notification Manager
7.1 - Overview
Service Overview
Notification Manager is a management service that provides notifications to users based on the criteria set in the notification policy for each account when a notification occurs.
Provided Features
Notification Manager provides the following functions.
- Notification Group Management: You can create and manage notification groups. You can add or remove users from the notification group.
- Notification Policy Management: You can set a notification policy to receive specific notifications that occur within the account. When creating a notification policy, if you link a notification group, users within the notification group can receive notifications set in the notification policy.
Component
Notification Manager provides notification groups and notification policies.
Alert Group
You can create and manage notification groups, and add or remove users from notification groups. The main functions are as follows.
- Create Alert Group: You can create an alert group and add users.
- Alert Group > Add User: You can add users to the created alert group.
- Please refer to How-to guides > Notification Group for how to create and use a notification group.
Notification Policy
You can create and manage notification policies, and pause or resume notification policies. The main features are as follows.
- Notification Policy Creation: You can create a notification policy and link a notification group.
- Stop using notification policy: You can stop using the notification policy that is currently in use.
- Notification Policy Usage: You can reuse a notification policy that is currently paused.
- Please refer to How-to guides > Notification Policy for how to create and use a notification policy.
Preceding Service
Notification Manager has no preceding services.
7.2 - How-to Guides
Users can create a notification group by entering essential information and selecting detailed options through the Samsung Cloud Platform Console.
Creating a Notification Group
You can create a notification group using the Samsung Cloud Platform Console.
- All Services > Management > Notification Manager menu, click. It will move to the Notification Group List page of Notification Manager.
- On the Notification Group List page, click the Create Notification Group button. It will move to the Create Notification Group page.
- On the Create Notification Group page, enter the necessary information for service creation and select detailed options.
In the Basic Information section, enter the necessary information.
Category RequiredDescription Notification Group Name Required Notification group name - Use Korean, English, numbers, and special characters (
+=,.@-_) within 3-24 characters
Description Optional Enter a description of the notification group - Maximum length is 1,000 characters
Table. Notification Group Basic Information Items- Use Korean, English, numbers, and special characters (
In the Add User section, select the users to be added to the notification group.
Category RequiredDescription Add User Optional Users added to the notification group - Search for the desired user and select them to add
- Users in the notification group can be deleted using the Delete button
- If the user to be added does not exist, create a user on the user creation page. Refer to IAM > Create User
- Only users with login history (email, phone number registered users) can be added to the notification group
Table. Notification Group User Addition Items
Note
For IAM users, if there is no login history after account creation, they cannot receive notifications. Therefore, such users cannot be added to the notification group.
Checking Notification Group Details
You can check and modify the overall list and detailed information of the notification group.
To check the detailed information of the notification group, follow these steps:
- All Services > Management > Notification Manager menu, click. It will move to the Notification Group List page of Notification Manager.
- On the Notification Group List page, click the notification group you want to check. It will move to the Notification Group Details page.
- On the Notification Group Details page, you can view detailed information about the notification group and modify or delete it.
Category Description Service Service category Resource Type Service name SRN Unique resource ID in Samsung Cloud Platform - In Notification Manager, it refers to the Notification Manager SRN
Resource Name Resource name - In Notification Manager service, it refers to the Notification Manager name
Resource ID Unique resource ID in the service Creator User who created the service Creation Time Time when the service was created Modifier User who modified the service information Modification Time Time when the service information was modified Notification Group Name Notification group name Description Description of the notification group Users List of users added to the notification group Table. Notification Group Details Items
- On the Notification Group Details page, you can view detailed information about the notification group and modify or delete it.
Adding Users to a Notification Group
You can add users to a notification group.
To add users to a notification group, follow these steps:
- All Services > Management > Notification Manager menu, click. It will move to the Notification Group List page of Notification Manager.
- On the Notification Group List page, click the Add button next to the users of the notification group you want to add. It will move to the Add User page.
- On the Add User page, select the users to be added to the notification group.
- If the user to be added does not exist, create a user on the user creation page. Refer to IAM > Create User.
- Only users with login history (email, phone number registered users) can be added to the notification group.
- After adding all users, click the Complete button. On the Notification Group List page, click the Expand button at the far right of the corresponding notification group to verify the added users.
Note
For IAM users, if there is no login history after account creation, they cannot receive notifications. Therefore, such users cannot be added to the notification group.
Modifying a Notification Group
You can modify the settings of a created notification group.
To modify a notification group, follow these steps:
All Services > Management > Notification Manager menu, click. It will move to the Notification Group List page of Notification Manager.
On the Notification Group List page, click the notification group you want to modify. It will move to the Notification Group Details page.
On the Notification Group Details page, click the Modify button. It will move to the Modify Notification Group page.
On the Modify Notification Group page, you can modify the notification group items.
Category RequiredDescription Notification Group Name Required Notification group name - Use Korean, English, numbers, and special characters (
+=,.@-_) within 3-24 characters
Description Optional Enter a description of the notification group - Maximum length is 1,000 characters
Users Optional Users added to the notification group - Search for the desired user and select them to add
- Users in the notification group can be deleted using the Delete button
- If the user to be added does not exist, create a user on the user creation page. Refer to IAM > Create User
- Only users with login history (email, phone number registered users) can be added to the notification group
Table. Notification Group Modification Items- Use Korean, English, numbers, and special characters (
After modifying the notification group, click the Save button.
Note
For IAM users, if there is no login history after account creation, they cannot receive notifications. Therefore, such users cannot be added to the notification group.
Deleting a Notification Group
If you no longer need a created notification group, you can delete it. However, please note that deleted notification groups cannot be recovered.
To delete a notification group, follow these steps:
- All Services > Management > Notification Manager menu, click. It will move to the Notification Group List page of Notification Manager.
- On the Notification Group List page, click the notification group you want to delete. It will move to the Notification Group Details page.
- On the Notification Group Details page, click the Delete button. A confirmation popup will appear; click the Confirm button after reviewing the message.
- After deletion, verify that the notification group has been deleted on the Notification Group List page.
7.2.1 - Notification Policy
Users can create a notification policy by entering the required information and selecting detailed options through the Samsung Cloud Platform Console.
Creating a Notification Policy
You can create a notification policy in the Samsung Cloud Platform Console.
- Click the All Services > Management > Notification Manager menu. It moves to the Notification Group page of Notification Manager.
- Click the Notification Policy menu on the Notification Group page. It moves to the Notification Policy List page.
- Click the Create Notification Policy button on the Notification Policy List page. It moves to the Create Notification Policy page.
- Enter the necessary information for creating the service and select detailed options on the Create Notification Policy page.
Classification RequiredDetailed Description Usage Required Whether to use the notification policy - ON: Use
- OFF: Do not use
Notification Policy Name Required Notification policy name - Enter within 30 characters
Description Optional Enter a description of the notification policy - Enter within 1,000 characters
Notification Item Required Select a notification item - Select a receivable notification item
- To select or deselect a specific notification name among the selected notification items, click the Expand button at the far right and select or deselect the notification name
- (Example) If you want to receive only notifications of Virtual Server creation failure, select Notification Item: Virtual Server > Notification Name: Virtual Server creation failure
Notification Target Group Required Select a notification group to deliver the notification - If you select a notification group, the notification group name will be displayed at the top
- Select or deselect the notification group name
Table. Create Notification Policy Items
Note
If there is no notification group to connect, create a notification group and then connect it. Refer to Create a Notification Group.
- After setting the necessary information, click the Complete button.
- After creation is complete, check the created notification policy on the Notification Policy List page.
Checking Notification Policy Details
You can check the entire list and detailed information of the notification policy and modify it.
To check the detailed information of the notification policy, follow these steps.
- Click the All Services > Management > Notification Manager menu. It moves to the Notification Group List page of Notification Manager.
- Click the Notification Policy menu on the Notification Group List page. It moves to the Notification Policy List page.
- Click the notification policy you want to check the details on the Notification Policy List page. It moves to the Notification Policy Details page.
The Notification Policy Details page displays status information and additional feature information.
Classification Detailed Description Notification Policy Status Whether to use the notification policy Modify Modify the notification policy Delete Delete the notification policy Table. Notification Policy Status Information and Additional FeaturesThe detailed items that can be checked on the Notification Policy Details page are as follows.
Classification Detailed Description Notification Policy Name Notification policy name Description Description of the notification policy Creator User who created the notification policy Creation Time Time when the notification policy was created Modifier User who modified the notification policy Modification Time Time when the notification policy was modified Notification Item Notification items set in the notification policy Notification Target Group Notification group connected to the notification policy Table. Notification Policy Details
Modifying a Notification Policy
You can modify the items set in the created notification policy.
To modify a notification policy, follow these steps.
- Click the All Services > Management > Notification Manager menu. It moves to the Notification Group List page of Notification Manager.
- Click the Notification Policy menu on the Notification Group List page. It moves to the Notification Policy List page.
- Click the Modify button on the Notification Policy List page. It moves to the Modify Notification Policy page.
- You can modify the notification policy items on the Modify Notification Policy page.
Classification RequiredDetailed Description Usage Required Whether to use the notification policy - ON: Use
- OFF: Do not use
Notification Policy Name Required Notification policy name - Enter within 30 characters
Description Optional Enter a description of the notification policy - Enter within 1,000 characters
Notification Item Required Select a notification item - Select a receivable notification item
- To select or deselect a specific notification name among the selected notification items, click the Expand button at the far right and select or deselect the notification name
- (Example) If you want to receive only notifications of Virtual Server creation failure, select Notification Item: Virtual Server > Notification Name: Virtual Server creation failure
Notification Target Group Required Select a notification group to deliver the notification - If you select a notification group, the notification group name will be displayed at the top
- Select or deselect the notification group name
Table. Modify Notification Policy Items
Note
If there is no notification group to connect, create a notification group and then connect it. Refer to Create a Notification Group.
- After modifying the notification policy, click the Save button.
Using a Notification Policy
You can reuse a notification policy that is currently stopped.
To set a notification policy to use, follow these steps.
- Click the All Services > Management > Notification Manager menu. It moves to the Notification Group List page of Notification Manager.
- Click the Notification Policy menu on the Notification Group List page. It moves to the Notification Policy List page.
- Click the More button at the far right of the notification policy you want to set to use on the Notification Policy List page, and then click the Use button. Click the Confirm button after checking the phrase in the Notification popup.
- Check the status of the notification policy on the Notification Policy List page.
Stopping a Notification Policy
You can change a notification policy that is currently in use to not in use.
To set a notification policy to not in use, follow these steps.
- Click the All Services > Management > Notification Manager menu. It moves to the Notification Group List page of Notification Manager.
- Click the Notification Policy menu on the Notification Group List page. It moves to the Notification Policy List page.
- Click the More button at the far right of the notification policy you want to set to not in use on the Notification Policy List page, and then click the Do not use button. Click the Confirm button after checking the phrase in the Notification popup.
- Check the status of the notification policy on the Notification Policy List page.
7.3 - Release Note
Notification Manager
2024.10.01
NEW
Notification Manager Release- The Notification Manager service has been released. It provides a feature to manage notifications provided to users when notifications occur.
- You can create and manage notification policies and notification groups to receive notifications, and add users.
8 - Organization
8.1 - Overview
Service Overview
Organization is a service that organizes accounts by organizational unit and hierarchically manages and controls resource access rights. The user can manage the resource usage of accounts belonging to the organization to optimize costs.
Features
- Hierarchical Project Management: It is possible to manage hierarchically by inviting accounts created within the organization to the Organization and organizing them by organizational unit.
- Organizational Unit Governance: Policies can be controlled by organizational unit, allowing you to apply policies in bulk to all organizational units and accounts under it.
- Efficient resource management and cost optimization: You can monitor the resource usage of all accounts within the organization to optimize costs.
Composition
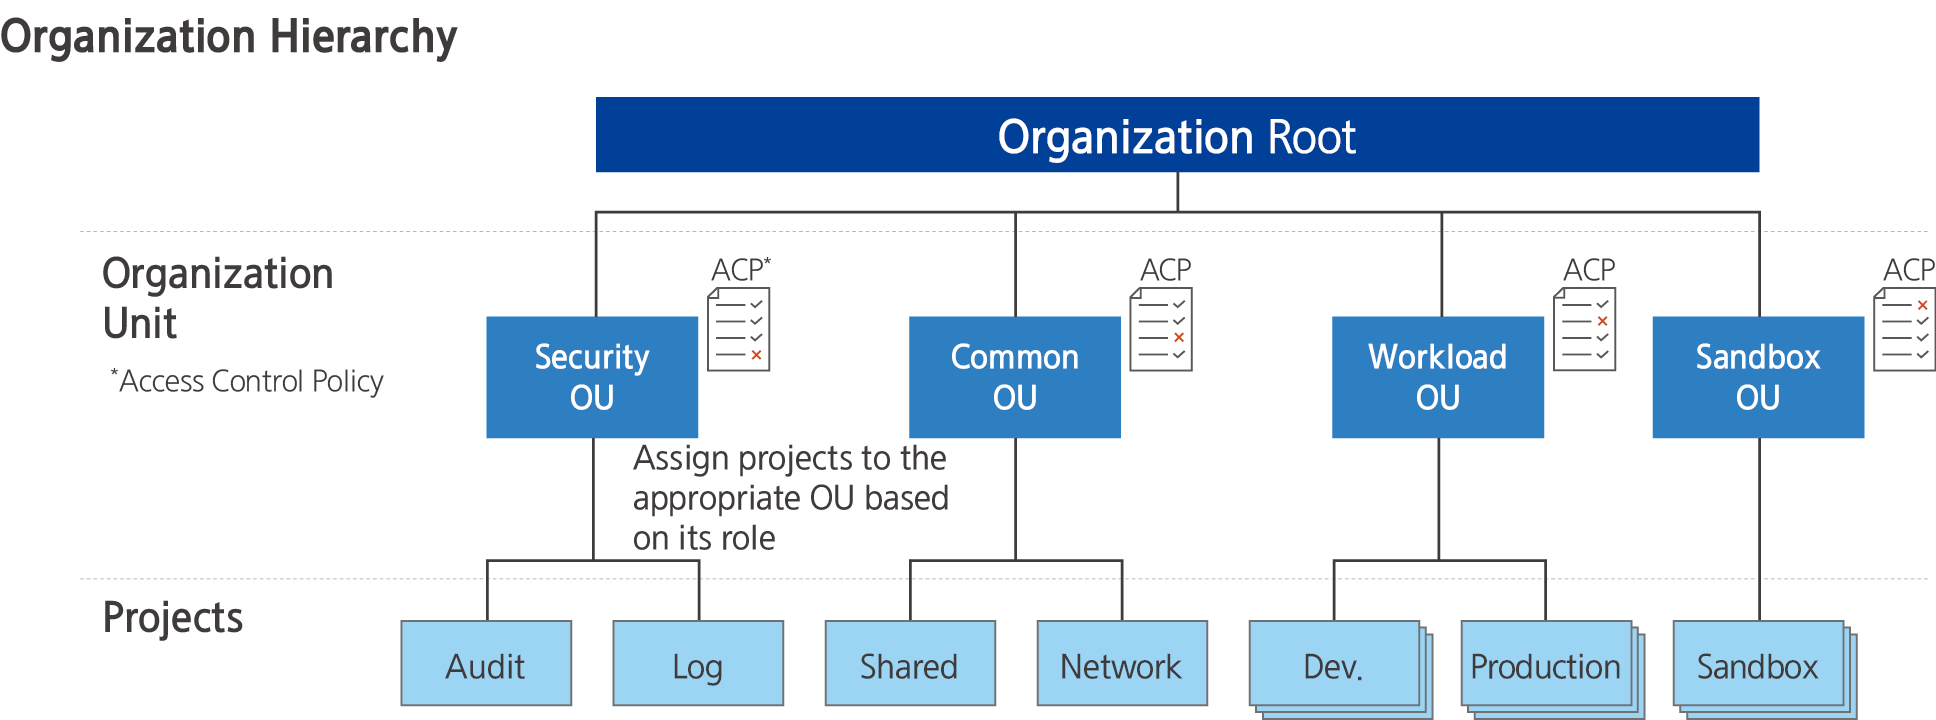
Provided Features
Organization provides the following functions.
- Account Management: You can create a new account within the organization or invite an existing account to manage it.
- Organization Unit Management: You can manage by composing an organization unit and composing an organization unit or Account under it.
- Compliance Policy Management: Manage compliance-related settings as integrated policies and apply them by organization unit and account to prevent or detect compliance violations in advance.
Preceding Service
Organization has no preceding service.
8.2 - How-to guides
The user can enter the essential information of the Organization through the Samsung Cloud Platform Console and create a service by selecting detailed options.
Organization creation
You can create and use an Organization in the Samsung Cloud Platform Console.
To create an Organization, follow the following procedure.
- All services > Management > Organization menu, click. It moves to the Service Home page of Organization.
- Service Home page, click the Organization creation button. The organization creation popup window opens.
- Organization Creation popup window, enter the Organization Name, then click the Confirm button.
- Use Hangul, English, numbers, spaces, and special characters (
+=,.@-_) to write within 20 characters
- Organization When the popup window notifying the creation is opened, click the Confirm button.
- Service Home page, check the dashboard of the Organization.
| Classification | Detailed Description |
|---|---|
| Organization Information | Management Account information is displayed
|
| Organization Unit | The number of organization units that make up the organization
|
| Account | The number of Accounts that make up the organization
|
| Control Policy | The number of control policies that make up the organization
|
Table. Organization Service Home dashboard items
Organization detailed information check
Organization’s detailed information can be checked and permissions can be managed.
To check the detailed information of the Organization and manage permissions, follow the following procedure.
- All services > Management > Organization menu, click. It moves to the Service Home page of Organization.
- Service Home page, click the Organization Settings menu. It moves to the Organization Settings page.
| Classification | Detailed Description |
|---|---|
| Organization Delete | Button to delete the organization |
| Organization Name | Organization Name
|
| Organization ID | Organization ID |
| Creator | Name of the user who initially created the organization |
| Creation Time | Organization Creation Time |
| Editor | The user name of the last user to modify the organization information |
| Modified Time | The last modified time of organization information |
| Management Account Name | Management Account Name |
| Management Account ID | Management Account ID |
| Management Account email | Management Account email |
| Control Policy | Whether to use control policy
|
| Delegation of Authority | Organization Management Authority Delegation Information
|
Table. Organization setting items
Notice
- Control Policy is disabled, the link of the associated control policy is released, and authorized users cannot view the control policy.
- Delegation of authority information can only be managed in the Management Account.
Organization to invite Account
You can manage the list of accounts invited to the Organization.
Notice
Management Account에서만 다른 Account를 초대할 수 있습니다. -> Management Account is the only one that can invite other accounts.
To manage the list of accounts invited by Organization, follow these procedures.
- All services > Management > Organization menu should be clicked. It moves to the Service Home page of Organization.
- Service Home page, click the invitation history menu. It moves to the invitation history list page.
- Invitation History List page, click the Account Invitation button. It moves to the Add Account page.
| Classification | Detailed Description |
|---|---|
| Account Email | |
| Account name | Account title |
| Account ID | Account’s ID |
| Request Time | Account Invitation Time |
| Completion Time | Invitation cancellation, rejection, , expiration, completion time |
| Invitation Status | Invitation Progress Status |
| Cancel Invitation | Cancel the invitation of the selected account
|
| Account Invitation | Invite a new Account to the organization
|
Table. Organization Invitation List Items
- Account addition page where you create and register a new Account or add an existing Account.
- For more information on adding an account, please refer to Adding an Account.
Joining other Organizations
If invited from another Organization, you can check and approve the invitation information.
Notice
Received invitation history can be checked in the Member Account.
To manage the list of accounts invited to the Organization, follow these procedures.
- All services > Management > Organization menu, click. It moves to the Service Home page of Organization.
- Service Home page, click the Received Invitation menu. It moves to the Received Invitation page.
| Classification | Detailed Description |
|---|---|
| Invited Email | Email information invited to the organization |
| Organization Name | Organization Name |
| Organization ID | Organization ID |
| Management Account name | Management Account name |
| Management Account ID | Management Account ID |
| Management Account email | Management Account email |
| Expiration time of invitation | Expiration time of invitation
|
| Decline Invitation | Decline the invitation |
| Accept Invitation | Accept the invitation and join the corresponding Organization |
Table. Organization Received Invitation Items
Reference
In the following cases, even if the invitation is approved, you cannot join.
- In case the number of Accounts within the organization exceeds the limit
- If the approval time is the cost settlement day (1st of every month, Asia/Seoul GMT +09:00)
- If there is an unpaid record in the corresponding Account
Organization delete
Guidance
Organization에 소속된 Account를 모두 제외한 후, Organization을 삭제할 수 있습니다 -> After excluding all Accounts belonging to the Organization, you can delete the Organization.
To delete an Organization, follow the following procedure.
- All services > Management > Organization menu, click. It moves to the Service Home page of Organization.
- Service Home page, click the Organization Settings menu. It moves to the Organization Settings page.
- Organization Settings page, click the Delete Organization button. Delete Organization popup window opens.
- Organization deletion popup window, click the Confirm button.
8.2.1 - Organization composition information
Organization’s hierarchical structure can be checked and configured with the organizational units that make up the organization and the Account can be checked and managed.
Organization configuration information check
Organization’s composition information can be confirmed.
To check the organization’s composition information, follow the following procedure.
- All services > Management > Organization menu should be clicked. It moves to the Service Home page of Organization.
- Service Home page, click the Organization Configuration menu. It moves to the Organization Configuration page.
- Organization unit and Account management area view method selection.
| Classification | Detailed Description |
|---|---|
| View Hierarchy | Display organizational units in a hierarchical structure |
| Account list view | Display the Account list within the organization |
| Account addition | A new account is invited to the organization
|
Table. Organization Organizational Structure Items
View Hierarchy Structure
Organization Structure page, by clicking the Hierarchy View button, you can check and manage the organizational units that make up the Organization and the Account in a hierarchical structure.
| Classification | Detailed Description |
|---|---|
| Create organization unit below | Add a new organization unit below the selected organization unit
|
| See more > Delete organization unit | Delete the selected organization unit
|
| See more > Account Move | Select the organizational unit to be deleted
|
| 더보기 > Account 제외 | Selected Account will be excluded from the organization |
| See more > Delete Account | Deletes the selected Account
|
| Organization Unit/Account Name | Displays the name of the organization unit and Account in a measurement structure format
|
| ID/Email | The organization unit is ID, Account displays ID and Email |
| Creation/Joining Time | Organization unit displays creation time, Account displays creation or joining time |
Table. Organization Hierarchy View Items
Account list view
Organization Structure page, by clicking the Account List View button, you can check and manage the list of accounts that make up the Organization.
| Classification | Detailed Description |
|---|---|
| Account Movement | Move Account to another organization
|
| See more > Exclude from organization | Account to be excluded from the organization
|
| Account name | Account Name |
| Account ID | Account’s ID |
| Account’s user email | |
| Additional Time | Account creation, additional time |
| Additional type | Account addition method
|
Table. View Organization Account list items
Account management
Organization을 -> You can check and manage the list of Accounts that make up the Organization: Organization을 구성하고 있는 Account 목록을 확인하고 관리할 수 있습니다. -> You can check and manage the list of Accounts that make up the Organization, becomes: You can check and manage the list of Accounts that make up the Organization. Corrected translation: You can check and manage the list of accounts that make up the organization. So the final translation is: You can check and manage the list of accounts that make up the organization.
Account addition
You can create a new Account or add an existing Account to the Organization.
To add an account to the Organization, follow the next procedure.
All services > Management > Organization menu is clicked. It moves to the Service Home page of Organization.
Service Home page, click the Organization Configuration menu. It moves to the Organization Configuration page.
Organization Structure page, click the Add Account button. It moves to the Add Account page.
Account addition page where you enter the account information to be added, and click the Complete button.
Classification MandatoryDetailed Description Additional method Required Select the method to add an account - Create a new account: Add by creating a new account
- Invite an existing account: Add by entering the root user email of an existing account
Account name Required Name of the account to be created - Enter within 3-30 characters using Korean, English, numbers, spaces, and special characters(
+=-_@[](),.)
Email Required Email to be set as the root user of the new Account - Account Invitation button clicked, move to Account Add page
Email Verification Required Re-verify email information - Organization Information button clicks will move to the Settings page and you can check the organization details
IAM Role Name Required Display organizational units in a hierarchical structure - Enter within 64 characters using English, numbers, special characters (
+=-_@,.)
Root user email Required Root user email of the Account - If you select an existing Account invitation, enter only the Root user email
- You can add up to 10 at the same time by clicking the Add button
Table. Adding an Organization AccountWhen the account creation and invitation notification popup window opens, click the Confirm button.
Reference- Account can be added up to a maximum of 200.
- The newly created Account can log in directly via email or access through an automatically generated role.
- If you log in directly with your email, you must use the password finder to reset your password.
Account detailed information check
You can check and modify the detailed information of the Account.
To check the detailed information of the Account, follow the next procedure.
- All services > Management > Organization menu, click. It moves to the Service Home page of Organization.
- Service Home page, click the Organization Configuration menu. It moves to the Organization Configuration page.
- Organization Structure page, click the View Account List button.
- In the Account list, click the Account name to confirm detailed information. It moves to the Account details page.
- Account Details page consists of Basic Information tab, Control Policy tab.
Classification Detailed Description Excluded from the organization Account excluded from the organization - When you click the button, a popup window opens to notify you of the account exclusion
- For more information, see Excluding an Account
Account Movement Move Account to a different organizational unit - Clicking the button moves to the Account Movement page
- For more information, refer to Moving Account
Basic Information Tab Displays basic information about the Account Control Policy Display the control policy linked to the Account Table. Account detailed page items
Detailed Information
You can check the detailed information of the organizational unit and modify the information if necessary.
| Classification | Detailed Description |
|---|---|
| Account name | Account full name |
| Account ID | Account’s ID |
| Creator | The user who created the Account |
| Creation Time | Time when the Account was created |
| Editor | User who modified the Account |
| Revision Time | Time when the Account was revised |
| Account’s user email | |
| Additional type | Account addition method
|
| Higher organization unit | Displays the higher level of the current organization unit in a hierarchical structure
|
Table. Account detailed information tab items
Control Policy
You can check the control policy connected to the Account and change the connection status.
| Classification | Detailed Description |
|---|---|
| Direct Disconnection | Disconnects the connection of the selected control policy
|
| Control Policy Connection | Connect a new control policy
|
| Control Policy Name | Control Policy Title |
| Type | Control Policy Type |
| Connection method | Connection method of control policy
|
| Revision Time | Last Revision Time of Control Policy |
Table. Account's Control Policy Tab Items
Account Move
Organization 내 조직 단위 간 Account를 이동할 수 있습니다 -> Organization within the organization unit can move the account. However, the correct translation would be: Organization within the organization unit can move the account -> You can move accounts between organizational units within an organization. So the correct translation is: You can move accounts between organizational units within an organization.
To move the Account, follow the next procedure.
All services > Management > Organization menu, click. It moves to the Service Home page of Organization.
Service Home page, click the Organization Configuration menu. It moves to the Organization Configuration page.
Organization Structure page, click the View Account List button.
Select the Account to move the organization unit, then click the Account Move button. It moves to the Account Move page.
Account Move page where you select the organizational unit to move the account, and then click the Complete button.
Classification Detailed Description Select Account Enter the name of the organization unit - Organization names distinguish between uppercase and lowercase letters
Moving organizational unit Select the organizational unit to move the Account Organization Unit Name Name of the organization unit Organization Unit ID ID of the organization unit Organization Creation Time The time when the organization unit was created Table. Creating an Organization UnitWhen the popup window notifying account transfer opens, check the transfer information and click the Confirm button.
Reference- The newly created Account can log in directly via email or access through an automatically generated role.
- If you log in directly by email, you must use the password finder to reset your password.
Account Exclusion
Organization에서 Account를 제외할 수 있습니다 -> Organization can exclude the Account. However, following the exact format and translation rules, the correct translation should be: Organization에서 Account를 제외할 수 있습니다 -> Organization can exclude Account from it, but keeping the original format, it should be: Organization에서 Account를 제외할 수 있습니다 -> Organization where Account can be excluded. However, the most accurate translation following the format is: Organization에서 Account를 제외할 수 있습니다 -> You can exclude Account from Organization, so the final translation is: Organization에서 Account를 제외할 수 있습니다 -> Organization where you can exclude Account. But to keep the format and meaning, it should be: Organization에서 Account를 제외할 수 있습니다 -> Organization can exclude Account. So the correct translation is: Organization에서 Account를 제외할 수 있습니다 -> Organization can exclude Account. Thus the translated line is: Organization can exclude Account.
To exclude an account from the Organization에, follow these procedures: should be translated to: To exclude an account from the Organization, follow these procedures: So the correct translation is: To exclude an account from the Organization, follow these procedures:
- All services > Management > Organization menu, click. It moves to the Service Home page of Organization.
- Service Home page, click the Organization Configuration menu. It moves to the Organization Configuration page.
- Organization Structure page, click the View Account List button.
- Organization에서 제외할 Account를 선택한 후, 더보기 > Account 제외 버튼을 클릭하세요. -> 4. Select the Account to be excluded from the Organization, then click the More > Exclude Account button.
- Account exclusion notification When the notification popup window opens, click the Confirm button.Notice
In the following cases, the Account cannot be excluded.
- Account that has not registered a payment method
- If there is a credit assigned to the account
- Excluding the time when the settlement date (1st of every month, Asia/Seoul GMT +09:00)
Account deletion
You can delete the Account.
To delete an Account, follow the following procedure.
- All services > Management > Organization menu should be clicked. It moves to the Service Home page of Organization.
- Service Home page, click the Organization Configuration menu. It moves to the Organization Configuration page.
- Organization Structure page, click the View Account List button.
- Select the Account to be deleted from the Account list, then click the More > Delete Account button. The Delete Account popup window will open.
- You can also delete by clicking the Account name of the Account to be deleted, and then clicking the Account Delete button on the Account Details page.
- Enter the Account name to be deleted, then click the Confirm button.
Reference
Account를 삭제하면 다음 사용자에게 Account 삭제 알림 메일이 발송됩니다 -> If you delete the Account, an Account deletion notification email will be sent to the following user.
- Organization을 생성한 관리자 -> * Administrator who created the Organization
- Created Account’s Root user
- User with delegation for the generated Account
Notice
- When deleting from the Account list, you must select only one Account to be deleted.
- Before deletion, all resources in the Account must be deleted.
- Management Account and accounts joined through invitation cannot be deleted.
Managing Organization Units
Organization을 구성하고 있는 조직 단위와 Account를 계층 구조로 확인하고 관리할 수 있습니다 -> You can configure and manage the organizational units that make up the Organization and the Account in a hierarchical structure.
Creating an organizational unit
You can create a new organizational unit.
To create and add an organizational unit to the Organization, follow these procedures.
- all services > Management > Organization menu, click. It moves to the Service Home page of Organization.
- Service Home page, click the Organization Configuration menu. It moves to the Organization Configuration page.
- Organization Structure page, click the Hierarchical Structure View button.
- Select the location to add an organizational unit in the hierarchical structure list, then click the Create organizational unit below button. It moves to the Create organizational unit page.
- Root or you can only select one existing organization unit.
- Root is the basis for creating organizational units within 5 levels below.
Organization Unit Creation page, enter the organization unit information to be added, and then click the Complete button.
Classification NecessityDetailed Description Organization Unit Name Required Enter the name of the organization unit - Organization names distinguish between uppercase and lowercase letters
Description Select Enter a description of the organizational unit within 1,000 characters Control Policy Connection Required Select a control policy to connect to the organizational unit - For more information on creating a control policy, see Creating a Control Policy
Table. Creating an Organization UnitWhen the popup window for creating an organizational unit opens, click the Confirm button.
Reference- Account can be added up to a maximum of 200.
- The newly created Account can be accessed directly by email login or through the automatically generated role.
- If you log in directly with your email, you must use the password finder to reset your password.
Check detailed information of organizational units
You can check and modify detailed information of the organization unit.
To check the detailed information of the organization unit, follow the following procedure.
- All services > Management > Organization menu, click. It moves to the Service Home page of Organization.
- Service Home page, click the Organization Configuration menu. It moves to the Organization Configuration page.
- Organization Structure page, click the Hierarchy View button.
- Click the Root/Account name of the organizational unit to check detailed information in the hierarchical structure list. It moves to the Organizational Unit Details page.
- Organization Unit Details page consists of Basic Information tab, Sub Items tab, Control Policies tab.
Classification Detailed Description Delete Organization Unit A button to delete the organization unit - When you click the button, a popup window opens to notify the organization deletion
- For more information, see How to Delete Organization Unit
Basic Info Tab Displays basic information about the organizational unit Sub-item Indicates a lower element of the organizational unit Control Policy Displays the control policy attached to the organizational unit Table. Organization organizational unit detailed page items
Detailed Information
You can check the detailed information of the organization unit and modify the information if necessary.
| Classification | Detailed Description |
|---|---|
| Service | Service Name |
| Resource Type | Service Type |
| SRN | Unique resource ID in Samsung Cloud Platform |
| Resource Name | Resource Title |
| Resource ID | Unique resource ID in the service |
| Creator | The user who created the service |
| Creation Time | The time when the service was created |
| Editor | User who modified the service information |
| Revision Time | Time when service information was revised |
| Organization Unit Name | The name of the organization unit
|
| Description | Description of the organizational unit
|
| Higher organizational unit | Displays the higher level of the current organizational unit in a hierarchical structure
|
Table. Organizational unit detailed information tab items
Reference
Root Details information page does not display Organization Unit Name, Description, Upper Organization Unit information.
Sub-items
You can check and manage the organizational unit under the current organizational unit and Account.
| Classification | Detailed Description |
|---|---|
| Create organization unit below | Add a new organization unit below the selected organization unit
|
| See more > Delete organization unit | Delete the selected organization unit
|
| Organization Unit/Account Name | Displays the name of the organization unit and account in a measurement structure format
|
| ID/Email | The organization unit shows ID, Account shows ID and Email |
| Creation/Joining Time | The organizational unit displays the creation time, and the Account displays the creation or joining time |
Table. Organization unit detailed page's sub-item tab item
Control Policy
You can check the control policies connected to the organizational unit and change the connection status.
| Classification | Detailed Description |
|---|---|
| Direct Disconnection | Disconnects the connection of the selected control policy
|
| Control Policy Connection | Connect a new control policy
|
| Control Policy Name | Control Policy Title |
| Type | Control Policy Type |
| Connection method | Connection method of control policy
|
| Last Modified Time | Last modified time of control policy |
Fig. Organization unit detailed page control policy tab item
Deleting an organizational unit
Organization에서 you can delete organizational units.
Notice
To delete an organizational unit, the organizational unit must not have any subordinate elements.
Organization에서 조직 단위를 삭제하려면 다음 절차를 따르세요 -> Organization to delete an organizational unit, follow these procedures:
- All services > Management > Organization menu, click. It moves to the Service Home page of Organization.
- Service Home page, click the Organization Configuration menu. It moves to the Organization Configuration page.
- Organization Structure page, click the View Hierarchy button.
- Select the organizational unit to be deleted from the hierarchical structure list, then click the More > Delete Organizational Unit button.
- When the popup window notifying the deletion of an organizational unit opens, click the Confirm button.
Control policy linking
Organization의 조직 단위나 Account에 통제 정책을 연결할 수 있습니다 -> You can attach control policies to an organizational unit or Account of the Organization.
To link a control policy, follow the next procedure.
- All services > Management > Organization menu, click. It moves to the Service Home page of Organization.
- Service Home page, click the Organization Configuration menu. It moves to the Organization Configuration page.
- Organization Structure page, click the View Hierarchy button.
- In the hierarchical structure list, click on the organizational unit or Account to which you want to add a control policy, and it will move to the detailed page of the element.
- Root or you can only select one existing organizational unit.
- Root is the basis for creating organizational units within 5 levels below.
Click the Control Policy tab on the detail page. It moves to the Control Policy Link page.
After selecting the control policy to connect, click the Complete button.
Classification Detailed Description Connected Control Policy Enter the name of the organization unit or account currently connected to the control policy organization unit, the name of the organization unit is case-sensitive and distinguishes between uppercase and lowercase English letters - Organization name is case-sensitive and distinguishes between uppercase and lowercase English letters
Table. Controlled Policy Link ItemsWhen the popup window notifying the control policy connection opens, click the Confirm button.
ReferenceTo create a new control policy, please refer to Create a Control Policy.
8.2.2 - Organization Control Policy
You can check and manage the control policies of Organization.
Organization Create control policy
Organization’s control policies can be created.
To create a control policy, follow the steps below.
All Services > Management > Organization Please click the menu. Navigate to Organization’s Service Home page.
Click the Control Policy menu on the Service Home page. Navigate to the Control Policy List page.
Click the Create Control Policy button on the Control Policy List page. It navigates to the Create Control Policy page.
After entering items in the Basic Information area, click the Next button.
Category RequiredDetailed description Control Policy Name Required Enter the name of the control policy - Enter using English letters, numbers, and special characters (
+=-_@,.) within 3~128 characters
Description Select Enter a description of the organizational unit within 1,000 characters Table. Organization Control Policy Creation - Basic Information Settings- Enter using English letters, numbers, and special characters (
After selecting the control policy setting method and the service to apply in the Control Requirements Setting area, click the Next button.
Category RequiredDetailed description Load Control Policy Select Enter the name of the control policy - When loading a policy, all previously entered content will be deleted
- For more details, refer to Load Policy
Basic Mode/JSON Mode Required Select policy setting method - Basic Mode: Set using the mode provided by the Console
- JSON Mode: Set directly using the JSON Editor
Service Required Select the service to set the control policy - Add Service: Add a service to set the control policy
Table. Organization Control Policy Creation - Service Settings
Caution
In the control policy settings, Basic Mode and JSON Mode are provided.
- After writing in Basic Mode, when entering JSON Mode or moving screens, services with duplicate control requirements are merged into one, and services that have not completed configuration are deleted.
- JSON mode If the content written in JSON mode does not conform to JSON format, it cannot be switched to basic mode.
After setting the permissions, click the Next button.
Category RequiredDetailed description Control Type Required Select control policy type - Allow Policy: Control policy that allows defined permissions
- Deny Policy: Control policy that denies defined permissions
Action Required Select actions provided per service - Actions that can select individual resources are displayed in purple
- Actions that target all resources are displayed in black
- Add action directly: Using the wildcard
*, multiple actions can be specified at once
Applied Resource Required Resources to which the action applies - All Resources: Apply to all resources for the selected action
- Individual Resources: Apply only to specified resources for the selected action
- Individual resources are only possible when selecting the purple action that allows individual resource selection
- Click the Add Resource button to specify target resources by resource type
- For details on Add Resource, refer to Register Individual Resources as Applied Resources
Authentication Type Required Authentication method of the user target to which the control policy will be applied - All authentication: Apply regardless of authentication method
- Authentication key authentication: Apply to authentication key authentication users
- Temporary key authentication, Console login: Apply to temporary key authentication or Console login users
Applied IP Required IP that allows control policy application - Custom IP: User directly registers and manages IP
- Applied IP: IP that the user directly registers for control policy application, can be registered as IP address or range format
- Excluded IP: IP to be excluded from Applied IP, can be registered as IP address or range format
- All IP: No IP access restriction
- Access is allowed for all IPs, but if an exception is needed, register Excluded IP to restrict access for the registered IPs
Additional Condition Select Add condition for Attribute-Based Access Control (ABAC) - Condition Key: Select from Global Condition Keys and Service Condition Keys list
- Qualifier: Default value, arbitrary value in request, all values in request
- Operator: Bool, Null
- Value: True, False
Table. Organization Control Policy Creation - Permission SettingsCheck Input Information After confirming the information entered on the page, click the Complete button.
When the popup notifying the creation of a control policy opens, click the Confirm button. It navigates to the Integrated Policy List page.
Load Control Policy
When creating a control policy, you can modify the policy requirements of an existing policy to create it.
Note
Load Policy when executed, all previously entered content will be deleted and replaced with the selected policy’s setting values.
To load an existing policy and create a 통저 policy, follow the steps below.
All Services > Management > Organization Click the menu. Navigate to Organization’s Service Home page.
Click the Control Policy menu on the Service Home page. Navigate to the Control Policy List page.
Control Policy List page, click the Create Control Policy button. Navigate to the Create Control Policy page.
After entering items in the Basic Information area, click the Next button.
Category RequiredDetailed description Control Policy Name Required Enter the name of the control policy - Enter using English letters, numbers, and special characters(
+=-_@,.) within 3 to 128 characters
Description Select Enter a description of the organizational unit within 1,000 characters Table. Organization Control Policy Creation - Basic Information Settings- Enter using English letters, numbers, and special characters(
Control Requirement Setting area, click the Load Control Policy button. The Load Control Policy popup window opens.
Click the Load Policy button. The Load Control Policy popup opens.
After selecting the control policy to load from the control policy list, click the Confirm button. The settings of the loaded policy will be entered automatically.
After editing the information that needs to be changed, click the Next button.
After confirming the information entered on the Input Information Confirmation page, click the Complete button. You will be taken to the Integrated Policy List page.
Register individual resources as applied resources
Permission setting during which you can register individual resources as applied resources.
To register an individual resource as an applied resource, follow the steps below.
All Services > Management > Organization Click the menu. Go to Organization’s Service Home page.
Service Home page, click the Control Policy menu. Navigate to the Control Policy List page.
Click the Create Control Policy button on the Control Policy List page. It navigates to the Create Control Policy page.
After entering items in the Basic Information area, click the Next button.
Category RequiredDetailed description Control Policy Name Required Enter the name of the control policy - Use English letters, numbers, special characters(
+=-_@,.) within 3~128 characters
Description Select Enter a description of the organizational unit within 1,000 characters Table. Organization Control Policy Creation - Basic Information Settings- Use English letters, numbers, special characters(
Control Requirement Setting In the area, after selecting the service to which the control policy will be applied, click the Next button.
Load Policy Click the button. Load Control Policy The popup window opens.
After selecting the control policy to load from the control policy list, click the Confirm button. The settings of the loaded policy will be entered automatically.
After editing the information that needs to be changed, click the Next button.
After verifying the entered information on the Check Input Information page, click the Complete button. You will be redirected to the Integrated Policy List page.
In the Action selection, select the Action that can select individual resources.
- Actions that allow individual resource selection are displayed in purple.
Click Individual Resource in Applied Resources.
Add Resource Click the button. Add Resource The popup window opens.
Category RequiredDetailed description Jawin type Required Select the type of resource to add SRN - Unique resource ID in Samsung Cloud Platform - Automatically updated according to the input items below
Account Required Set Account ID - Current Account: Current Account ID is auto-filled and cannot be edited
- All Accounts: Add to all Accounts (not recommended)
- Manual Input: Manually enter the Account ID using lowercase English letters and numbers, up to 100 characters (wildcard input not allowed)
Region Select Directly input the resource’s region information within 100 characters - Select All when checked, add resources of all regions
Resource ID Required Enter the resource ID to add directly within 100 characters - Select All when checked, adds all resources of the corresponding resource type
Table. Organization Control Policy Creation - Basic Information SettingsWhen the setup is complete, click the Next button. It will navigate to the Check Input Information page.
After verifying the entered information, click the Complete button. You will be redirected to the Integrated Policy List page.
Check detailed control policy information
Control Policy Details page allows you to view and edit detailed information of the control policy.
To view detailed information of the control record, follow the steps below.
- All Services > Management > Organization Click the menu. Go to Organization’s Service Home page.
- Click the Control Policy menu on the Service Home page. Navigate to the Control Policy List page.
- Click the control policy to view detailed information on the Control Policy List page. You will be taken to the Control Policy Details page.
- Policy Details page displays basic information, and consists of Basic Information tab, Control Requirements tab, Connected Targets tab.
Basic Information
Check the basic information of the control policy, and if necessary, you can edit the policy name and description.
| Category | Detailed description |
|---|---|
| service | service name |
| Resource Type | Resource Type |
| SRN | Unique resource ID in Samsung Cloud Platform |
| Resource Name | Resource Name
|
| Resource ID | Unique Resource ID |
| Creator | User who created the service |
| Creation time | Service creation time |
| Editor | User who edited the service information |
| Modification Date | Date Service Information Modified |
| Control Policy Name | Control Policy’s Name
|
| Type | Control Policy Type
|
| Description | Explanation of control policy
|
Table. Control Policy Basic Information Tab Items
Control Requirements
You can view services with permissions set in the current control policy.
- Basic mode and JSON mode can be checked.
- Clicking the arrow to the right of the service name will display the control requirements set for that service.
Note
Click the Edit button to modify the control requirements. For details on the edit items, see Create Control Policy.
| Category | Detailed description |
|---|---|
| Control Type | Control Policy Control Type
|
| Action | Provided functions of each service that are subject to the control policy |
| Applicable Resources | Resources to which the action is applied
|
| Authentication Type | Authentication method of the user target to which the control policy will be applied
|
| Applicable IP | IP that permits the application of control policies
|
Table. Control Policy's Control Requirements Tab Items
Connection Target
You can view the organizational units and accounts directly linked to the control policy.
Reference
Policies linked to Root and organizational units are inherited by child items.
| Category | Detailed description |
|---|---|
| Root | Root connection status and the number of control policies connected to Root are displayed
|
| Organization Unit | Current control policy linked organization unit and total number of control policies linked to that organization unit
|
| Account | Number of total control policies linked to the Account currently connected and the total number of control policies linked to that Account
|
Table. Policy's linked target tab items
Connect organization unit
You can link organizational units to the control policy.
To connect the organizational unit, follow the steps below.
- All Services > Management > Organization Click the menu. Navigate to Organization’s Service Home page.
- Service Home page, click the Control Policy menu. Navigate to the Control Policy List page.
- Control Policy List page, click the control policy to connect the organizational unit. Control Policy Details page will be displayed.
- Click the Connection Target tab on the Control Policy Details page.
- Click the Organizational Unit Connection button in the Organizational Unit area. You will be taken to the Organizational Unit Connection page.
- After selecting the organizational unit to connect, click the Complete button.
Category Detailed description Organization Unit/Account Name Display the organization unit and account names in a measurement structure format - Click the +, - buttons to expand or collapse the hierarchy
ID/email Organization unit shows ID, Account shows ID and email Creation Date The date the organizational unit was created is the creation date, and for Account it shows the creation or registration date Table. Organizational Unit Connection Items
7.Account When the popup notifying the connection opens, click the Confirm button.
Account Connect
You can link an Account to a control policy.
To connect Account, follow the steps below.
All Services > Management > Organization Click the menu. Navigate to the Service Home page of Organization.
Service Home on the page click the Control Policy menu. Control Policy List navigate to the page.
Control Policy List page, click the control policy to link the Account. Control Policy Details page will be displayed.
Control Policy Details page, click the Connection Target tab.
Click the Account Connection button in the Account area. You will be taken to the Account Connection page.
After selecting the Account to connect, click the Done button.
Category Detailed description Organization Unit/Account Name Display the organization unit and account names in a measurement structure format - Click the +, - buttons to expand or collapse the hierarchy
ID/email Organization unit shows ID, Account shows ID and email Creation Date The date the organizational unit was created is the creation date, and for Account it shows the creation or registration date Table. Account connection itemsWhen a popup notifying the connection opens, click the Confirm button.
Delete control policy
You can delete the control policy.
Notice
To delete a control policy, there must be no elements linked to the control policy.
To delete the control policy, follow the steps below.
- All Services > Management > Organization Click the menu. Navigate to Organization’s Service Home page.
- Service Home page, click the Control Policy menu. Navigate to the Control Policy List page.
- Click the control policy to delete on the Control Policy List page. Navigate to the Control Policy Details page.
- Control Policy Details page, click the Delete Control Policy button.
- When the popup notifying the deletion of the control policy opens, click the Confirm button.
8.3 - API Reference
API Reference
8.4 - CLI Reference
CLI Reference
8.5 - Release Note
Organization
2025.10.23
FEATURE
Account deletion feature improvement- You can also delete the Account created in the Organization from the Member Account.
- Deletable Accounts are limited to Accounts directly created in the Organization.
2025.07.01
NEW
Organization Service Official Launch- Organization service has been officially launched.
- Account can be organized by organizational units, managed hierarchically, and resource access permissions can be controlled.
- You can monitor the resource usage of all accounts within the organization to optimize costs.
9 - Resource Explorer
9.1 - Overview
Service Overview
Resource Explorer is a service that provides search for resources created by Samsung Cloud Platform.
Provided Features and Specialties
Resource Explorer provides the following features.
- Resource Search: You can search for resources across multiple regions and accounts using resource names, service names, resource types, and more.
- Multi-Region Search: You can find resources across multiple regions with a single search.
- Multi-account search: You can search for resources across all accounts in Organizations. (Scheduled to be released after July 25)
- Integrated Search: You can search for resources through the integrated search function. (Scheduled to be released after July 25)
- Filtering feature: You can filter search results using resource names, regions, tags, and more.
- Tag addition feature: You can add tags to multiple resources in bulk.
9.2 - How-to Guides
Users can search for resources in their account and region through the Resource Explorer service on the Samsung Cloud Platform Console, add tags, and navigate to resource details.
Searching for Resources with Resource Explorer
You can search for resources through Resource Explorer on the Samsung Cloud Platform Console.
To search for resources using Resource Explorer, follow these steps:
- Click All Services > Management > Resource Explorer menu. It moves to the Resource Explorer list page.
- On the Resource Explorer page, you can search for resources in various ways.
Category Detailed Description Input Box Enter text in the input box to search for results and select - Resource Name: Resource name
- Service Name: Service name of the resource
- Resource Type: Type of resource
Advanced Search Click the Advanced Search button to search for additional items - Resource Name: Resource name
- Service Name: Service name (multiple selections possible, searchable)
- Resource Type: Type of resource (multiple selections, searchable)
- Region (multiple selections, searchable)
Table. Resource Explorer Resource Search
Adding Tags with Resource Explorer
You can add tags through Resource Explorer on the Samsung Cloud Platform Console.
To add tags using Resource Explorer, follow these steps:
Note
If you select a resource that already has more than 50 tags added, the Add Tag button will be deactivated.
- Click All Services > Management > Resource Explorer menu. It moves to the Resource Explorer list page.
- On the Resource Explorer list page, select the checkbox of the resource, and the Add Tag button will be activated at the top of the list.
- Click the Add Tag button. It moves to the Add Tag page.
- Enter key and value, then click the Complete button to add a tag.
- You can add multiple tags by clicking the Add Tag button.
Guide
- You can add tags by selecting or entering key and value in the list.
- The list icon in the input window is activated when there is a selectable list, and the value list varies depending on the key.
- Up to 50 tags can be added per selected resource.
- If a tag with the same key is already applied, it will be replaced with the value of the newly added tag.
Moving to Resource Details with Resource Explorer
You can move to the resource details page through the Resource Explorer screen on the Samsung Cloud Platform Console and check the detailed information of the resource.
To move to the resource details page using Resource Explorer, follow these steps:
- Click All Services > Management > Resource Explorer menu. It moves to the Resource Explorer list page.
- On the Resource Explorer list page, click the resource name to move to the detailed screen of the corresponding resource.
- Some resource types do not provide a detailed screen.
9.3 - Release Note
Resource Explorer
2025.02.27
NEW
Resource Explorer Release- A search service for resources has been released.
- Resources from multiple regions can be checked at once through the Resource Explorer.
10 - Resource Groups
10.1 - Overview
Service Overview
Resource groups is a service that groups resources for management.
Provided Features
Resource groups provide the following features.
- Resource Grouping: Resources can be logically grouped based on tags.
- Tag-based query: You can search and group resources using tags.
- Resource Search: You can search for resources that match the specified query.
10.2 - How-to Guides
You can create a resource group to set up resources that match certain conditions to be displayed as a group.
Creating a Resource Group
You can create and use the Resource Group service in the Samsung Cloud Platform Console.
To create a Resource Group, follow these steps:
Click on All Services > Management > Resource Group menu. You will be moved to the Resource Group List page.
On the Resource Group List page, click the Create Resource Group button. You will be moved to the Create Resource Group page.
On the Create Resource Group page, enter the necessary information for service creation and select detailed options.
- In the Service Information Input section, select the necessary information.
Category RequiredDetailed Description Resource Group Name Required Enter group name Description Enter description Resource Type Required Select all or multiple resource types Group Definition Tag Required Set the tag criteria for grouping - Key
- Value
Target Resource Click the resource preview button to check and select the target resource Table. Resource Group Creation Input Information- In the Additional Information Input section, enter or select the necessary information.
Category RequiredDetailed Description Lock Optional Set whether to use Lock - Using Lock prevents accidental actions such as server termination, start, and stop
Init Script Optional Script to run when the server starts - The init script should be written in Batch script for Windows or Shell script or cloud-init for Linux
- Up to 45,000 bytes can be entered
Tag Optional Add a tag - Up to 50 tags can be added per resource
- Click the Add Tag button and enter or select the Key and Value
Table. Resource Group Additional Information Input Items
Review the input information and click the Complete button.
- Once created, you can check the created resource on the Resource Group List page.
Checking Resource Group Details
The Resource Group service allows you to check and modify the resource group list and detailed information. The Resource Group Details page consists of Basic Information, Group Resources, and Tags tabs.
To check the detailed information of the Resource Group service, follow these steps:
- Click on All Services > Management > Resource Group menu. You will be moved to the Resource Group List page.
- On the Resource Group List page, click on the resource you want to check the details for. You will be moved to the Resource Group Details page. * The Resource Group Details page displays status information and additional feature information, and consists of Basic Information, Group Resources, and Tags tabs.
Basic Information
You can check and modify the detailed information of the selected resource on the Resource Group List page.
| Category | Detailed Description |
|---|---|
| Service | Service category |
| Resource Type | Service type |
| SRN | Unique resource ID in Samsung Cloud Platform |
| Resource Name | Resource name |
| Resource ID | Unique resource ID in the service |
| Creator | Creator’s name |
| Creation Time | Creation date and time |
| Modifier | Modifier’s name |
| Modification Time | Modification date and time |
| Resource Group Name | Name entered by the user |
| Description | Description entered by the user |
Table. Resource Group Basic Information Tab Items
Group Resources
You can check and modify the group resources of the selected resource on the Resource Group List page.
| Category | Detailed Description |
|---|---|
| Group Resources > Resource Type | Group resource type |
| Group Resources > Group Definition Tag | Tag added when creating the resource group |
| Target Resource | List of resources grouped by the group definition tag
|
Table. Resource Group Group Resources Tab Items
Tags
You can check, add, modify, or delete the tag information of the selected resource on the Resource Group List page.
| Category | Detailed Description |
|---|---|
| Tag List | Tag list
|
Table. Resource Group Tags Tab Items
Managing Resource Groups
Modifying Resource Group Basic Information
You can modify the description of a Resource Group. To modify the description of a Resource Group, follow these steps:
- Click on All Services > Management > Resource Group menu. You will be moved to the Resource Group list page.
- On the Resource Group list page, click on the Resource Group name of the resource you want to modify. You will be moved to the Resource Group Details page.
- Click the Modify button next to the Resource Group name. You will be moved to the Modify Description popup window. Modify the description and click the Confirm button. You can check the modified description on the Resource Group Details page.
Modifying Resource Group Group Resources
You can modify the group resources of a Resource Group. To modify the group resources of a Resource Group, follow these steps:
Click on All Services > Management > Resource Group menu. You will be moved to the Resource Group list page.
On the Resource Group list page, click on the Resource Group name of the resource you want to modify. You will be moved to the Resource Group Details page. Click on the Group Resources tab. You will be moved to the Group Resources tab.
Click the Modify Group Resources button. You will be moved to the Modify Resource Group page.
- Modify the Resource Type and Group Definition Tag information, and then click Save.
Category RequiredDetailed Description Resource Type Required Select all or multiple resource types Group Definition Tag Required Set the tag criteria for grouping - Key
- Value
Target Resource Click the resource preview button to check and select the target resource Table. Resource Group Resource Modification Input InformationCheck the modified information on the Resource Group Details page.
Deleting a Resource Group
You can delete an unused Resource Group. However, once a Resource Group is deleted, it cannot be recovered.
To delete a Resource Group, follow these steps:
- Click on All Services > Management > Resource Group menu. You will be moved to the Resource Group List page.
- On the Resource Group List page, click on the resource you want to delete. You will be moved to the Resource Group Details page.
- On the Resource Group Details page, click the Delete Resource Group button. Check the message in the Notification popup window and click the Confirm button.
- On the Resource Group List page, select multiple Resource Groups using the check boxes and click the Delete button at the top of the resource list.
10.3 - Release Note
Resource Groups
2025.02.27
NEW
Resource Groups Release- We have launched a service that efficiently manages resources through grouping.
- Resources can be logically grouped and managed based on tags.
11 - ServiceWatch
11.1 - Overview
Service Overview
ServiceWatch is a service that provides various tools that collect metrics, logs, events, etc. of resources created on the Samsung Cloud Platform for monitoring, and offers observability of resources overall, including performance and operational status.
Features
We provide the following special features.
- Resource Monitoring: Collects and visualizes resource performance metrics (e.g., CPU Usage). Also creates a dashboard that allows visual inspection of multiple metrics in one place for quick overview.
- Alert Policy Configuration and Automatic Notification: You can create an alert policy by setting pre-defined conditions and thresholds, and when the threshold is exceeded, you can receive notifications, allowing you to quickly check and respond to the resource’s status.
- Log Analysis and Storage: Collect logs generated from resources for easy viewing and searching. Collected logs are stored in log groups for management, and log groups can be stored for free up to 5GB. Additionally, you can set a log retention policy to specify the retention period, and logs that exceed the retention period do not need separate management.
- Cost Efficiency: ServiceWatch provides a flexible pricing plan where you pay only for what you use, allowing cost-effective usage. It also offers a free usage tier, so you can try it for free and then expand to paid as needed.
Provided Features
We provide the following features.
- Metric Monitoring
- Metrics: ServiceWatch receives metric data from services of the Samsung Cloud Platform, and ServiceWatch collects and stores the metric data to provide it to users.
- Dashboard: Visualizes metrics of a single region to provide an integrated view of resources.
- Alert: Provides an alert function that allows you to check changes in indicators according to user-defined thresholds and provides notifications when thresholds are exceeded.
- Log Monitoring
- ServiceWatch provides log management functionality. Logs collected from Samsung Cloud Platform services can be stored in log groups for management. You can set log retention policies to manage the log retention period. Additionally, you can view and search log data through the console, and it provides the ability to store log groups in Object Storage.
- ServiceWatch Agent
- Through ServiceWatch Agent, you can collect detailed metrics on processes, CPU, memory, disk usage, and network performance from Virtual Server, GPU Server, Bare Metal Server, etc. You can also collect GPU performance metrics. Additionally, you can collect logs generated from resources via the Agent. (Scheduled for Dec 2025)
- Event Monitoring
- ServiceWatch can create event rules from system events about changes to resources created in Samsung Cloud Platform, allowing receipt of notifications under specific conditions.
Components
Indicator
Metrics refer to system performance data. By default, basic monitoring is provided on a free metric basis for resources of services linked with ServiceWatch. Additionally, services such as Virtual Server can enable detailed monitoring to provide paid metrics.
Indicator data can be viewed for up to 15 months (455 days).
For detailed information related to metrics, please refer to Metrics.
Log
You can collect, store, and view logs of the systems, applications, and services used in Samsung Cloud Platform services such as Virtual Server resources, Kubernetes Engine, etc.
For detailed information related to logs, see Log.
Event
The event represents a change in the environment in the Samsung Cloud Platform service. The following is an example of an event.
- Create an event when the status of the Virtual Server changes from Stopped to Running.
- Create an event when a new bucket is created in Object Storage.
- Creates an event when an IAM user is removed from a user group.
For detailed information about the event, please refer to Event.
Dashboard
ServiceWatch will provide pre-built dashboards automatically for each service, and you can also create dashboards manually.
Notice
Pre-built dashboards for each service are scheduled to be provided in the first half of 2026.
ServiceWatch Agent
ServiceWatch Agent is a software component that collects metrics and logs from Virtual Server, GPU Server, and On-Premises servers, etc. Through this, you can monitor infrastructure and applications more finely than the basic monitoring provided by default.
Reference
Custom metric/log collection via the ServiceWatch Agent is currently only available on Samsung Cloud Platform For Enterprise. It will be offered in other offerings in the future.
- For detailed information about the ServiceWatch Agent, please refer to Custom Metrics and Logs.
Constraints
The constraints of ServiceWatch are as follows.
| Category | Description |
|---|---|
| Metric Query Period | Metric queries can be set up to a maximum of 455 days from the time of query
|
| Number of indicator queries | You can select up to 500 indicators and view them as a graph |
| Indicator image file download | Image download available for indicator data of up to 100 indicators |
| Metric Object Storage Export | Up to 10 metrics, export to Obect Storage is possible for metric data within a maximum query period of 2 months (63 days) |
| Number of widgets/metrics per dashboard |
|
| Number of alert policies | Account/Region-wise up to 5,000 |
| Alarm History | Alarm history can be viewed for 30 days |
| Number of alert policy notification recipients | 100 or fewer |
| Number of log groups | Account/per region 10,000 or less |
| Log download | When downloading Excel, you can download up to 1MB per log event, up to 10,000 log events
|
| Number of log group export tasks |
|
| Log event size | 1MB or less |
| Number of event rules | Account/ per region 300 or less |
| Event pattern size | under 2MB |
| Number of notification recipients per event rule | 100 or fewer |
Table. ServiceWatch constraints
The following is ServiceWatch’s monthly free offering details.
| Category | Free provision |
|---|---|
| Log | Store up to 5GB per month |
| Metrics |
|
| Dashboard | 3 per month for dashboards referencing 50 or fewer metrics
|
| Alert Policy | 10 per month |
Table. ServiceWatch Free Provision Scope
Region-specific provision status
ServiceWatch is available in the following environments.
| Region | Availability |
|---|---|
| Korea West (kr-west1) | Provided |
| Korea East (kr-east1) | Provided |
| South Korea 1 (kr-south1) | Provided |
| Korea South2(kr-south2) | Provided |
| South Korea South 3 (kr-south3) | Provided |
Table. ServiceWatch regional provision status
Preceding Service
There is no preceding service for ServiceWatch.
11.1.1 - Indicator
Indicator
Metrics are data about system performance. By default, many services provide free metrics for resources (e.g., Virtual Server, File Storage, etc.), which are provided as basic monitoring through ServiceWatch. Detailed monitoring can be used for some resources such as Virtual Server.
Indicator data is retained for 15 months (455 days), so you can view both the latest data and historical data.
| Term | Example | Description | |
|---|---|---|---|
| Namespace | Virtual Server | Logical division for distinguishing and grouping metrics
| |
| Metric | CPU usage | Name of the specific data to be collected
| |
| Dimension(Dimensions) | resource_id | Unique identifier for the metric
| |
| Collection Interval | 5 minutes | Collection interval of metric data from each service providing metrics
| |
| Statistics | Average | How to aggregate metric data over a specified period
| |
| Unit | % | Statistical measurement unit
| |
| Aggregation Period | 5 minutes | Period for aggregating collected metric data
| |
| Alert | CPU usage >= 80% | Occurs for 5 minutes | If CPU usage remains at 80% or higher for 5 minutes, change to Alert state |
Table. ServiceWatch metric terms
Namespace
A namespace is a logical division used to distinguish and group ServiceWatch metrics. Samsung Cloud Platform service namespaces are mostly used the same as the service name, and can be found in the ServiceWatch Integrated Service List.
For custom metrics, users can define a namespace that distinguishes them from other metrics in ServiceWatch, and can define it via ServiceWatch Agent settings or OpenAPI. Detailed information about custom metrics and logs can be found in Custom Metrics and Logs.
Metric (Metric)
A metric represents a set of data points collected in ServiceWatch, sorted chronologically. A data point consists of a timestamp, the collected data, and the unit of the data.
For example, the CPU usage of a specific Virtual Server is one of the basic monitoring metrics provided by Virtual Server. The data point itself can occur in any application or activity that collects data.
Basically, the Samsung Cloud Platform service linked with ServiceWatch provides metrics for resources for free. Detailed monitoring for some resources is provided as a paid service and can be enabled in each service.
Metrics can only be viewed in the region where they were created. Metrics cannot be arbitrarily deleted by users. However, if new data is not posted to ServiceWatch, they will automatically expire after 15 months. Data points older than 15 months (455 days) expire sequentially, and when new data points are added, data older than 15 months (455 days) is deleted.
Timestamp
The timestamp of a data point is time information indicating the time at which the data point was recorded. Each metric data point consists of a timestamp (time) and data.
The timestamp consists of hours, minutes, seconds, and date.
Metric Retention Period
ServiceWatch metric data is maintained as follows.
- Data points with a collection interval set to 60 seconds (1 minute) can be used until the 15th
- Data points with a collection interval set to 300 seconds (5 minutes) are usable up to day 63
- Data points with a collection interval set to 3600 seconds (1 hour) are usable up to 455 days (15 months).
The data points that were initially collected at a short collection interval are downsampled and stored for long-term retention.
For example, if data is collected at a 1‑minute interval, it is retained in 1‑minute granularity for 15 days. After 15 days, the data continues to be retained, but can only be queried in 5‑minute intervals. After 63 days, the data is re‑aggregated and provided in 1‑hour intervals. If you need to retain metric data points longer than the metric retention period, you can store them separately via the File Download or Export to Object Storage functions.
Dimensions(Dimensions)
Key-value pair that serves as a unique identifier for the metric, allowing classification and filtering of data points.
For example, you can identify metrics for a specific server by using the resource_id dimension of the Virtual Server’s metrics.
Collection Cycle
It refers to the cycle of collecting data points for each service’s metrics, and is provided at the collection cycle predefined by each service.
Refer to each service’s ServiceWatch metrics page for the metric collection interval of each service.
Note
The metric page of the ServiceWatch integrated service, please refer to Metrics and Log Monitoring.
For example, Virtual Server provides a collection interval of 5 minutes during basic monitoring, and provides 1 minute when detailed monitoring is enabled.
Statistics
Statistics is a method of aggregating metric data over a specified period. ServiceWatch provides data aggregated as statistics based on metric data points provided to ServiceWatch from each service. Aggregation is performed using namespace, metric name, dimensions, and data point units within the specified aggregation period.
The provided statistics are total, average, minimum, maximum.
- Total: Sum of all data point values collected during the period
- Average: During the specified period, (sum of all data pointer values during that period)/(number of data pointers during that period) value
- Minimum: the lowest value observed during the specified period
- Maximum: The highest value observed during the specified period
Unit
Each statistic has a measurement unit. Examples of units include Bytes, Second, Count, Percent, etc.
Aggregation Period
Each statistic calculates the data points of the metric collected during the selected aggregation period. The aggregation period can be chosen from 1 minute, 5 minutes, 15 minutes, 30 minutes, 1 hour, 3 hours, 6 hours, 12 hours, or 1 day, and the default is 5 minutes. The aggregation period is closely related to the collection interval of metric data points, and to obtain correct aggregation results, the aggregation period must be longer than or equal to the collection interval.
For example, if you select average for the statistic, choose an aggregation period of 5 minutes, and select a metric with a collection interval of 1 minute, data points are collected at 1‑minute intervals and the average is calculated over the data points collected during the 5‑minute period. Conversely, if the aggregation period is shorter than the collection interval, it means that a normal aggregation result cannot be obtained.
Downsampling is applied for long-term storage of metric data. For example, if data is collected at a 1‑minute interval, after 15 days this data can only be queried in 5‑minute increments. If you set the aggregation period for such metrics from 5 minutes to 30 minutes, up to 5 minutes may be required to retrieve the downsampled data correctly. After 63 days, the data is re‑aggregated and provided in 1‑hour intervals. At that point, selecting an aggregation period from 1 hour to 1 day may take up to 1 hour to retrieve the data correctly. This is because aggregating the metric data after downsampling takes time, which can cause aggregation delays.
Reference
When viewing indicator data, the most recent data point may not be displayed due to aggregation delays; in this case, you can either reduce the aggregation period to be smaller than set or query after a certain time (5 minutes or 1 hour) to view it correctly.
| Aggregation Period | Aggregation Delay |
|---|---|
| 1 minute | - |
| 5 minutes | up to 5 minutes |
| 15 minutes | up to 5 minutes |
| 30 minutes | maximum 5 minutes |
| 1 hour | maximum 1 hour |
| 3 hours | maximum 1 hour |
| 6 hours | up to 1 hour |
| 12 hours | up to 1 hour |
| 1 day | up to 1 hour |
Table. ServiceWatch aggregation delay by aggregation period
Alert
When creating an alert policy, you can evaluate a single metric over the entered evaluation range, and if it meets the condition set based on the threshold, you can provide the user with an alert notification.
The alert status is classified as Alert(Alert), Normal(Normal), Insufficient data(No data).
- Alert(Alert): when the indicator meets the set conditions
- Normal(Normal): when the indicator does not meet the set conditions
- Insufficient data(no data): when the metric data does not exist, is missing, or has not yet arrived
When the alarm status is Alert, if the alarm evaluation deviates from the condition, the alarm status changes back to Normal.
For detailed information about alerts, please refer to the Alert item.
Basic Monitoring and Detailed Monitoring
ServiceWatch provides two types of monitoring: basic monitoring and detailed monitoring.
The Samsung Cloud Platform service integrated with ServiceWatch provides basic monitoring by publishing a basic set of metrics to ServiceWatch for free. By default, if you use even one of these services, basic monitoring is automatically enabled and can be viewed in ServiceWatch.
Reference
Services that provide basic monitoring can be found in ServiceWatch 연계 서비스 목록 and will be gradually expanded.
Detailed monitoring is only available for some services and incurs charges. To use detailed monitoring, you must enable it in the service details.
Detailed monitoring options vary depending on the service provided.
- The default monitoring of Virtual Server has a collection interval of 5 minutes. When detailed monitoring is enabled, the metrics provided by default monitoring are collected at a 1‑minute interval instead of 5 minutes.
Information
In October 2025, ServiceWatch detailed monitoring will be provided only for Virtual Server. The detailed monitoring target services will be expanded in the future.
The following includes services and guides that provide detailed monitoring.
| Service | Guide |
|---|---|
| Virtual Server/GPU Server | Virtual Server Enable Detailed Monitoring |
Table. ServiceWatch detailed monitoring service
11.1.2 - Alert
Alert
You can create alerts that monitor metrics and send notifications. For example, you monitor the CPU usage and disk read/write of a Virtual Server, then send a notification to the user to handle increased load.
Alert Policy
Alert policies can monitor metrics of the same Account and evaluate alerts for a single metric. These alert policies compare the specified threshold and metric conditions, and send notifications when the conditions are met.
If you disable the alert policy, the evaluation of the alert policy continues, but you can restrict sending alerts to designated recipients. If you want to temporarily stop sending alerts for resources with an alert policy set, you can use alert policy deactivation.
When you enable the alert policy, evaluation of the alert policy begins, and according to the set conditions, the alert status changes to Alert, and a notification is sent each time the alert status changes.
The alarm policy status allows you to check whether the alarm policy is enabled/disabled.
| Alert Policy Status | Description |
|---|---|
| ● Active | A state where the alarm policy is active and notifications can be sent according to the set conditions
|
| ● Inactive | The alarm policy is disabled, and notification sending is restricted
|
Table. Alert Policy Status
You can set alert levels for the alert policy. Depending on the alert level, the alert color (red/pink/purple) is expressed differently so that the levels can be visually distinguished by color. You can filter according to the alert policy’s alert level and retrieve the alert policy by each alert level.
| Alert Level | Description |
|---|---|
| High | If you set the step for the alarm policy condition to High, the alarm level is displayed in red |
| Midle | If you set the step to Middel in the alarm policy condition, the alarm step is displayed in pink |
| Low | If you set the step to Middel in the alarm policy condition, the alarm step is displayed in purple |
Table. Alert Policy Levels
Alarm Status
Alert status changes according to the alert evaluation of the alert policy. Alert status is divided into three states: Normal (Normal), Insufficient data (Insufficient data), Alert (Alert).
| Alarm Status | Description |
|---|---|
| ● Normal | Means a normal state that does not meet the conditions set in the alarm policy
|
| ● Insufficient data | The alarm policy has just been created, or the metric is unavailable, or there is insufficient data to determine the alarm state from the metric
|
| ● Alert | State that meets the conditions set in the alert policy
|
Table. Alarm Status
Reference
When an alarm policy is first created, the alarm state is initialized to Insufficient data. When metric data is later collected, the alarm state changes to Normal or Alert.
Alert Evaluation
| Term | Description |
|---|---|
| Metric Data Point | Statistical data calculated from metric data. A data point consists of a timestamp, collected statistical data, and the unit of the data.
|
| Metric collection interval | Time interval for collecting metric data per service
|
| Alert Evaluation Interval | Time interval for evaluating whether the alert meets the conditions
|
| Alarm Evaluation Scope | Evaluation time range for alarm evaluation
|
| Alert Evaluation Count/Alert Violation Count | During the alert evaluation interval, if the condition is satisfied for violation count out of evaluation count, the alert status is switched to Alert
|
| Alarm evaluation interval | Alarm evaluation range(seconds) X Alarm evaluation count |
Table. Alert Evaluation Terms
For example, for a metric with a 1-minute collection interval, if you set a 1-minute evaluation window with 4 violations out of 5 evaluation counts, the evaluation interval is 5 minutes. For a metric with a 5-minute collection interval, if you set a 10-minute evaluation window with 3 violations out of 3 evaluation counts, the evaluation interval is 30 minutes.
| Category | Example 1 | Example 2 |
|---|---|---|
| Metric collection interval | 1 minute | 5 minutes |
| Alarm evaluation cycle (fixed) | 1 minute | 1 minute |
| Alert Evaluation Scope | 1 minute | 10 minutes |
| Number of alarm evaluations | 5 times | 3 times |
| Number of alarm violations | 4 times | 3 times |
| Alarm evaluation interval (seconds) | 5 minutes (300 seconds) | 30 minutes (1,800 seconds) |
| Condition | If evaluated 5 times within 5 minutes and satisfies 4 conditions, change the alarm state to Alert | If evaluated 3 times within 30 minutes and satisfies 3 conditions, change the alarm state to Alert |
Table. Alarm Evaluation Example
Evaluation Scope
The evaluation scope of the alarm policy is the evaluation time range for alarm evaluation.
- It is recommended to set it to the indicator’s collection interval or a multiple of the collection interval.
- You can input up to 604,800 (7 days) seconds.
Caution
If the evaluation range is set smaller than the collection interval or not matching a multiple of the collection interval, the alarm evaluation may not work properly.
| Evaluation Scope | Configurable number of evaluations |
|---|---|
| 7 days (604,800 seconds) | 1 |
| 1 day (86,400 seconds) | 7 or less |
| 6 hours (21,600 seconds) | 28 or less |
| 1 hour (3,600 seconds) | 168 or less |
| 15 minutes (900 seconds) | 96 or less |
| 5 minutes (300 seconds) | 288 or less |
| 1 minute (60 seconds) | 1,440 or less |
Table. Number of evaluable evaluations that can be set according to evaluation range
Notice
There are the following restrictions on the evaluation scope and the number of evaluations:
- When the evaluation range is 1 hour (3,600 seconds) or more, the evaluation interval (evaluation count × evaluation range) can be up to 7 days (604,800 seconds)
- When the evaluation range is less than 1 hour (3,600 seconds), the evaluation interval (evaluation count × evaluation range) can be up to 1 day (86,400 seconds).
Condition
The conditions for performing alarm evaluation require a conditional operator and threshold setting.
| Term | Description |
|---|---|
| Statistics | Method of calculating metric data during the evaluation period for alarm assessment |
| Conditional Operator | After calculating metric data over the evaluation period for alarm evaluation, select the conditional operator that compares the value with the threshold. |
| Threshold | Define a threshold to compare with the calculated metric data during the evaluation period for alarm assessment using a conditional operator |
Table. Condition Terms
If the namespace is Virtual Server and the metric is CPU Usage (unit: %), the alarm evaluation condition is completed as below.
| Category | Example 1 | Example 2 |
|---|---|---|
| Metric collection interval | 1 minute | 5 minutes |
| Alarm evaluation interval (fixed) | 1 minute | 1 minute |
| Alert Evaluation Scope | 1 minute | 10 minutes |
| Number of alarm evaluations | 5 times | 3 times |
| Alarm violation count | 4 times | 3 times |
| Alarm evaluation interval (seconds) | 5 minutes (300 seconds) | 30 minutes (1,800 seconds) |
| Statistics | Average | Total |
| conditional operator | >= | < |
| threshold | 80 | 20 |
| Condition | If the average CPU Usage >= 80% for 4 times over 5 minutes, change the alert status to Alert | If the average CPU Usage < 20% for 3 times over 30 minutes, change the alert status to Alert |
Table. Alarm Evaluation Example - Conditional Operator, Threshold, Statistics Added
Alarm Notification
If the alarm evaluation conditions are met, change the alarm status to Alert and send a notification to the recipients set in the alarm policy.
Reference
- Only users with login history (users who have registered email or mobile phone number) can be added as alert recipients.
- Notification reception method (E-mail or SMS) can be set by selecting the notification target as Service > Alert on the Notification Settings page.
- Notification recipients can be added up to a maximum of 100.
Guide
- Users without login history cannot be designated as notification recipients.
- Notification Settings page, if you select the notification target Service > Alert and do not set the notification reception method, you cannot receive notifications.
Method for handling missing data during alarm evaluation
Some resources may not be able to send metric data to ServiceWatch under certain conditions. For example, if a specific resource is inactive or does not exist, it will not be sent to ServiceWatch. If metrics are not collected for a certain period, the alarm state will be changed to Insufficient data by the alarm evaluation.
ServiceWatch provides a way to handle missing data during alarm evaluation. The missing data handling methods are as follows:
- Ignore: Maintain the current alarm state. (default)
- Missing: Treat missing data points as missing. If all data points within the evaluation range are missing, the alarm state switches to
Insufficient datastate. - Breaching: Treat as satisfying the threshold condition for missing data points.
- Not breaching: Process as normal for missing data points that do not satisfy the threshold condition.
Reference
- For alert policies created before the December 2025 release, missing data is handled with the default Ignore, and from the December 2025 release onward, you can directly choose how to handle missing data.
- The method for handling missing data in the alarm policy can be modified, and from the point of modification, missing data will be processed using the changed method.
Alert History
The change history for alarm status is recorded in the alarm history. The alarm history can be viewed for 30 days.
11.1.3 - Log
Log
ServiceWatch logs allow you to monitor, store, and access log files collected from the resources of the services that provide logs.
| Log Group1 | Log Group1 | Log Group1 | Log Group2 | Log Group2 | Log Group2 |
|---|---|---|---|---|---|
| Log Stream1 | Log Stream2 | Log Stream3 | Log StreamA | Log StreamB | Log StreamC |
| Log Event | Log Event | Log Event | Log Event | Log Event | Log Event |
| Log Event | Log Event | Log Event | Log Event | Log Event | … |
Table. Log Configuration - Log Group, Log Stream, Log Event
Reference
As an example of the log configuration, it is as follows.
- 📂 Log group: “WebApp-Logs”
- 📄 log stream 1: “Server-1”
- 📝 Log Event 1: “[2025-03-20 10:00:01] User logged in”
- 📝 Log event 2: “[2025-03-20 10:05:34] Database connection error”
Log Group
A log group is a container for log streams that share the same retention policy settings, each log stream must belong to one log group, for example, if there are separate log streams for the logs of each Kubernetes Engine cluster, the log streams can be bundled into one log group named /scp/ske/{cluster name}.
Log Retention Policy
The log retention policy allows you to set the period during which log events are stored in ServiceWatch. Log events that have expired are automatically deleted. Log The retention period assigned to the group applies to the log streams and log events belonging to the log group.
The retention period can be selected from the following, and it is set in units of days.
| Preservation period |
|---|
|
Table. Log group retention policy period
Log Stream
A log stream is a collection of log events that are ordered by the time they occurred, from the same source, for example, all log events occurring in a specific Kubernetes Engine cluster can constitute one log stream.
Log Event
A log event is an individual record of a log that occurs from a resource. The log event record includes two properties: a timestamp of when the event occurred and a log message. Each message must be encoded in UTF-8.
Export log group
You can export log data from the log group to Object Storage for log archiving and log analysis, and you can also export log data within the same account to the log group.
To start logging group export, you must create an Object Storage bucket to store log data.
Exporting a log group can take a long time depending on the amount of log, when exporting a log group, you can specify a specific stream within the log group, or specify a time range to reduce the time it takes to export the log group.
Exporting a log group can only be executed once at a time for the same Account. To run another log group export, the current export task in progress must be completed.
| Log group export status | Description |
|---|---|
| Success | The log group export task was completed successfully. |
| Pending | Log group export task is pending. |
| In progress | The log group export task is in progress. |
| File transferring | Log group export file is being transferred. |
| Failed | The log group export task failed. |
Table. Log group export status
11.1.4 - event
The event represents a change in the environment in the Samsung Cloud Platform service.
Most events generated in Samsung Cloud Platform services are received by ServiceWatch. Events of each service can be viewed and processed in the ServiceWatch of the same Account.
Refer to the list of services that send events via ServiceWatch and the events those services send in the ServiceWatch Event Reference.
Each service sends events to ServiceWatch based on Best Effort delivery. Best Effort delivery means that the service attempts to send all events to ServiceWatch, but occasionally some events may not be delivered.
When a valid event is delivered to ServiceWatch, ServiceWatch compares the event with the rules and then sends a notification to the alert recipients set in the event rule.
Event Rules
You can specify the actions that ServiceWatch performs on events delivered from each service to ServiceWatch. To do this, create an event rule. An event rule specifies which events are delivered to which targets.
Event rules evaluate the event when it arrives. Each event rule checks whether the event matches the rule’s pattern. If the event matches, ServiceWatch processes the event.
You can generate matching rules for incoming events based on the event data criteria (called an event pattern). If an event matches the criteria defined in the event pattern, the event is delivered to the target specified in the rule.
- Event rules basically allow you to specify a notification recipient to receive alerts when an event occurs.
- The event rules are planned to be expanded to include multiple services of the Samsung Cloud Platform as targets for receiving events when events occur. (Planned for 2026)
To create an event rule, please refer to How-to Guides > Creating Event Rules.
Event Source
ServiceWatch can select the event source as the Samsung Cloud Platform service name. You can select the service name of the event you want to receive as the event source.
| Service Category | Service |
|---|---|
| Compute | Virtual Server |
| Compute | GPU Server |
| Compute | Bare Metal Server |
| Compute | Multi-node GPU Cluster |
| Compute | Cloud Functions |
| Storage | Block Storage(BM) |
| Storage | File Storage |
| Storage | Object Storage |
| Storage | Archive Storage |
| Storage | Backup |
| Container | Kubernetes Engine |
| Container | Container Registry |
| Networking | VPC |
| Networking | Security Group |
| Networking | Load Balancer |
| Networking | DNS |
| Networking | VPN |
| Networking | Firewall |
| Networking | Direct Connect |
| Networking | Cloud LAN-Campus |
| Networking | Cloud LAN-Datacenter |
| Networking | Cloud WAN |
| Networking | Global CDN |
| Networking | GSLB |
| Database | EPAS(DBaaS) |
| Database | PostreSQL(DBaaS) |
| Database | MariaDB(DBaaS) |
| Database | MySQL(DBaaS) |
| Database | Microsoft SQL Server(DBaaS) |
| Database | CacheStore(DBaaS) |
| Data Analytics | Event Streams |
| Data Analytics | Search Engine |
| Data Analytics | Vertica(DBaaS) |
| Data Analytics | Data Flow |
| Data Analytics | Data Ops |
| Data Analytics | Quick Query |
| Application Service | API Gateway |
| Security | Key Management Service |
| Security | Config Inspection |
| Security | Certificate Manager |
| Security | Secret Vault |
| Management | Cloud Control |
| Management | Identity and Access Management(IAM) |
| Management | ID Center |
| Management | Logging&Audit |
| Management | Organization |
| Management | Resource Groups |
| Management | ServiceWatch |
| Management | Support Center |
| AI-ML | CloudML |
| AI-ML | AI&MLOps Platform |
Table. ServiceWatch event source
Event Type
The Samsung Cloud Platform service has its own resource type. Event types are classified the same as resource types, and you select the type of events from the event source to use in event rules.
The following are the event types of Virtual Server.
| Service Category | Service | Sub Service | Event Type |
|---|---|---|---|
| Compute | Virtual Server | Virtual Server | Server |
| Compute | Virtual Server | Image | Image |
| Compute | Virtual Server | Keypair | Keypair |
| Compute | Vitual Server | Server Group | Server Group |
| Compute | Virtual Server | Launch Configuration | Launch Configuration |
| Compute | Virtual Server | Auto-Scaling Group | Auto-Scaling Group |
| Compute | Virtual Server | Block Storage | Volume |
| Compute | Virtual Server | Block Storage | Snapshot |
Table. ServiceWatch - Virtual Server Event Types
For other event types available in ServiceWatch, please refer to ServiceWatch Event.
Event
The event can select all events that occur from the event type of the event source, and can select specific events.
The following are some events of the Server event type of Virtual Server.
| Service Category | Service | Sub Service | Event Type | Event |
|---|---|---|---|---|
| Compute | Virtual Server | Virtual Server | Server | Compute Virtual Server Create Start |
| Compute | Virtual Server | Virtual Server | Server | Compute Virtual Server Create End |
| Compute | Virtual Server | Virtual Server | Server | Compute Virtual Server Create Error |
| Compute | Virtual Server | Virtual Server | Server | Compute Virtual Server Delete Start |
| Compute | Virtual Server | Virtual Server | Server | Compute Virtual Server Delete End |
| Compute | Virtual Server | Virtual Server | Server | Compute Virtual Server Delete Error |
| Compute | Virtual Server | Virtual Server | Server | Compute Virtual Server Lock End |
| Compute | Virtual Server | Virtual Server | Server | Compute Virtual Server Unlock End |
| Compute | Virtual Server | Virtual Server | Server | Compute Virtual Server Stop Start |
| Compute | Virtual Server | Virtual Server | Server | Compute Virtual Server Stop Success |
| Compute | Virtual Server | Virtual Server | Server | Compute Virtual Server Start Start |
| Compute | Virtual Server | Virtual Server | Server | Compute Virtual Server Start Success |
| Compute | Virtual Server | Virtual Server | Server | Compute Virtual Server Reboot Start |
| Compute | Virtual Server | Virtual Server | Server | Compute Virtual Server Reboot End |
| Compute | Virtual Server | Virtual Server | Server | Compute Virtual Server Reboot Error |
| Compute | Virtual Server | Virtual Server | Server | Compute Virtual Server Power On Start |
| Compute | Virtual Server | Virtual Server | Server | Compute Virtual Server Power On End |
| Compute | Virtual Server | Virtual Server | Server | Compute Virtual Server Power On Error |
Table. Some events of ServiceWatch - Virtual Server Server
For other events available in ServiceWatch, see ServiceWatch Event.
Applied Resources
Set the event pattern for selected events on all resources or specific resources.
Event Pattern
If you select all event sources, event types, events, and applied resources, the event pattern setting for the event rule will be completed.
The following is an example of an event pattern set in ServiceWatch’s event rule.
Color mode
{
	"source": [ // namespace
		"Virtual Server"
	],
	"detail-type": [ // event type
		"Server"
	],
	"detail": {
		"event": [ // individual event
			"Compute Virtual Server Create End"
		]
	},
	"resources": [ // individual resources
		"srn:{offerring}::{account_id}:{region}::virtualserver:server/{resource_id}"
	]
}
{
"source": [ // namespace
"Virtual Server"
],
"detail-type": [ // event type
"Server"
],
"detail": {
"event": [ // individual event
"Compute Virtual Server Create End"
]
},
"resources": [ // individual resources
"srn:{offerring}::{account_id}:{region}::virtualserver:server/{resource_id}"
]
}To create an event rule, please refer to How-to Guides > Creating Event Rules.
Event Notification
If the event pattern is satisfied, an alert is sent to the notification recipient set in the event rule.
Reference
- Notifications can be sent to users with login history (users who have registered email or mobile phone number).
- The notification recipients can be added up to a maximum of 100 people.
- The notification reception method (E-mail or SMS) can be changed after selecting the notification target as Service > ServiceWatch on the Notification Settings page.
Notice
- Users without login history cannot be designated as notification recipients.
- Notification Settings page, by selecting the notification target Service > ServiceWatch, if you do not set the notification receiving method, you cannot receive notifications.
11.1.5 - ServiceWatch linked service
You can check the services linked with ServiceWatch.
Metrics and Log Monitoring
Below you can see the service that integrates ServiceWatch with metric and log monitoring.
Reference
For information related to basic monitoring and detailed monitoring, please refer to ServiceWatch Basic Monitoring and Detailed Monitoring.
| Service Category | Service | Namespace | Metrics Basic Monitoring | Metrics Detailed Monitoring | Log Monitoring | Guide |
|---|---|---|---|---|---|---|
| Compute | Virtual Server | Virtual Server | ○ | ○ | - | |
| Compute | GPU Server | Virtual Server | ○ | ○ | - | |
| Storage | File Storage | File Storage | ○ | ○ | - | |
| Container | Kubernetes Engine | Kubernetes Engine | ○ | - | ○ | |
| Container | Container Registry | Container Registry | ○ | - | - | |
| Networking | VPC - Internet Gateway | Internet Gateway | ○ | - | - | |
| Networking | Direct Connect | Direct Connect | ○ | - | - | |
| Database | Scalable DB(DBaaS) | Scalable DB | ○ | - | - |
Table. ServiceWatch metrics and log integration services and guide
Event
Below you can check the service that links ServiceWatch with events.
Note
For information related to event rules, refer to Event.
Refer to the Samsung Cloud Platform service list that creates events and the events at ServiceWatch Event.
| Service Category | Service | Sub Service | Event Source | Resource Type (Event Type) |
|---|---|---|---|---|
| Compute | Virtual Server | Virtual Server | Virtual Server | Server |
| Compute | Virtual Server | Image | Virtual Server | Image |
| Compute | Virtual Server | Keypair | Virtual Server | Keypair |
| Compute | Vitual Server | Server Group | Virtual Server | Server Group |
| Compute | Virtual Server | Launch Configuration | Virtual Server | Launch Configuration |
| Compute | Virtual Server | Auto-Scaling Group | Virtual Server | Auto-Scaling Group |
| Compute | Virtual Server | Block Storage | Virtual Server | Volume |
| Compute | Virtual Server | Block Storage | Virtual Server | Snapshot |
| Compute | GPU Server | GPU Server | GPU Server | Server |
| Compute | GPU Server | GPU Server | GPU Server | Image |
| Compute | Bare Metal Server | Bare Metal Server | Bare Metal Server | Bare Metal Server |
| Compute | Multi-node GPU Cluster | GPU Node | Multi-node GPU Cluster | GPU Node |
| Compute | Multi-node GPU Cluster | Cluster Fabric | Multi-node GPU Cluster | Cluster Fabric |
| Compute | Cloud Functions | Function | Cloud Functions | Cloud Functions |
| Storage | Block Storage(BM) | Block Storage(BM) | Block Storage(BM) | Volume |
| Storage | Block Storage(BM) | Volume Group(BM) | Block Storage(BM) | Volume Group |
| Storage | File Storage | File Storage | File Storage | Volume |
| Storage | Object Storage | Object Storage | Object Storage | Bucket |
| Storage | Archive Storage | Archive Storage | Archive Storage | Bucket |
| Storage | Backup | Backup | Backup | Backup |
| Container | Kubernetes Engine | Cluster | Kubernetes Engine | Cluster |
| Container | Kubernetes Engine | Node | Kubernetes Engine | Nodepool |
| Container | Container Registry | Registry | Container Registry | Container Registry |
| Container | Container Registry | Repository | Container Registry | Repository |
| Networking | VPC | VPC | VPC | VPC |
| Networking | VPC | Subnet | VPC | Subnet |
| Networking | VPC | Port | VPC | Port |
| Networking | VPC | Internet Gateway | VPC | Internet Gateway |
| Networking | VPC | NAT Gateway | VPC | NAT Gateway |
| Networking | VPC | Public IP | VPC | Public IP |
| Networking | VPC | Private NAT | VPC | Private NAT |
| Networking | VPC | VPC Endpoint | VPC | VPC Endpoint |
| Networking | VPC | VPC Peering | VPC | VPC Peering |
| Networking | VPC | Private Link Service | VPC | Private Link Service |
| Networking | VPC | Private Link Endpoint | VPC | Private Link Endpoint |
| Networking | VPC | Transit Gateway | VPC | Transit Gateway |
| Networking | Security Group | Security Group | Security Group | Security Group |
| Networking | Load Balancer | Load Balancer | Load Balancer | Load Balancer |
| Networking | Load Balancer | Load Balancer | Load Balancer | LB Listener |
| Networking | Load Balancer | LB Server Group | Load Balancer | LB Server Group |
| Networking | Load Balancer | LB Health Check | Load Balancer | LB Health Check |
| Networking | DNS | Private DNS | Private DNS | Private DNS |
| Networking | DNS | Hosted Zone | Hosted Zone | Hosted Zone |
| Networking | DNS | Public Domain Name | Public Domain Name | Public Domain Name |
| Networking | VPN | VPN | VPN | VPN Gateway |
| Networking | VPN | VPN Tunnel | VPN | VPN Tunnel |
| Networking | Firewall | Firewall | Firewall | Firewall |
| Networking | Direct Connect | Direct Connect | Direct Connect | Direct Connect |
| Networking | Cloud LAN-Campus | Campus Network | Cloud LAN - Campus (Network) | Cloud LAN - Campus (Network) |
| Networking | Cloud LAN-Datacenter | Cloud LAN Network | Cloud LAN Network | Cloud LAN Network |
| Networking | Cloud LAN-Datacenter | vDevice | Cloud LAN Network | vDevice |
| Networking | Cloud LAN-Datacenter | Interface | Cloud LAN Network | Interface |
| Networking | Cloud LAN-Datacenter | vCable | Cloud LAN Network | vCable |
| Networking | Cloud WAN | Cloud WAN Network | Cloud WAN | Network(WAN) |
| Networking | Cloud WAN | Segment | Cloud WAN | Segment |
| Networking | Cloud WAN | Segment | Cloud WAN | Segment Location |
| Networking | Cloud WAN | Segment | Cloud WAN | Segment Sharing |
| Networking | Cloud WAN | Attachment | Cloud WAN | Attachment |
| Networking | Global CDN | Global CDN | Global CDN | Global CDN |
| Networking | GSLB | GSLB | GSLB | GSLB |
| Database | EPAS(DBaaS) | EPAS(DBaaS) | EPAS | EPAS |
| Database | PostreSQL(DBaaS) | PostreSQL(DBaaS) | PostreSQL | PostreSQL |
| Database | MariaDB(DBaaS) | MariaDB(DBaaS) | MariaDB | MariaDB |
| Database | MySQL(DBaaS) | MySQL(DBaaS) | MySQL | MySQL |
| Database | Microsoft SQL Server(DBaaS) | Microsoft SQL Server(DBaaS) | Microsoft SQL Server | Microsoft SQL Server |
| Database | CacheStore(DBaaS) | CacheStore(DBaaS) | CacheStore | CacheStore |
| Database | Scalable DB(DBaaS) | Scalable DB(DBaaS) | Scalable DB | Scalable DB |
| Data Analytics | Event Streams | Event Streams | Event Streams | Event Streams |
| Data Analytics | Search Engine | Search Engine | Search Engine | Search Engine |
| Data Analytics | Vertica(DBaaS) | Vertica(DBaaS) | Vertica | Vertica |
| Data Analytics | Data Flow | Data Flow | Data Flow | Data Flow |
| Data Analytics | Data Flow | Data Flow Services | Data Flow | Data Flow Service |
| Data Analytics | Data Ops | Data Ops | Data Ops | Data Ops |
| Data Analytics | Data Ops | Data Ops Services | Data Ops | Data Ops Service |
| Data Analytics | Quick Query | Quick Query | Quick Query | Quick Query |
| Application Service | API Gateway | API Gateway | API Gateway | API Gateway |
| Application Service | Queue Service | Queue | Queue | Queue |
| Security | Key Management Service | Key Management Service | Key Management Service | Key |
| Security | Config Inspection | Config Inspection | Config Inspection | Config Inspection |
| Security | Certificate Manager | Certificate Manager | Certificate Manager | Certificate |
| Security | Secrets Manager | Secrets Manager | Secrets Manager | Secret |
| Security | Secret Vault | Secret Vault | Secret Vault | Secret |
| Management | Cloud Control | Cloud Control | Cloud Control | Landing Zone |
| Management | Identity and Access Management(IAM) | User Group | Identity and Access Management | Group |
| Management | Identity and Access Management(IAM) | User | Identity and Access Management | User |
| Management | Identity and Access Management(IAM) | policy | Identity and Access Management | policy |
| Management | Identity and Access Management(IAM) | role | Identity and Access Management | role |
| Management | Identity and Access Management(IAM) | Credential Provider | Identity and Access Management | Credential Provider |
| Management | Identity and Access Management(IAM) | My Info. | Identity and Access Management | Access Key |
| Management | ID Center | ID Center | Identity Center | ID Center |
| Management | ID Center | Permission Set | Identity Center | Permission Set |
| Management | Logging&Audit | Trail | Logging&Audit | Trail |
| Management | Organization | Organizational Structure | Organization | Organization |
| Management | Organization | Organizational Structure | Organization | Organizational account |
| Management | Organization | Organization Structure | Organization | Organization Invitation |
| Management | Organization | Organizational structure | Organization | Organizational unit |
| Management | Organization | Control Policy | Organization | Control Policy |
| Management | Organization | Organization Settings | Organization | Delegation Policy |
| Management | Resource Groups | Resource Groups | Resource Groups | Resource Group |
| Management | ServiceWatch | Dashboard | ServiceWatch | Dashboard |
| Management | ServiceWatch | Alert | ServiceWatch | Alert |
| Management | ServiceWatch | log | ServiceWatch | log group |
| Management | ServiceWatch | Event Rules | ServiceWatch | Event Rules |
| Management | Support Center | Service Request | Support | Service Request |
| Management | Support Center | Contact | Support | Contact |
| AI-ML | CloudML | CloudML | Cloud ML | Cloud ML |
| AI-ML | AI&MLOps Platform | AI&MLOps Platform | AI&MLOps Platform | AI&MLOps Platform |
Table. ServiceWatch Event Service
11.1.6 - Custom Metrics and Logs
ServiceWatch can collect user-defined custom metrics defined by the user and can collect log files from resources created by the user.
There are two ways to collect custom metrics and logs.
First, you can install the ServiceWatch Agent directly on the resource, set the resources to be collected, and collect them.
The second is that you can collect custom metrics and logs through the OpenAPI/CLI provided by ServiceWatch.
Reference
Custom metric/log collection via ServiceWatch Agent is currently only available on Samsung Cloud Platform For Enterprise. It will be offered in other offerings in the future.
Caution
ServiceWatch’s metric API incurs costs for calls. Collecting metrics via the ServiceWatch Agent also operates on an OpenAPI basis, so metric API calls incur costs.
Caution is needed to avoid excessive API calls for metric and log collection. The billable metric APIs are as follows.
| API | description |
|---|---|
| ListMetricData | Metric data list retrieval.
|
| DownloadMetricDataImage | Metric data widget image download.
|
| ListMetricInfos | Retrieve metric data.
|
| CreateCustomMetricMetas | Create custom metric meta data
|
| CreateCustomMetrics | Create custom metric data (transmission)
|
| ShowDashboard | Dashboard view
|
| ListDashboards | Dashboard list retrieval
|
| CreateDashboard | Create Dashboard
|
| SetDashboard | Edit Dashboard
|
| DeleteBulkDashboards | Delete Dashboard
|
Table. Indicator API Billing Guide
Logs incur charges based on the amount of data collected, so there is no separate charge for API calls.
※ For detailed pricing information, please refer to the ServiceWatch pricing information on the Samsung Cloud Platform Service Portal.
ServiceWatch Agent
You can install the ServiceWatch Agent on the user’s resources such as Virtual Server/GPU Server/Bare Metal Server to collect custom metrics and logs.
ServiceWatch Agent Constraints
ServiceWatch Agent Network Environment
ServiceWatch Agent is designed to collect data using OpenAPI by default, so to install and use it on server resources, external communication via the Internet must be possible. Please create an Internet Gateway in the VPC where the resources are located and set a NAT IP on the server resources so that they can communicate with the outside.
ServiceWatch Agent Supported OS Image
The OS images available for ServiceWatch Agent are as follows.
| OS Image Version | EOS Date |
|---|---|
| Alma Linux 8.10 | 2029-05-31 |
| Alma Linux 9.6 | 2025-11-17 |
| Oracle Linux 8.10 | 2029-07-31 |
| Oracle Linux 9.6 | 2025-11-25 |
| RHEL 8.10 | 2029-05-31 |
| RHEL 9.4 | 2026-04-30 |
| RHEL 9.6 | 2027-05-31 |
| Rocky Linux 8.10 | 2029-05-31 |
| Rocky Linux 9.6 | 2025-11-30 |
| Ubuntu 22.04 | 2027-06-30 |
| Ubuntu 24.04 | 2029-06-30 |
| Windows 2019 | 2029-01-09 |
| Windows 2022 | 2031-10-14 |
Table. ServiceWatch Agent usable OS Image
Provides the same as the OS Image provided by Virtual Server. Please refer to Virtual Server > OS Image provided version.
Quick Guide for Using ServiceWatch Agent
Below, we introduce a quick guide for collecting OS metrics and logs of Virtual Server in a Linux environment.
Node Exporter Installation and Configuration
- Refer to Node Exporter installation and install Node Exporter on the server for collecting custom metrics.
- If you install Node Exporter, you can collect OS metrics through Node Exporter in addition to the metrics provided by ServiceWatch’s default monitoring.
- ServiceWatch Agent Settings refer to and after downloading the ServiceWatch_Agent zip file, configure and run the ServiceWatch Manager.
- Refer to the examples/os-metric-min-examples folder in the zip file to set at least two metrics and run the ServiceWatch Agent.
Caution
Metric collection via ServiceWatch Agent is classified as custom metrics and, unlike the metrics collected by default from each service, incurs charges, so you must be careful not to set up unnecessary metric collection. Ensure that only the metrics that need to be collected are collected.
- Free provision is provided up to 10 per Account/region.
Note
For detailed information on using ServiceWatch Agent, please refer to How-to guides > Using ServiceWatch Agent.
ServiceWatch Custom Metrics and Logs API
You can collect custom metrics and logs through the OpenAPI/CLI provided by ServiceWatch.
Custom metric data and custom logs can be delivered to ServiceWatch via ServiceWatch OpenAPI/CLI, allowing you to view visualized information in the Console.
Caution
Collecting metrics via ServiceWatch OpenAPI/CLI is classified as custom metrics, and unlike the metrics that are collected by default from each service, charges apply, so you must be careful not to set up unnecessary metric collection. Make sure to configure it so that only the metrics that need to be collected are collected.
- Free provision is provided up to 10 per Account/region.
Create Custom Metric Metadata
To collect metric data generated from user resources or applications, rather than metrics provided by Samsung Cloud Platform services (e.g., Virtual Server), into ServiceWatch, you need to create custom metric metadata.
| Parameter | Explanation |
|---|---|
| namespace | Users can define a namespace in ServiceWatch that can be distinguished from other metrics
|
| metricMetas > metricName | Set the name of the metric to be collected. The metric name must be 3 to 128 characters long, including English letters, numbers, and special characters (_), and must start with an English letter.
|
| metricMetas > storageResolution | Set the collection interval for the corresponding metric. The default is 60 (1 minute) and can be set in seconds |
| metricMetas > unit | Metric unit can be set
|
| metricMetas > dimensions | You can set dimensions to identify custom metric data and visualize it in the Console. When visualizing the collected metrics in the Console, they are displayed in combinations according to the dimension (dimensions) settings. |
| metricMetas > descriptionKo | Korean description of the metric being collected |
| metricMetas > descriptionEn | English description of the metric being collected |
Table. User-defined metric metadata parameter description
For detailed information on creating custom metric metadata, see CreateCustomMetricMetas.
Create Custom Metrics
After generating custom metric metadata, you can deliver the resulting metric data to ServiceWatch using the CreateCustomMetrics API.
The transmitted metric data can be queried, separated by the configured namespace.
For detailed information on creating custom metric data, refer to CreateCustomMetrics.
Indicator Data Query
Metric data, including custom metrics, can be queried using the Console and the ListMetricInfos, ListMetricInfos API.
For detailed information on metric data retrieval, refer to ListMetricInfos and ListMetricData.
Log Stream Creation
A ServiceWatch log group is required for custom log collection. Log groups can only be created in the Console. After creating a log group in advance, you can use the log stream creation API to create a log stream to be delivered to ServiceWatch.
For detailed information on creating a log stream, refer to CreateCustomLogStream.
Log Event Creation
To collect custom logs, after creating log groups and log streams, we use the log event creation API to deliver individual log messages (log events) to ServiceWatch.
For detailed information on creating log events, refer to CreateCustomLogEvents.
11.2 - How-to guides
The user can monitor the resources created on the Samsung Cloud Platform through ServiceWatch.
Using the Dashboard
You can monitor resources from the ServiceWatch dashboard detailed information screen.
Guidance
- To use the dashboard, you must first create a dashboard and register monitoring metrics as widgets.
- For more information on creating a dashboard, please refer to Creating a Dashboard.
To check the detailed information of the dashboard, follow the next procedure.
- All services > Management > ServiceWatch menu is clicked. It moves to the Service Home page.
- Service Home page, click the Dashboard > Dashboard List menu. Move to the Dashboard List page.
- Dashboard List page, click the dashboard for the resource you want to monitor. It moves to the Dashboard Detail page.
- Dashboard Details page where you can select the period and time zone to monitor, and monitor resources through widgets.
| Classification | Detailed Description |
|---|---|
| Dashboard name | Name of the dashboard
|
| Period Setting Area | Period selection applied to widgets in the dashboard |
| Time zone setting area | Select the time zone to which the period setting is applied |
| Initialization Button | Initialize all operations or settings made on the dashboard detail screen |
| Refresh settings area | Select the refresh cycle of widget information
|
| Edit | Modify the information on the dashboard
|
| More | Display additional work items to manage the dashboard
|
| Widget Area | Displays widgets for monitoring each resource
|
Table. Dashboard Detailed Items
Note
- By clicking the More > View Metrics button located at the top right of the widget, you can view metric information for that widget on the Metrics page.
- Metric page details can be found in Viewing Metrics.
Setting up dashboard favorites
You can bookmark frequently used dashboards to easily move to the corresponding dashboard from the Service Home page of ServiceWatch.
To bookmark the dashboard, follow the following procedure.
- All services > Management > ServiceWatch menu is clicked. It moves to the Service Home page.
- Service Home page, click the Dashboard > Dashboard List menu. Move to the Dashboard List page.
- Dashboard List page, check the favorite icon of the dashboard to be bookmarked. Click the dashboard to check the detailed information. It moves to the Dashboard Details page.
- Bookmarked dashboards will be added to the bottom of the Dashboard > Dashboard Bookmark menu and the Dashboard Bookmark section of the Service Home page.
Widget Details View
You can expand the widgets in the dashboard to check them individually.
To view individual widgets enlarged, follow the next procedure.
- All services > Management > ServiceWatch menu is clicked. It moves to the Service Home page.
- Service Home page, click the Dashboard > Dashboard List menu. Move to the Dashboard List page.
- Dashboard List page, click the dashboard for the resource you want to monitor. It moves to the Dashboard Details page.
- Dashboard Details page, click the Widget Enlarged View button to enlarge and check the widget. A Metric Details popup window for the corresponding widget will be opened.
| Classification | Detailed Description |
|---|---|
| Widget Name | Display name of the widget |
| Period Setting Area | Period selection applied to the widget |
| Time zone setting area | Select the time zone to which the period setting is applied |
| Initialization Button | Initialize all operations or settings made on the dashboard details screen |
| Statistics | Select statistical criteria for metrics displayed on the widget
|
| Aggregation period setting area | Select the aggregation period of widget information
|
| Refresh settings area | Select the refresh cycle of widget information
|
| Chart Area | Displays monitoring results as a chart
|
Table. Detailed Items of Metrics
Check Alert History
You can check the alert history for the metrics registered on the ServiceWatch dashboard.
To check the alert history, follow the following procedure.
- All services > Management > ServiceWatch menu is clicked. It moves to the Service Home page.
- Service Home page, click the Alert > Alert History menu. It moves to the Alert History page.
- Alert History page where you can check the alert history.
| Classification | Detailed Description |
|---|---|
| Alert Filter and Search Area | Can filter or search alert history
|
| Alert Policy Name | The name of the alert policy
|
| Condition | Warning occurrence condition and total occurrence time
|
| Division | Warning creation, warning status change information division |
| Alert Status | Current Alert Status
|
| Alert level | If the alert status is Alert status, display the alert level
|
Table. Warning History Items
Reference
You can create and manage new alert policies. For more information about alert policies, please refer to Check Alert Policy.
Monitoring metrics
You can check and monitor the metrics available on ServiceWatch.
To check the metrics, follow the next procedure.
- All services > Management > ServiceWatch menu is clicked. It moves to the Service Home page.
- Service Home page, click the metric menu. It moves to the metric page.
- Metric page, select the metrics to be monitored from the list of metrics. The monitoring chart for the selected metric will be displayed in the Selected Metric area at the bottom.
| Classification | Detailed Description |
|---|---|
| Metric list area | List of metrics that can be monitored in ServiceWatch
|
| search filter area | namespace-dimension name, metric name, resource name, resource ID, tag-key set after, apply filter button click to filter the metric list
|
Table. List of metric items
- Selected metric area, check the monitoring chart.
| Classification | Detailed Description |
|---|---|
| Period Setting Area | Period selection applied to the chart |
| Time zone setting area | Time zone selection applied to the chart |
| Initialization Button | Initialize all manipulated or set items on the chart |
| Refresh settings area | Select the refresh cycle of the chart
|
| More | Display additional work items to manage charts
|
| Graph Area | The data graph collected during the period applied to the chart
|
| Table Area | Legend Label and Statistics, Aggregation Period
|
Table. Metric Items
Note
- The statistical method is as follows.
- Total: the sum of all data point values collected during the period
- Average: the value of the total divided by the number of data points for the given period during the specified period
- Minimum: the lowest value observed during the specified period
- Maximum: the highest value observed during the specified period
- For a detailed explanation of the metric, please refer to Metric Overview.
Log Monitoring
You can monitor logs collected from the Samsung Cloud Platform service.
Notice
To check the log monitoring data, you must first create a log group and a log stream. For more information about log groups, please refer to Log Monitoring.
To check the log monitoring data, follow the following procedure.
- All services > Management > ServiceWatch menu is clicked. It moves to the Service Home page.
- Service Home page, click the Log > Log Group menu. It moves to the Log Group List page.
- Log Group List page, click the log group name to check the detailed information. It moves to the Log Group Details page.
- Log Group Details page, click the Log Stream tab. The Log Stream list will be displayed.
- Log Stream Click the log stream name to check the detailed information in the Log Stream list. It moves to the Log Stream Details page.
- Clicking the All Log Streams Query button at the top of the log stream list moves to the All Log Streams Detail page.
| Category | Detailed Description |
|---|---|
| Excel Download | Possible to download log stream history as an Excel file |
| Time Stamp List | Message List by Time Stamp
|
Table. Log group details - Log stream detailed items
Event notification reception
You can create system event rules for changes to resources created on the Samsung Cloud Platform and receive them as notifications.
Guidance
To receive event notifications, you must first create an event rule. For more information on creating event rules, please refer to Creating Event Rules.
11.2.1 - Managing Dashboard and Widgets
You can create and manage a dashboard to monitor the resources of the services being used in the Samsung Cloud Platform Console.
Creating a dashboard
You can create a dashboard of ServiceWatch.
To create a dashboard, follow the next procedure.
- All services > Management > ServiceWatch menu is clicked. It moves to the Service Home page.
- Service Home page, click the Dashboard > Dashboard List menu. Move to the Dashboard List page.
- Dashboard List page, click the Create Dashboard button.
- Please enter the name of the dashboard.
- The name of the dashboard should be entered within 34 characters using English, numbers, and special characters (
-_).
- Add a widget to compose the dashboard. A corresponding popup window opens according to the method of adding a widget.
- Add individual widgets: You can add a single widget combined with metrics and resources. When you click the button, the Add individual widgets popup window opens.
| Classification | Necessity | Detailed Description |
|---|---|---|
| metric list area | required | list of metrics that can be monitored in ServiceWatch
|
| search filter area | selection | namespace-dimension name, metric name, resource name, resource ID, tag-key are set, and then filter apply button is clicked to filter the metric list
|
| Selected Metric Area | - | Monitoring Chart for the Selected Metric in the Metric List Area
|
Table. Individual widget addition items
- Multiple Widget Addition: You can add multiple widgets at once by selecting the desired resources by metric unit. When you click the button, the Multiple Widget Addition popup window opens.
| Classification | Necessity | Detailed Description |
|---|---|---|
| Service and Resource List | Required | Select resources to add metrics
|
| selection metric | essential | displays the list of metrics selected from the service and resource list
|
| Selected Resources | Required | Selected Metrics list, add resources to the selected metrics
|
| Statistics | Required | Select the statistical criteria for the metric value
|
| Accumulation period | Required | Select the unit of accumulation period for the metric value
|
Table. Multiple widget addition items
- Dashboard Import: You can import widgets from the dashboard registered in ServiceWatch. When you click the button, the Dashboard Import popup window opens.
| Classification | Necessity | Detailed Description |
|---|---|---|
| dashboard | required | Displays a list of dashboards registered in ServiceWatch
|
| Preview | Required | Displays widgets applied to the dashboard selected in the dashboard list
|
Table. Dashboard Loading Items
- Click the Complete button on the widget add popup window. The widget will be added to the dashboard on the dashboard creation page.
- After checking the added widget, click the Complete button. A pop-up window announcing the creation of the dashboard will open.
- Confirm button should be clicked. Dashboard creation will be completed.
Check the dashboard
Dashboard List page where you can check the information of the selected dashboard.
To check the dashboard, follow the next procedure.
- All services > Management > ServiceWatch menu is clicked. It moves to the Service Home page.
- Service Home page, click the Dashboard > Dashboard List menu. Move to the Dashboard List page.
- Dashboard List page, click the dashboard to check the detailed information. It moves to the Dashboard Details page.
| Classification | Detailed Description |
|---|---|
| Dashboard Name | Name of the dashboard display
|
| Period Setting Area | Period selection applied to widgets in the dashboard |
| Time zone setting area | Select the time zone to which the period setting is applied |
| Initialization Button | Initialize all operations or settings made on the dashboard detail screen |
| Refresh settings area | Select the refresh cycle of widget information
|
| Edit | Modify the name of the dashboard or manage widgets
|
| More | Displays additional work items for managing the dashboard
|
| Widget Area | Display widgets for monitoring each resource
|
Table. Dashboard Details
Managing Dashboard
Dashboard Details page where you can modify or manage dashboard information and widgets.
Modifying the dashboard
You can modify the name of the dashboard or change the widget composition.
To modify the dashboard, follow the following procedure.
- All services > Management > ServiceWatch menu is clicked. It moves to the Service Home page.
- Service Home page, click the Dashboard > Dashboard List menu. Move to the Dashboard List page.
- Dashboard List page, click the dashboard to check the detailed information. It moves to the Dashboard Details page.
- Dashboard Details page’s top right Edit button is clicked. It moves to the Dashboard Edit page.
- After modifying the information or widgets on the dashboard, click the Save button.
Classification Detailed Description Dashboard Name The name of the dashboard can be modified - Enter within 3~40 characters using English, numbers, and special characters (
-_)
- Cannot use the existing registered dashboard name
Widget Name Widget Name Editable - Use English, numbers, spaces, and special characters (
-_.|) to enter within 3 ~ 255 characters
Widget Management When the mouse cursor is placed on the widget, the management button is displayed on the right side of the widget border - Edit: Widget modification is possible in the Widget Edit popup window, where you can modify the widget’s metrics and resources
- For more information on widget editing, see Individual Widget Editing in Widget Management
- Duplicate: Duplicate the current widget and add it to the dashboard
- Delete: Delete the current widget from the dashboard
- Expand: Expand the size of the current widget to display
- Shrink: If expanded, clicking again will shrink the widget size
Add Widget Add a new widget to the dashboard - Add Individual Widget: Add a single widget combined with metrics and resources
- Add Multiple Widgets: Select the desired resources by metric unit to add multiple widgets at once
- Load Dashboard: Load widgets from other dashboards and add them
- For more information on how to add widgets, see Create a Widget
Table. Dashboard Modification Items - Enter within 3~40 characters using English, numbers, and special characters (
Check detailed dashboard information
You can check detailed information about the dashboard.
To check the detailed information of the dashboard, please follow the following procedure.
- All services > Management > ServiceWatch menu is clicked. It moves to the Service Home page.
- Service Home page, click the Dashboard > Dashboard List menu. It moves to the Dashboard List page.
- Dashboard List page, click the dashboard to check the detailed information. It moves to the Dashboard Details page.
- Dashboard Details page’s upper right corner More > Details button click. Dashboard Details popup window opens.
| Classification | Detailed Description |
|---|---|
| Service | Service Name |
| Resource Type | Resource Type |
| SRN | unique resource ID in Samsung Cloud Platform
|
| Resource Name | Resource Name
|
| Resource ID | Unique resource ID in the service |
| Creator | The user who created the service |
| Creation Time | The time when the service was created |
| Editor | User who modified the service information |
| Revision Time | Time when service information was revised |
Table. Dashboard Details - Detailed Information Popup Window Items
Check the dashboard source code
You can check the source code of the dashboard.
To check the source code of the dashboard, follow the next procedure.
- All services > Management > ServiceWatch menu is clicked. It moves to the Service Home page.
- Service Home page, click the Dashboard > Dashboard List menu. It moves to the Dashboard List page.
- Dashboard List page, click the dashboard to check the detailed information. It moves to the Dashboard Details page.
- Dashboard Details page’s upper right corner click the More > View Source button. Dashboard Source View popup window opens.
| Classification | Detailed Description |
|---|---|
| Source Information | Display dashboard source code in JSON format |
| code copy | copy source code to clipboard |
Fig. Dashboard Details - Dashboard Source View Popup Window Items
Dashboard duplication
You can currently replicate a widget on the dashboard and add it to another dashboard.
Guidance
To replicate the dashboard, user permissions are required.
- User: {email}
- Action: iam:CreatGroup
- On resource: {SRN}
- Context: no identity-based policy allows the action
To replicate the dashboard, follow the following procedure.
- All services > Management > ServiceWatch menu is clicked. It moves to the Service Home page.
- Service Home page, click the Dashboard > Dashboard List menu. It moves to the Dashboard List page.
- Dashboard List page, click the dashboard to check the detailed information. It moves to the Dashboard Details page.
- Dashboard Details page’s upper right corner More > Duplicate button, click. Dashboard Duplicate popup window opens.
- Select the dashboard replication method and enter the required information. The required information varies depending on the replication method.
| Classification | Necessity | Detailed Description |
|---|---|---|
| Clone target | - | Name of the dashboard to be cloned |
| Replication Method | Required | After replicating the widget on the dashboard, select the dashboard to add
|
| Dashboard Name | Required | Enter the name of the new dashboard to be created
|
| dashboard selection | required | select a dashboard to add a replicated widget among the existing created dashboards
|
Table. Dashboard Replication Items
- When the essential information input is complete, click the completed button. A popup window announcing the dashboard replication will open.
- Click the Confirm button on the popup window. The dashboard replication task will be completed.
Delete Dashboard
You can delete the dashboard that is not used.
To delete the dashboard, follow the following procedure.
- All services > Management > ServiceWatch menu is clicked. It moves to the Service Home page.
- Service Home page, click the Dashboard > Dashboard List menu. Move to the Dashboard List page.
- Dashboard List page, select the checkbox of the dashboard to be deleted, and then click the Delete button. A popup window announcing the deletion of the dashboard will open.
- You can delete multiple dashboards at the same time.
- Dashboard Details page’s top right corner has More > Delete button to delete individually.
- Enter delete in the delete confirmation input area, then click the confirm button. The dashboard will be deleted.
Managing widgets
Dashboard Details page where you can modify or manage widgets.
Modifying widgets
You can modify the widget’s metrics and resources.
To modify the widget, follow the following procedure.
- All services > Management > ServiceWatch menu, click. It moves to the Service Home page.
- Service Home page, click the Dashboard > Dashboard List menu. Move to the Dashboard List page.
- Dashboard List page, click the dashboard you want to modify the widget. It moves to the Dashboard Details page.
- Dashboard Details page, click the More > Edit Widget button located at the top right of the widget you want to modify. The Edit Widget popup window opens.
- After modifying the widget’s metrics and resources, click the Confirm button. The widget modification will be completed.
| Classification | Necessity | Detailed Description |
|---|---|---|
| Metric List Area | Required | List of metrics that can be monitored in ServiceWatch
|
| search filter area | selection | namespace-dimension name, metric name, resource name, resource ID, tag-key are set, and then filter apply button is clicked to filter the metric list
|
| Selected metric area | - | Monitoring chart for the selected metric in the metric list area
|
Table. Individual widget addition items
Widget duplication
You can copy the widget and add it to another dashboard.
Notice
To replicate the dashboard, user permissions are required.
- User: {email}
- Action: iam:CreatGroup
- On resource: {SRN}
- Context: no identity-based policy allows the action
To replicate a widget, follow the following procedure.
- All services > Management > ServiceWatch menu is clicked. It moves to the Service Home page.
- Service Home page, click the Dashboard > Dashboard List menu. Move to the Dashboard List page.
- Dashboard List page, click the dashboard to replicate. It moves to the Dashboard Details page.
- Dashboard Details page, click the More > Widget Duplicate button located at the top right of the widget to be duplicated. The Widget Duplicate popup window opens.
- Select the widget replication method and enter the required information. The required information varies depending on the replication method.
| Classification | Necessity | Detailed Description |
|---|---|---|
| Clone Target | - | Name of the dashboard to be cloned |
| Replication method | Required | After replicating the widget, select the dashboard to add
|
| dashboard selection | required | select a dashboard to add a replicated widget among the existing created dashboards
|
| Dashboard Name | Required | Enter the name of the new dashboard to be created
|
| Widget Name | Required | Enter the name of the widget when adding it to the dashboard
|
Table. Widget Duplication Items
- When the required information input is complete, click the completed button. A popup window announcing the addition of a widget will open.
- Click the Confirm button on the popup window. The widget will be replicated and added to the corresponding dashboard.
Downloading widget files
You can download widget information in the form of a file.
To download widget information, follow the next procedure.
- All services > Management > ServiceWatch menu, click. It moves to the Service Home page.
- Service Home page, click the Dashboard > Dashboard List menu. Move to the Dashboard List page.
- Dashboard List page, click the dashboard to download widget information. It moves to the Dashboard Details page.
- Dashboard Details page, click the More > File Download button located at the top right of the widget to download the widget information. The File Download popup window opens.
- Select the file download method, then click the Confirm button. The download will start.
- The download methods can be selected simultaneously.
| Classification | Detailed Description |
|---|---|
| CSV | widget’s metrics and monitoring data are converted to an Excel (*.csv) file for download |
| PNG | widget chart is converted to an image (*.png) file and downloaded |
Table. Widget file download items
Widget Metric Details
Widget’s resource and metric information can be checked on the metric page
To view the widget metrics on the metrics page, follow these procedures.
- All services > Management > ServiceWatch menu is clicked. It moves to the Service Home page.
- Service Home page, click the Dashboard > Dashboard List menu. Move to the Dashboard List page.
- Dashboard List page, click the dashboard to check the widget metrics. It moves to the Dashboard Details page.
- Dashboard Details page, click the More > View Metrics button located at the top right of the widget to be checked on the Metrics page. It moves to the Metrics page.
- The resource and metric information of the selected widget is automatically set and displayed on the Metrics page.
Reference
Metrics page for more details, please refer to View Metrics.
Widget source information
You can check the source code of the dashboard.
To check the source code of the dashboard, follow the following procedure.
- All services > Management > ServiceWatch menu is clicked. It moves to the Service Home page.
- Service Home page, click the Dashboard > Dashboard List menu. Move to the Dashboard List page.
- Dashboard List page, click the dashboard to check the detailed information. It moves to the Dashboard Details page.
- Dashboard Details page, click the More > View Source button located at the top right of the widget to check the source code. The Widget Source View popup window opens.
| Classification | Detailed Description |
|---|---|
| Source Information | Displays widget source code in JSON format |
| code copy | copy source code to clipboard |
Table. View widget source items
11.2.2 - Alert
In ServiceWatch, you can set threshold criteria for the metrics to be monitored, and create and manage alert policies so that an alert notification is generated when the set conditions are met.
Create Alert Policy
You can create an alert policy for a metric and set the alert triggering criteria.
To create an alert policy, follow these steps.
- Click the All Services > Management > ServiceWatch menu. Go to the Service Home page.
- Click the Alert > Alert Policy menu on the Service Home page. You will be taken to the Alert Policy List page.
- Alert Policy List page, click the Create Alert Policy button. It navigates to the Create Alert Policy page.
- Basic Information Input area, after entering the name and description of the alert policy, click the Select Metric button. The Select Metric popup opens.
- After selecting the metric to create an alert policy in the Metric Selection popup, click the Confirm button. The Metric and Condition Settings area will be displayed.
| Category | Required | Detailed description |
|---|---|---|
| Metric List Area | Required | List of metrics that can be monitored in ServiceWatch
|
| Search Filter Area | Select | After setting Namespace-Dimension Name, Metric Name, Resource Name, Resource ID, Tag-Key, click the Apply Filter button to filter the metric list
|
| Selected Indicator Area | - | Monitoring chart for the indicator selected in the indicator list area
|
Table. Indicator selection items
- Indicator and Condition Settings area, set the threshold values for alarm generation.
| Category | Required or not | Detailed description |
|---|---|---|
| Namespace | - | Namespace of the selected metric |
| Indicator Name | - | Name of the selected indicator |
| Unit | - | Data unit of the selected metric |
| Evaluation Scope | Required | Time range (seconds) for alarm evaluation
|
| Statistics | Required | Choose how to calculate metric data during the evaluation period
|
| Additional Configuration | Select | Set evaluation count, violation count, and missing data handling method
|
| Condition Setting | Required |
|
| Alert Level | Required | Select alert level according to importance of alert policy |
| Resource ID | - | Resource ID for metric monitoring target |
| Resource Name | - | Name of the resource targeted for metric monitoring |
Table. Indicator and Condition Setting Items
- In the Notification Settings area, select the user who will receive notifications when an alarm occurs.
- Only users with login history (users who have registered email or mobile phone number) can be added as notification recipients.
- You can add up to 100 notification recipients.
Reference
- If there is no user to add, you can create a user on the IAM service’s User Creation page. For detailed information on user creation, refer to Create User.
- Notification reception method (E-mail or SMS) can be changed after selecting the notification target Service > Alert on the Notification Settings page. For detailed information about notification settings, refer to Check Notification Settings.
- In the Add Additional Information area, after adding tag information, click the Complete button. A popup window notifying the creation of the alert policy opens.
- Confirm 버튼을 클릭하세요. 경보 정책 생성이 완료됩니다.
Reference
Creating an alert policy can take tens of minutes or more depending on the scale.
Check detailed alarm policy information
You can view and manage detailed information about the alarm policy.
To view detailed information about the alert policy, follow the steps below.
- Click the All Services > Management > ServiceWatch menu. Navigate to the Service Home page.
- On the Service Home page, click the Alert > Alert Policy menu. It navigates to the Alert Policy List page.
- Click the Alert Stage button displayed in the Alert Policy menu to filter and view only the list of alert policies for that stage.
- Alert Policy List page, click the alert policy name to view detailed information. You will be taken to the Alert Policy Details page.
| Category | Detailed description |
|---|---|
| Alert Policy Status | Status of the alert policy
|
| Delete Alarm Policy | Delete the corresponding alarm policy |
| Alert Status | Current Alert Status
|
| Metric Monitoring Chart | Metric monitoring chart for the selected period
|
| Information Category Tab | Information Category Tab for Alert Policy
|
Table. Alarm detailed items
Reference
When sorting the alarm policy names in the alarm policy list, follow the sorting rules below.
- Space and control characters
- Some special characters (
!"#$%&’()*+,-./) - numbers (
0–9) - some special characters (
;<=>?@) - English (
A–Z,a–z, case-insensitive) - the remaining special characters (
[\]^_`) - Other characters
Detailed Information
Alarm Policy List page, you can view the basic information and metric information of the selected alarm policy.
| Category | Detailed description |
|---|---|
| Service | Service Name |
| Resource Type | Resource Type |
| SRN | Unique resource ID in Samsung Cloud Platform
|
| Resource Name | Resource Name
|
| Resource ID | Unique resource ID in the service |
| Creator | User who created the service |
| Creation Date/Time | Service Creation Date/Time |
| Editor | User who modified the service information |
| Modification Date/Time | Date and time when service information was edited |
| Alert Policy Name | Name of the alert policy |
| Name space | Name space of the indicator |
| Indicator Name | Indicator Name |
| Evaluation Scope | Time Range for Alert Evaluation |
| Unit | Unit of indicator data |
| Evaluation count | Alarm policy evaluation count |
| Number of violations | Number of alert policy violations |
| Statistics | Method of calculating metric data during the evaluation period |
| Evaluation interval | Evaluation interval: evaluation range (unit) x number of evaluations |
| Condition | Condition change criteria for alert status (Alert) based on the set condition operator and threshold |
| Alert Level | Alert Level when Alert Occurs |
| Target Metric Information Area | Description of the alert policy target metric and resource ID, resource name |
Table. Alert Policy Details - Detailed Information Tab Items
Notification
You can check the notification recipients of the selected alert policy on the Alert Policy List page.
| Category | Detailed description |
|---|---|
| Notification Recipient List | Username, Creation Date/Time, Last Login Information
|
| Add Notification Recipient | Can add new notification recipient
|
Table. Alert Policy Details - Notification Tab Items
Reference
- Only users with login history (users who have registered email or mobile phone number) can be added as notification recipients.
- Notification recipients can be added up to a maximum of 100 people.
- If there are no users to add, you can create a user on the IAM service’s User Creation page. For detailed information on user creation, see Create User.
- The notification reception method (E-mail or SMS) can be changed on the Notification Settings page after selecting the notification target Service > Alert. For detailed information about notification settings, refer to Check Notification Settings.
Alert History
Alarm Policy List page allows you to view the alarm status change history of the selected alarm policy.
| Category | Detailed description |
|---|---|
| Alarm Status Change History List | Alarm Status Change DateTime, Change Status Classification Information, Alarm Description |
| View Details | Can view detailed alarm history information and source code in JSON format |
Table. Alert Policy Details - Alert History Tab Items
Tag
On the Alert Policy List page, you can view the tag information of the selected alert policy, and you can add, modify, or delete it.
| Category | Detailed description |
|---|---|
| Tag List | Tag’s Key, Value information |
| Tag Edit | Modify or delete existing tag information, or add new tags
|
Table. Alert Policy Details - Tag Tab Items
Work History
Alert Policy List page allows you to view the operation history of the selected alert policy.
| Category | Detailed description |
|---|---|
| Work History List | Resource Change History
|
Table. Alert Policy Details - Work History Tab Items
Edit Alarm Policy
You can modify the target metrics and policy settings of the alert policy.
To modify the alert policy, follow the steps below.
- Click the All Services > Management > ServiceWatch menu. Go to the Service Home page.
- Click the Alert > Alert Policy menu on the Service Home page. You will be taken to the Alert Policy List page.
- Click the alert policy name on the Alert Policy List page to view detailed information. It moves to the Alert Policy Details page.
- Alarm Policy Details page’s Detailed Information tab, click the Edit button of Metric Information. Edit Metric Information popup opens.
- After modifying the indicator information and policy settings, click the Confirm button. A popup window notifying the indicator modification will open.
- For detailed information about metric modification items, please refer to Create Alert Policy.
- Confirm 버튼을 클릭하세요. 경보 정책 수정이 완료됩니다.
Delete alert policy
You can delete unused alarm policies.
To delete the alert policy, follow these steps.
- All Services > Management > ServiceWatch Click the menu. Navigate to the Service Home page.
- Service Home page, click the Alert > Alert Policy menu. Navigate to the Alert Policy List page.
- Alert Policy List on the page, after selecting the checkbox of the alert policy to delete, click the Delete button. A popup notifying the alert policy deletion will open.
- You can delete multiple alert policies at the same time.
- You can also delete individually by clicking the Delete button at the far right of each alert policy, or by clicking the Delete Alert Policy button on the corresponding Alert Policy Details page.
- Confirm 버튼을 클릭하세요. 경보 정책이 삭제됩니다.
Reference
Deleting an alert policy can take tens of minutes or more depending on the scale.
11.2.3 - Metric
The user can monitor and manage metrics for service resources in the Samsung Cloud Platform Console.
Check the metric
You can check the metrics available on ServiceWatch.
To check the metrics, follow the next procedure.
- All services > Management > ServiceWatch menu is clicked. It moves to the Service Home page.
- Service Home page, click the metric menu. It moves to the metric page.
- Metric page’s metric list, please check the metric.
| Classification | Detailed Description |
|---|---|
| Metric list area | List of metrics that can be monitored in ServiceWatch
|
| search filter area | namespace-dimension name, metric name, resource name, resource ID, tag-key set after, filter apply button click to filter the metric list
|
Table. List of metric items
Managing Metric Charts
You can add the chart of monitoring result metrics as a widget or manage the data.
Add as a widget
To check the metric, follow the next procedure.
- All services > Management > ServiceWatch menu is clicked. It moves to the Service Home page.
- Service Home page, click the metric menu. It moves to the metric page.
- Metric page, select the metric to be monitored from the list of metrics. The monitoring chart for the selected metric will be displayed in the Selected Metric area at the bottom.
- Selected Metric area’s monitoring chart, set the table area, then click the More > Add Widget button. The Add Widget popup window opens.
- Select the widget addition method and enter the required information. The required information varies depending on the addition method.
| Classification | Necessity | Detailed Description |
|---|---|---|
| Replication method | Required | After replicating the widget, select the dashboard to add
|
| Dashboard selection | Required | Select a dashboard to add a replicated widget among the existing created dashboards
|
| Dashboard Name | Required | Enter the name of the new dashboard to be created
|
| Widget Name | Required | Enter the name of the widget when adding it to the dashboard
|
Table. Add widget items
- When the required information input is complete, click the completed button. A pop-up window announcing the addition of the widget will open.
- Click the Confirm button on the popup window. A widget will be added to the corresponding dashboard.
Monitoring chart file download
You can download the monitoring chart information in the form of a file.
To download the monitoring chart information, follow the next procedure.
- All services > Management > ServiceWatch menu is clicked. It moves to the Service Home page.
- Service Home page, click the metric menu. It moves to the metric page.
- Metric page, select the metrics to be monitored from the metric list. The monitoring chart for the selected metric will be displayed in the Selected Metric area below.
- Selected metric area’s monitoring chart, set the table area, then click the More > File Download button. The File Download popup window will open.
- Select the file download method, then click the Confirm button. The download will start.
- The download methods can be selected simultaneously.
| Classification | Detailed Description |
|---|---|
| CSV | Convert chart metrics and monitoring data to Excel (*.csv) file for download |
| PNG | chart to image(*.png) file conversion and download |
Table. Monitoring file download items
Export to Object Storage
You can store monitoring chart data in Object Storage.
Guidance
Object Storage requires user privileges to store.
- User: {email}
- Action: iam:CreatGroup
- On resource: {SRN}
- Context: no identity-based policy allows the action
To store monitoring chart data in Object Storage, follow the next procedure.
- All services > Management > ServiceWatch menu is clicked. It moves to the Service Home page.
- Service Home page, click the Metrics menu. It moves to the Metrics page.
- Metric page, select the metric to be monitored from the metric list. The monitoring chart for the selected metric will be displayed in the Selected Metric area at the bottom.
- Selected metric area’s monitoring chart, set the table area, then click the More > Object Storage Export button. The Object Storage Export popup window will open.
- After selecting a bucket to store the data, click the Complete button. A popup window announcing data storage will open.
- Click the Confirm button in the popup window. Data export will begin.
Notice
- The restrictions on the metrics that can be exported to Object Storage are as follows.
- Number of metrics: 10 or less
- Inquiry period: within 2 months (63 days)
- If the search period exceeds 2 months (63 days), only data for up to 63 days will be stored.
Note
- If there is no Object Storage to store the metric data, create an Object Storage and proceed.
- Metric data is stored in “metric name-yyyymmddhhmmss.json” file format and can be found in the ~/servicewatch/metric path of the Object Storage bucket.
Monitoring chart source view
You can check the source code of the monitoring chart.
To check the source code of the monitoring chart, follow the next procedure.
- All services > Management > ServiceWatch menu, click. It moves to the Service Home page.
- Service Home page, click the Metrics menu. It moves to the Metrics page.
- Metric page, select the metrics to be monitored from the list of metrics. The monitoring chart for the selected metric will be displayed in the Selected Metric area below.
- Selected Metric area’s monitoring chart, set the table area, then click the More > View Source button. The Widget Source View popup window opens.
| Classification | Detailed Description |
|---|---|
| Source Information | Displays the source code of the monitoring chart in JSON format |
| code copy | copy source code to clipboard |
Table. Monitoring Chart Source View Items
11.2.4 - Log
ServiceWatch allows you to create and manage log groups to generate alert notifications when the set conditions are met by setting threshold criteria for the metrics to be monitored.
Create a log group
You can create a log group for the metric.
To create a log group, follow these procedures.
- All services > Management > ServiceWatch menu is clicked. It moves to the Service Home page.
- Service Home page, click the Log > Log Group menu. It moves to the Log Group List page.
- Log Group List page, click the Create Log Group button. Move to the Create Log Group page.
- Enter the basic information and tag information required for log group creation, and then click the Complete button. A pop-up window announcing the creation of the log group will open.
| Classification | Mandatory | Detailed Description |
|---|---|---|
| Log group name | Required | Enter the name of the log group to be monitored in ServiceWatch
|
| Log retention policy | Required | Select the period to store the monitored log data |
| tag | selection | add tag information
|
Table. Log Group Creation Items
- Confirm button will be clicked. Log group creation will be completed.
Log group detailed information check
You can check and manage detailed information about the log group.
To check detailed information about the log group, follow the next procedure.
- All services > Management > ServiceWatch menu is clicked. It moves to the Service Home page.
- Service Home page, click the Log > Log Group menu. It moves to the Log Group List page.
- Log Group List page, click the log group name to check the detailed information. It moves to the Log Group Details page.
| Classification | Detailed Description |
|---|---|
| Log group status | Status of the log group
|
| Export log group | Save log data of the log group to Object Storage
|
| Log Group Delete | Delete the corresponding log group |
| Information division tab | Information division tab for log group
|
Table. Log Group Detailed Items
Note
Log Group List page, you can export data by clicking the More > Export Log Group button to store the log group in Object Storage.
Detailed Information
Log Group List page where you can check the basic information and log group information of the selected log group.
| Category | Detailed Description |
|---|---|
| Service | Service Name |
| Resource Type | Resource Type |
| SRN | Unique resource ID in Samsung Cloud Platform
|
| Resource Name | Resource Name
|
| Resource ID | Unique resource ID in the service |
| Creator | The user who created the service |
| Creation Time | Time when the service was created |
| Editor | User who modified the service information |
| Revision Time | The time when service information was revised |
| Log Group Name | Name of the log group |
| Log retention policy | Log data retention period
|
| Log Data | Total stored log data capacity (bytes) |
Table. Log group details - Detailed information tab items
Log Stream
Log Group List page where you can check the log stream of the selected log group.
| Classification | Detailed Description |
|---|---|
| All stream inquiry | Detailed information about all log streams in the log stream list can be checked
|
| Log Stream Creation | Create a new log stream
|
| Log Stream List | Log stream name and log change time
|
Table. Log group details - Log stream tab items
Tag
Log Group List page where you can check the tag information of the selected log group, and add, change or delete it.
| Classification | Detailed Description |
|---|---|
| Tag List | Tag’s Key, Value information |
| Edit tag | Modify, delete existing tag information, or add new tags
|
Table. Log group details - Tags tab items
Work History
Log Group List page where you can check the operation history of the selected log group.
| Classification | Detailed Description |
|---|---|
| Work History List | Resource Change History
|
Table. Log Group Details - Job History Tab Items
Managing log streams
You can create and manage log streams.
Creating a log stream
You can create a new log stream in the log group.
To create a hog stream, follow the next procedure.
- All services > Management > ServiceWatch menu is clicked. It moves to the Service Home page.
- Service Home page, click the Log > Log Group menu. It moves to the Log Group List page.
- Log Group List page, click the log group name to check the detailed information. It moves to the Log Group Details page.
- Log Group Details page, click the Log Stream tab. The list of log streams will be displayed.
- Create Log Stream button, the Create Log Stream popup window opens.
- Log Stream Name을 입력한 후, Confirm 버튼을 클릭하세요. Log stream creation will be completed.
- The name should be entered within 3 ~ 512 characters using English and numbers.
Log Stream Detailed Information Check
You can check and manage detailed information about the log stream.
To check detailed information about the log stream, follow the next procedure.
- All services > Management > ServiceWatch menu is clicked. It moves to the Service Home page.
- Service Home page, click the Log > Log Group menu. It moves to the Log Group List page.
- Log Group List page, click the log group name to check the detailed information. It moves to the Log Group Details page.
- Log Group Details page, click the Log Stream tab. The Log Stream list will be displayed.
- Log Stream Click the log stream name to check the detailed information in the Log Stream list. It moves to the Log Stream Details page.
- Clicking the All Log Streams Query button at the top of the log stream list will move to the All Log Streams Details page.
Classification Detailed Description Excel Download Possible to download log stream history as an Excel file Time Stamp List Message List by Time Stamp - Period Selection, User Time Zone, message input can be used for filtering
Table. Log Group Details - Log Stream Details Item
Deleting log streams
You can delete unused log streams.
To delete a log stream, follow these procedures.
- All services > Management > ServiceWatch menu is clicked. It moves to the Service Home page.
- Service Home page, click the Log > Log Group menu. Move to the Log Group List page.
- Log Group List page, click the log group name to check the detailed information. It moves to the Log Group Details page.
- Log Group Details page, click the Log Stream tab. The list of log streams will be displayed.
- Select the checkbox of the log stream to be deleted from the log stream list, then click the More > Delete button. A popup window notifying log stream deletion will be opened.
- You can delete multiple log streams at the same time.
- You can also delete them individually by clicking the delete button at the far right end of each log stream.
- Confirm button will be clicked. The log group will be deleted.
Export log group
You can store log group data in Object Storage.
To store log group data in Object Storage, follow these procedures.
- All services > Management > ServiceWatch menu is clicked. It moves to the Service Home page.
- Service Home page, click the Log > Log Group Export menu. It moves to the Log Group Export List page.
- Log Group Export List page, click the Log Group Export button. Move to the Log Group Export page.
| Classification | Mandatory | Detailed Description |
|---|---|---|
| Log group selection | Required | Select the log group to be stored in Object Storage
|
| Period selection | Selection | Select user time zone and data storage interval
|
| Storage Bucket | Required | Select a bucket to store data
|
Table. Export items in log group
- After selecting a bucket to store the data, click the Complete button. A pop-up window notifying data storage will open.
- Click the Confirm button in the popup window. Data export will begin.
- The progress can be checked on the log group export list page.
Note
- If there is no Object Storage to store log group data, create Object Storage and proceed.
- Exporting log group data may take tens of minutes or more, depending on the scale.
- If there is an ongoing log group export task in the Account, you can proceed with the export after completing the ongoing task first.
Delete log group
You can delete unused log groups.
To delete a log group, follow these procedures.
- All services > Management > ServiceWatch menu is clicked. It moves to the Service Home page.
- Service Home page, click the Log > Log Group menu. Move to the Log Group List page.
- Log Group List page, select the checkbox of the log group to be deleted, and then click the Delete button. A popup window announcing the deletion of the log group will open.
- You can delete multiple log groups at the same time.
- You can also delete them individually by clicking the Delete button at the far right of each log group or the Delete Log Group button on the corresponding Log Group Details page.
- Confirm button will be clicked. The log group will be deleted.
11.2.5 - Event
In ServiceWatch, you can check and process events generated by the Samsung Cloud Platform service.
Create Event Rules
You can create event rules to receive notifications when events occur.
To create an event rule, follow these steps.
- Click the All Services > Management > ServiceWatch menu. Navigate to the Service Home page.
- Service Home page, click the Event Rules menu. Navigate to the Event Rules List page.
- Click the Create Event Rule button on the Event Rule List page. You will be taken to the Create Event Rule page.
- Basic Information Input Enter the name and description of the event rule in the area.
- Event Pattern Settings Please set the required information in the area. The configured event pattern is entered in JSON code format in Event Pattern Settings Status.
| Category | Required | Detailed description |
|---|---|---|
| Event Source | Required | Select the service name of the event you want to receive from ServiceWatch
|
| Event Type | Required | Select the type of event from the event source to be used in the event rule
|
| Apply Event | Required | Select events to apply the event pattern from events occurring in the event type
|
| Applicable Resource | Required | Select the resource to which the event pattern will be applied
|
| Event Pattern Configuration Status | - | Converted to JSON code format and displayed according to the event pattern settings
|
Table. Event Pattern Settings Items
- Notification Settings Select the user(s) to receive the notification when an event occurs in the area.
- Only users with login history (users who have registered email or mobile phone number) can be added as notification recipients.
- Notification recipients can be added up to a maximum of 100.
Reference
- If there is no user to add, you can create a user on the IAM service’s User Creation page. For detailed information on user creation, see Create User.
- Notification reception method (E-mail or SMS) can be changed on the Notification Settings page after selecting the notification target Service > Event Rule. For detailed information about notification settings, refer to Check Notification Settings.
- Additional Information Input area, after adding tag information, click the Complete button. A popup notifying the creation of an event rule will open.
- Click the Confirm button. Event rule creation is complete.
Check detailed event rule information
You can view and manage detailed information about event rules.
Follow the steps below to view detailed information about the event rules.
- Click the All Services > Management > ServiceWatch menu. Navigate to the Service Home page.
- Click the Event Rules menu on the Service Home page. Navigate to the Event Rules List page.
- Event Rules List page, click the event name to view detailed information. You will be taken to the Event Rules Detail page.
| Category | Detailed description |
|---|---|
| Event Rule Status | Status of the event rule
|
| Delete Event Rule | Delete the corresponding event rule |
| Information Classification Tab | Information classification tab for alarm policy
|
Table. Event Rule Detailed Items
Detailed Information
On the Event Rule List page, you can view the basic information and event rule information of the selected event rule.
| Category | Detailed description |
|---|---|
| Service | Service Name |
| Resource Type | Resource Type |
| SRN | Unique resource ID in Samsung Cloud Platform
|
| Resource Name | Resource Name
|
| Resource ID | Unique resource ID in the service |
| Creator | User who created the service |
| Creation time | Service creation time |
| Editor | User who modified the service information |
| Modification Date/Time | Date and time the service information was modified |
| Event rule name | Name of the event rule |
| Event Pattern Configuration Status | Display event pattern configuration values in JSON code format
|
| Explanation | Description of event rules
|
Table. Alert Policy Details - Detailed Information Tab Items
Notification
You can check the notification recipients of the selected event rule on the Event Rule List page.
| Category | Detailed description |
|---|---|
| Notification Recipient List | Username, Creation Date, Last Login Information
|
| Add notification recipient | Ability to add new notification recipient
|
Table. Event Rule Details - Notification Tab Items
Reference
- Only users with login history (users who have registered email or mobile phone number) can be added as notification recipients.
- You can add up to 100 notification recipients.
- If there is no user to add, you can create a user on the IAM service’s User Creation page. For detailed information on user creation, see Create User.
- Notification reception method (E-mail or SMS) can be changed on the Notification Settings page after selecting the notification target as Service > Event Rule. For detailed information about notification settings, refer to Check Notification Settings.
Tag
Event Rules page allows you to view the tag information of the selected event rule, and you can add, modify, or delete it.
| Category | Detailed description |
|---|---|
| Tag List | Tag’s Key, Value information |
| Tag Edit | Modify or delete existing tag information, or add new tags
|
Table. Event Rule Details - Tag Tab Items
Work History
You can view the action history of the selected event rule on the Alert Policy List page.
| Category | Detailed description |
|---|---|
| Work History List | Resource Change History
|
Table. Event Rule Details - Work History Tab Items
Edit event pattern
You can modify the event pattern.
To modify the event pattern, follow the steps below.
- All Services > Management > ServiceWatch Click the menu. Service Home page will be displayed.
- Service Home page, click the Event Rule menu. Navigate to the Event Rule List page.
- Event Rule List page, click the event name to edit the event pattern. Event Rule Details page will be opened.
- Click the Edit button in the Event Pattern Settings on the Event Rule Details page. The Edit Event Pattern popup window opens.
- After modifying the event pattern settings, click the Confirm button. A popup notifying the event pattern modification will open.
- For detailed information on event pattern modification items, refer to Create Event Rule.
- Confirm Click the button. The event pattern modification is complete.
Delete event rules
You can delete unused event rules.
To delete the event rules, follow the steps below.
- All Services > Management > ServiceWatch Click the menu. Service Home page will be displayed.
- Click the Event Rules menu on the Service Home page. You will be taken to the Event Rules List page.
- On the Event Rule List page, after selecting the checkbox of the event rule to delete, click the Delete button. A popup notifying the deletion of the event rule will open.
- You can delete multiple event rules at the same time.
- You can also delete individually by clicking the More > Delete button at the far right of each alert policy, or by clicking the Delete Event Rule button on the Event Rule Details page.
- Confirm Click the button. The event rule will be deleted.
11.2.6 - ServiceWatch Agent Using
Users can install the ServiceWatch Agent on Virtual Server/GPU Server/Bare Metal Server, etc., to collect custom metrics and logs.
Reference
Collecting custom metrics/logs via ServiceWatch Agent is currently only available on Samsung Cloud Platform For Enterprise. It will be offered in other offerings in the future.
Caution
Metric collection via ServiceWatch Agent is classified as custom metrics and, unlike the metrics collected by default from each service, incurs charges, so you must be careful not to set up unnecessary metric collection. Ensure that only the metrics that need to be collected are collected.
ServiceWatch Agent
The agents that need to be installed on the server for collecting ServiceWatch’s custom metrics and logs can be broadly divided into two types. Prometheus Exporter and Open Telemetry Collector.
| Category | Detailed description | |
|---|---|---|
| Prometheus Exporter | Provides metrics of a specific application or service in a format that Prometheus can scrape
| |
| Open Telemetry Collector | Acts as a centralized collector that gathers telemetry data such as metrics and logs from distributed systems, processes (filtering, sampling, etc.) it, and exports it to various backends (e.g., Prometheus, Jaeger, Elasticsearch).
|
Table. Description of Prometheus Exporter and Open Telemetry Collector
Reference
To link server log files to ServiceWatch via the ServiceWatch Agent, you must first create a log group and a log stream within the log group.
- For detailed information on creating log groups and log streams, please refer to Log.
Open Telemetry Collector preset for ServiceWatch
Install according to the steps below to use the Open Telemetry Collector for collecting ServiceWatch metrics and logs on the server.
- Download the Agent file from the URL where the Agent file can be downloaded for ServiceWatch.
Notice
We will guide you to the file download link for installing the Agent for ServiceWatch through the Samsung Cloud Platform Console announcements and Support Center > 문의하기.
Color mode
wget [ServiceWatch Agent file download URL]wget [ServiceWatch Agent file download URL]- The Open Telemetry Collector Agent file for ServiceWatch can be checked as follows.
- Extract the Agent file for ServiceWatch.Color mode
unzip ServiceWatch_Agent.zipunzip ServiceWatch_Agent.zipCode block. Decompress Agent file for ServiceWatch - If the environment using ServiceWatch Agent is Linux OS, you must grant execution permission as below.Color mode
chmod +x agent/otelcontribcol_linux_amd64
chmod +x agent/servicewatch-agent-manager-linux-amd64
chmod +x agent/otelcontribcol_linux_amd64 chmod +x agent/servicewatch-agent-manager-linux-amd64Code block. Grant execution permission to Agent file for ServiceWatch Category Detailed description examples Example configuration file folder. Each folder contains example files agent.json,log.json,metric.jsonos-metrics-min-examples: Example of minimal metric configuration using Node Exporter
os-metrics-all-examples: Example of memory/filesystem Collector metric configuration using Node Exporter
gpu-metrics-min-examples: Example of minimal metric configuration using DCGM Exporter
gpu-metrics-all-examples: Example of major metric configuration using DCGM Exporter
otelcontribcol_linux_amd64 Open Telemetry Collector for Linux for ServiceWatch otelcontribcol_windows_amd64.exe Open Telemetry Collector for Windows for ServiceWatch servicewatch-agent-manager-linux-amd64 ServiceWatch Agent Manager for Linux servicewatch-agent-manager-windows-amd64.exe ServiceWatch Agent Manager for Windows Table. Agent file configuration for ServiceWatch
- Extract the Agent file for ServiceWatch.
Note
ServiceWatch Agent Manager is a tool that works with ServiceWatch to assist in configuring the OpenTelemetry Collector for efficiently sending custom metrics and logs. Through this, various custom metrics and log data can be delivered to ServiceWatch.
Define the Agent configuration file of ServiceWatch Agent Manager for the Open Telemetry Collector for ServiceWatch.
Category Detailed description namespace Custom namespace for custom metrics - A namespace is a logical separation used to distinguish and group metrics, designated as a custom metric to differentiate custom metrics.
- The namespace must be 3 to 128 characters long, consisting of letters, numbers, spaces, and special characters (
_-/), and must start with a letter.
accessKey IAM authentication key Access Key accessSecret IAM authentication key Secret Key resourceId Resource ID of the server on Samsung Cloud Platform - Example: Resource ID of Virtual Server
openApiEndpoint ServiceWatch OpenAPI Endpoint by region/offering - Example: https://servicewatch.
region.offering.samsungsdscloud.com
- The
regionandofferinginformation can be found in the Samsung Cloud Platform Console access URL
telemetryPort ServiceWatch Agent’s Telemetry Port - Usually uses port 8888. Change required if port 8888 is already in use
Table. agent.json configuration file itemsColor mode{ "namespace": "swagent-windows", # Custom namespace for custom metrics "accessKey": "testKey", # IAM authentication key Access Key "accessSecret": "testSecret", # IAM authentication key Secret Key "resourceId": "resourceID", # Resource ID on the server's Samsung Cloud Platform "openApiEndpoint": "https://servicewatch.kr-west1.e.samsungsdscloud.com", # Region/Environment-specific ServiceWatch OpenAPI Endpoint "telemetryPort": 8889 # ServiceWatch Agent's Telemetry Port (usually uses port 8888. Change if port 8888 is in use) "}{ "namespace": "swagent-windows", # Custom namespace for custom metrics "accessKey": "testKey", # IAM authentication key Access Key "accessSecret": "testSecret", # IAM authentication key Secret Key "resourceId": "resourceID", # Resource ID on the server's Samsung Cloud Platform "openApiEndpoint": "https://servicewatch.kr-west1.e.samsungsdscloud.com", # Region/Environment-specific ServiceWatch OpenAPI Endpoint "telemetryPort": 8889 # ServiceWatch Agent's Telemetry Port (usually uses port 8888. Change if port 8888 is in use) "}Code block. agent.json configuration example Define the metric configuration file for collecting metrics for ServiceWatch.
- If you want to collect metrics through the Agent, set metric.json.
Category Detailed description prometheus > scrape_configs > targets Endpoint of metric collection target - For a server, install Prometheus Exporter on the same server, so set this endpoint
- Example: localhost:9100
prometheus > scrape_configs > jobName Job Name setting. Usually set to the type of Prometheus Exporter used for metric collection - Example: node-exporter
metricMetas > metricName Set the name of the metric to be collected. The metric name must be 3 to 128 characters long, including English letters, numbers, and special characters ( _), and must start with an English letter.- Example: node_cpu_seconds_total
metricMetas > dimensions Set the label among the Collector’s labels provided to identify the source of the Exporter’s metric data, for visualizing on the Console. When visualizing the collected metrics on the Console, they are displayed in combinations according to the dimensions setting. - Example: If no special label is provided, as with the metrics of Node Exporter’s Memory Collector, set it to resource_id
- Example: The metrics of Node Exporter’s Filesystem Collector can have the dimension set to mountpoint, which represents the path where the filesystem is mounted on the system
metricMetas > unit Metric unit can be set - Example: Bytes, Count, etc.
metricMetas > aggregationMethod Method of aggregating based on the specified dimension(s) - Example: Choose among SUM, MAX, MIN, COUNT
metricMetas > descriptionKo Korean description of the metric being collected metricMetas > descriptionEn English description of the metric being collected Table. metric.json configuration file itemsColor mode{ "prometheus": { "scrape_configs": { "targets": [" "localhost:9100" # Endpoint of the Prometheus Exporter installed on the server ], "jobName": "node-exporter" # Usually set to the name of the installed Exporter } }, "metricMetas": [ { "metricName": "node_memory_MemTotal_bytes", # Set the metric name to be linked with ServiceWatch among the metrics collected from the Prometheus Exporter "dimensions": [ [ "resource_id" # Set the label for visualizing on the Console among the Collector's labels provided to identify the source of Node Exporter's metric data. # If there is no special label provided, such as the relevant Memory-related metric, set it to resource_id ] ], "unit": "bytes", # Collection metric data unit "aggregationMethod": "SUM", # aggregation method "descriptionKo": "Total physical memory size of the server", # Indicator's Korean description "descriptionEn": "node memory total bytes" # English description of the metric }, { "metricName": "node_filesystem_size_bytes", # Set the metric name to be linked with ServiceWatch among the metrics collected from the Prometheus Exporter "dimensions": [ [ "mountpoint" # Set the label for visualization on the Console among the Collector's labels provided to identify the source of Node Exporter's metric data. # Set dimension (dimensions) as mountpoint indicating the path where the filesystem related to the Filesystem metric is mounted on the system ] ], "unit": "bytes", "aggregationMethod": "SUM", "descriptionKo": "node filesystem size bytes", "descriptionEn": "node filesystem size bytes" }, { "metricName": "node_memory_MemAvailable_bytes", "dimensions": [ [ "resource_id" ] ], "unit": "bytes", "aggregationMethod": "SUM", "descriptionKo": "node memory available bytes", "descriptionEn": "node memory available bytes" }, { "metricName": "node_filesystem_avail_bytes", "dimensions": [ [ "mountpoint" ] ], "unit": "bytes", "aggregationMethod": "SUM", "descriptionKo": "node filesystem available bytes", "descriptionEn": "node filesystem available bytes" } ] "}{ "prometheus": { "scrape_configs": { "targets": [" "localhost:9100" # Endpoint of the Prometheus Exporter installed on the server ], "jobName": "node-exporter" # Usually set to the name of the installed Exporter } }, "metricMetas": [ { "metricName": "node_memory_MemTotal_bytes", # Set the metric name to be linked with ServiceWatch among the metrics collected from the Prometheus Exporter "dimensions": [ [ "resource_id" # Set the label for visualizing on the Console among the Collector's labels provided to identify the source of Node Exporter's metric data. # If there is no special label provided, such as the relevant Memory-related metric, set it to resource_id ] ], "unit": "bytes", # Collection metric data unit "aggregationMethod": "SUM", # aggregation method "descriptionKo": "Total physical memory size of the server", # Indicator's Korean description "descriptionEn": "node memory total bytes" # English description of the metric }, { "metricName": "node_filesystem_size_bytes", # Set the metric name to be linked with ServiceWatch among the metrics collected from the Prometheus Exporter "dimensions": [ [ "mountpoint" # Set the label for visualization on the Console among the Collector's labels provided to identify the source of Node Exporter's metric data. # Set dimension (dimensions) as mountpoint indicating the path where the filesystem related to the Filesystem metric is mounted on the system ] ], "unit": "bytes", "aggregationMethod": "SUM", "descriptionKo": "node filesystem size bytes", "descriptionEn": "node filesystem size bytes" }, { "metricName": "node_memory_MemAvailable_bytes", "dimensions": [ [ "resource_id" ] ], "unit": "bytes", "aggregationMethod": "SUM", "descriptionKo": "node memory available bytes", "descriptionEn": "node memory available bytes" }, { "metricName": "node_filesystem_avail_bytes", "dimensions": [ [ "mountpoint" ] ], "unit": "bytes", "aggregationMethod": "SUM", "descriptionKo": "node filesystem available bytes", "descriptionEn": "node filesystem available bytes" } ] "}Code block. metric.json configuration example
- If you want to collect metrics through the Agent, set metric.json.
Define the Log configuration file for log collection for ServiceWatch.
- If you want to collect logs, you need to configure log.json.
Category Detailed description fileLog > include Log file location to collect fileLog > operators Definition for parsing log messages to be collected fileLog > operators > regex Express log message format as a regular expression fileLog > operators > timestamp The format of the Time Stamp of the log message to be sent to ServiceWatch logMetas > log_group_value Log group name created to send logs to ServiceWatch logMetas > log_stream_value ServiceWatch log group log stream name Table. log.json configuration file itemsColor mode{ "fileLog": { "include": [ "/var/log/syslog", # Log file to be collected by ServiceWatch "/var/log/auth.log" ], "operators": { "regex": "^(?P<timestamp>\\S+)\\s+(?P<hostname>\\S+)\\s+(?P<process>[^:]+):\\s+(?P<message>.*)$", # Represent log file format with regex "timestamp": { # Set the format of the log message's Time Stamp "layout_type": "gotime", "layout": "2006-01-02T15:04:05.000000Z07:00" } } }, "logMetas": { "log_group_value": "custom-log-group", # Log group name of ServiceWatch created in advance "log_stream_value": "custom-log-stream" # The log stream name within the pre-created ServiceWatch log group } }{ "fileLog": { "include": [ "/var/log/syslog", # Log file to be collected by ServiceWatch "/var/log/auth.log" ], "operators": { "regex": "^(?P<timestamp>\\S+)\\s+(?P<hostname>\\S+)\\s+(?P<process>[^:]+):\\s+(?P<message>.*)$", # Represent log file format with regex "timestamp": { # Set the format of the log message's Time Stamp "layout_type": "gotime", "layout": "2006-01-02T15:04:05.000000Z07:00" } } }, "logMetas": { "log_group_value": "custom-log-group", # Log group name of ServiceWatch created in advance "log_stream_value": "custom-log-stream" # The log stream name within the pre-created ServiceWatch log group } }Code block. log.json configuration example
- If you want to collect logs, you need to configure log.json.
Reference
To link the server’s log files to ServiceWatch via the ServiceWatch Agent, you must first create a log group and a log stream within the log group.
- For detailed information on creating log groups and log streams, please refer to Log.
Running Open Telemetry Collector for ServiceWatch
ServiceWatch Agent Execution Method
[SerivceWatch Agent executable] -action [run|stop] - dir [configuration file location] -collector [Open Telemetry Collector executable location]
| Execution Options | Detailed Description |
|---|---|
-action | Action setting (run or stop) |
-dir | agent.json, metric.json, log.json location of ServiceWatch Agent configuration files such as |
-collector | Open Telemetry Collector executable file location |
Table. log.json configuration file items
ServiceWatch Agent Execution (for Linux)
Reference
agent.json, metric.json, log.json files are in current location/agent/examples/os-metrics-min-examples, and assuming the otelcontribcol_linux_amd64 file is in current location/agent, run as follows.Run the ServiceWatch Agent.
agent.json,metric.json,log.jsonfile locations andservicewatch-agent-manager-linux-amd64,otelcontribcol_linux_amd64file locations are checked to start the ServiceWatch Agent.Color mode./agent/servicewatch-agent-manager-linux-amd64 -action run -dir ./agent/examples/os-metrics-min-examples -collector ./agent/otelcontribcol_linux_amd64./agent/servicewatch-agent-manager-linux-amd64 -action run -dir ./agent/examples/os-metrics-min-examples -collector ./agent/otelcontribcol_linux_amd64Code block. ServiceWatch Agent start - Collect all metrics/logs - If you only want to collect metrics, rename the
log.jsonfile to a different name or move it so that it is not in a directory such asagent.json,metric.json, and run as below.Color mode./agent/servicewatch-agent-manager-linux-amd64 -action run -dir ./agent/examples/os-metrics-min-examples -collector ./agent/otelcontribcol_linux_amd64./agent/servicewatch-agent-manager-linux-amd64 -action run -dir ./agent/examples/os-metrics-min-examples -collector ./agent/otelcontribcol_linux_amd64Code block. ServiceWatch Agent start - collect only metrics - If you only want to collect logs, rename the
metric.jsonfile to a different filename or move it so that it is not in the same directory asagent.json,log.json, and then run as shown below.Color mode./agent/servicewatch-agent-manager-linux-amd64 -action run -dir ./agent/examples/os-metrics-min-examples -collector ./agent/otelcontribcol_linux_amd64./agent/servicewatch-agent-manager-linux-amd64 -action run -dir ./agent/examples/os-metrics-min-examples -collector ./agent/otelcontribcol_linux_amd64Code block. ServiceWatch Agent start - collect only logs
Stop the ServiceWatch Agent.
Color mode./agent/servicewatch-agent-manager-linux-amd64 -action stop -dir ./agent/examples/os-metrics-min-examples./agent/servicewatch-agent-manager-linux-amd64 -action stop -dir ./agent/examples/os-metrics-min-examplesCode block. ServiceWatch Agent stop
ServiceWatch Agent Run (for Windows)
Run the ServiceWatch Agent.
Color modeservicewatch-agent-manager-windows-amd64.exe -action run -dir ./examples -collector otelcontribcol_windows_amd64.exeservicewatch-agent-manager-windows-amd64.exe -action run -dir ./examples -collector otelcontribcol_windows_amd64.exeCode block. ServiceWatch Agent start Stop the ServiceWatch Agent.
Color modeservicewatch-agent-manager-windows-amd64.exe -action stop -dir ./examplesservicewatch-agent-manager-windows-amd64.exe -action stop -dir ./examplesCode block. ServiceWatch Agent stop
11.3 - API Reference
API Reference
11.4 - CLI Reference
CLI Reference
11.5 - ServiceWatch Event Reference
The event represents a change in the environment of the Samsung Cloud Platform service. The following is an example of the event.
- Virtual Server’s status changes from Stopped to Running when an event is created.
- Object Storage creates an event when a new bucket is created.
- It creates an event when the IAM user is excluded from the user group.
Reference
이벤트를 생성하는 Samsung Cloud Platform 서비스 목록과 이벤트는 ServiceWatch Event을 참조하세요. should be translated to: Please refer to ServiceWatch Event for the list of Samsung Cloud Platform services that create events and events.
11.5.1 - ServiceWatch Event
Reference
The events of Samsung Cloud Platform service may vary by region.
| Service Category | Service | Event Source |
|---|---|---|
| Compute | Virtual Server | Virtual Server |
| Compute | GPU Server | GPU Server |
| Compute | Bare Metal Server | Bare Metal Server |
| Compute | Multi-node GPU Cluster | Multi-node GPU Cluster |
| Compute | Cloud Functions | Cloud Functions |
| Storage | Block Storage(BM) | Block Storage(BM) |
| Storage | File Storage | fiFile Storagelestorage |
| Storage | Object Storage | Object Storage |
| Storage | Archive Storage | Archive Storage |
| Storage | Backup | Backup |
| Container | Kubernetes Engine | Kubernetes Engine |
| Container | Container Registry | Container Registry |
| Networking | VPC | VPC |
| Networking | Security Group | Security Group |
| Networking | Load Balancer | Load Balancer |
| Networking | DNS | Private DNS Hosted Zone Public Domain Name |
| Networking | VPN | VPN |
| Networking | Firewall | Firewall |
| Networking | Direct Connect | Direct Connect |
| Networking | Cloud LAN-Campus | Cloud LAN - Campus (Network) |
| Networking | Cloud LAN-Datacenter | Cloud LAN Network |
| Networking | Cloud WAN | Cloud WAN |
| Networking | Global CDN | Global CDN |
| Networking | GSLB | GSLB |
| Database | EPAS(DBaaS) | EPAS |
| Database | PostreSQL(DBaaS) | PostreSQL |
| Database | MariaDB(DBaaS) | MariaDB |
| Database | MySQL(DBaaS) | MySQL |
| Database | Microsoft SQL Server(DBaaS) | Microsoft SQL Server |
| Database | CacheStore(DBaaS) | CacheStore |
| Database | Scalable DB(DBaaS) | Scalable DB |
| Data Analytics | Event Streams | Event Streams |
| Data Analytics | Search Engine | Search Engine |
| Data Analytics | Vertica(DBaaS) | Vertica |
| Data Analytics | Data Flow | Data Flow |
| Data Analytics | Data Ops | Data Ops |
| Data Analytics | Quick Query | Quick Query |
| Application Service | API Gateway | API Gateway |
| Application Service | Queue Service | Queue |
| Security | Key Management Service | Key Management Service |
| Security | Config Inspection | Config Inspection |
| Security | Certificate Manager | Certificate Manager |
| Security | Secrets Manager | Secret |
| Security | Secret Vault | Secret Vault |
| Management | Cloud Control | Cloud Control |
| Management | IAM | Identity and Access Management |
| Management | ID Center | Identity Center |
| Management | Logging&Audit | Logging&Audit |
| Management | Organization | Organization |
| Management | Resource Groups | Resource Group |
| Management | ServiceWatch | ServiceWatch |
| Management | Support Center | Support |
| AI-ML | CloudML | Cloud ML |
| AI-ML | AI&MLOps Platform | AI&MLOps Platform |
Table. ServiceWatch event source
11.5.1.1 - Multi-node GPU Cluster
Multi-node GPU Cluster event
Multi-node GPU Cluster service event list to be passed to ServiceWatch.
| Service Category | Service | Sub Service | Event Source | Event Type |
|---|---|---|---|---|
| Compute | Multi-node GPU Cluster | GPU Node | Multi-node GPU Cluster | GPU Node |
| Compute | Multi-node GPU Cluster | Cluster Fabric | Multi-node GPU Cluster | Cluster Fabric |
Table. Multi-node GPU Cluster event types
GPU Node
| Event Source | Event Type | Event |
|---|---|---|
| Multi-node GPU Cluster | GPU Node |
|
Table. Multi-node GPU Cluster - GPU Node event types of events
Cluster Fabric
| Event Source | Event Type | Event |
|---|---|---|
| Multi-node GPU Cluster | Cluster Fabric |
|
Table. Multi-node GPU Cluster - Cluster Fabric event type events
11.5.1.2 - MySQL(DBaaS)
MySQL(DBaaS) event
MySQL(DBaaS) service event list to be passed to ServiceWatch.
| Service Category | Service | Sub Service | Event Source | Event Type |
|---|---|---|---|---|
| Database | MySQL(DBaaS) | MySQL(DBaaS) | MySQL | MySQL |
Table. MySQL(DBaaS) event types
MySQL
| Event Source | Event Type | Event |
|---|---|---|
| MySQL | MySQL |
|
Table. MySQL - Event types of MySQL events
11.5.1.3 - Global CDN
Global CDN Event
Global CDN service event list to be passed to ServiceWatch.
| Service Category | Service | Sub-service | Event Source | Event Type |
|---|---|---|---|---|
| Networking | Global CDN | Global CDN | Global CDN | Global CDN |
Table. Global CDN event types
Global CDN
| Event Source | Event Type | Event |
|---|---|---|
| Global CDN | Global CDN |
|
Table. Global CDN - Global CDN event type events
11.5.1.4 - Data Flow
Data Flow event
Data Flow service event list to be passed to ServiceWatch.
| Service Category | Service | Sub Service | Event Source | Event Type |
|---|---|---|---|---|
| Data Analytics | Data Flow | Data Flow | Data Flow | Data Flow |
| Data Analytics | Data Flow | Data Flow Services | Data Flow | Data Flow Service |
Table. Data Flow event types
Data Flow
| Event Source | Event Type | Event |
|---|---|---|
| Data Flow | Data Flow |
|
Table. Data Flow - Data Flow event type events
Data Flow Service
| Event Source | Event Type | Event |
|---|---|---|
| Data Flow Services | Data Flow Service |
|
Table. Data Flow - Data Flow Service event types of events
11.5.1.5 - GSLB
GSLB event
GSLB service list of events passed to ServiceWatch.
| Service Category | Service | Sub Service | Event Source | Event Type |
|---|---|---|---|---|
| Networking | GSLB | GSLB | GSLB | GSLB |
Table. GSLB Event Types
GSLB
| Event Source | Event Type | Event |
|---|---|---|
| GSLB | GSLB(cdn) |
|
Table. GSLB - GSLB event type events
11.5.1.6 - Cloud Control
Cloud Control event
Cloud Control 서비스에서 ServiceWatch로 전달하는 이벤트 목록입니다. -> This is a list of events delivered from Cloud Control service to ServiceWatch.
| Service Category | Service | Sub Service | Event Source | Event Type |
|---|---|---|---|---|
| Management | Cloud Control | Cloud Control | Cloud Control | Cloud Control |
Table. Cloud Control event types
Landing Zone
| Event Source | Event Type | Event |
|---|---|---|
| Cloud Control | Landing Zone |
|
Table. Cloud Control - Landing Zone Event Types of Events
11.5.1.7 - Cloud WAN
Cloud WAN event
Cloud WAN service events delivered to ServiceWatch list.
| Service Category | Service | Sub Service | Event Source | Event Type |
|---|---|---|---|---|
| Networking | Cloud WAN | Cloud WAN Network | Cloud WAN | Network(WAN) |
| Networking | Cloud WAN | Segment | Cloud WAN | Segment |
| Networking | Cloud WAN | Segment | Cloud WAN | Segment Location |
| Networking | Cloud WAN | Segment | Cloud WAN | Segment Sharing |
| Networking | Cloud WAN | Attachment | Cloud WAN | Attachment |
Table. Cloud WAN event types
Network(WAN)
| Event Source | Event Type | Event |
|---|---|---|
| Cloud WAN | Network(WAN) |
|
Table. Cloud WAN - Network(WAN) event types of events
Segment
| Event Source | Event Type | Event |
|---|---|---|
| Cloud WAN | Segment |
|
Table. Cloud WAN - Segment event types of events
Segment Location
| Event Source | Event Type | Event |
|---|---|---|
| Cloud WAN | Segment Location |
|
Table. Cloud WAN - Segment Location event type events
Segment Sharing
| Event Source | Event Type | Event |
|---|---|---|
| Cloud WAN | Segment Sharing |
|
Table. Cloud WAN - Segment Sharing event type events
Attachment
| Event Source | Event Type | Event |
|---|---|---|
| Cloud WAN | Attachment |
|
Table. Cloud WAN - Attachment event types of events
11.5.1.8 - Object Storage
Object Storage event
Object Storage service event list to be passed to ServiceWatch.
| Service Category | Service | Sub Service | Event Source | Event Type |
|---|---|---|---|---|
| Storage | Object Storage | Object Storage | Object Storage | Bucket |
Table. Object Storage event types
Bucket
| Event Source | Event Type | Event |
|---|---|---|
| Object Storage | Bucket |
|
Table. Object Storage - Bucket event types of events
11.5.1.9 - VPC
VPC event
VPC service event list to be passed to ServiceWatch.
| Service Category | Service | Sub Service | Event Source | Event Type |
|---|---|---|---|---|
| Networking | VPC | VPC | VPC | VPC |
| Networking | VPC | Subnet | VPC | Subnet |
| Networking | VPC | Port | VPC | Port |
| Networking | VPC | Internet Gateway | VPC | Internet Gateway |
| Networking | VPC | NAT Gateway | VPC | NAT Gateway |
| Networking | VPC | Public IP | VPC | Public IP |
| Networking | VPC | Private NAT | VPC | Private NAT |
| Networking | VPC | VPC Endpoint | VPC | VPC Endpoint |
| Networking | VPC | VPC Peering | VPC | VPC Peering |
| Networking | VPC | Private Link Service | VPC | Private Link Service |
| Networking | VPC | Private Link Endpoint | VPC | Private Link Endpoint |
| Networking | VPC | Transit Gateway | VPC | Transit Gateway |
Table. VPC Event Types
VPC
| Event Source | Event Type | Event |
|---|---|---|
| VPC | VPC |
|
Table. VPC - VPC event type events
Subnet
| Event Source | Event Type | Event |
|---|---|---|
| VPC | Subnet |
|
Table. VPC - Subnet event types of events
Port
| Event Source | Event Type | Event |
|---|---|---|
| VPC | Port |
|
Table. VPC - Subnet event type events
Internet Gateway
| Event Source | Event Type | Event |
|---|---|---|
| VPC | Internet Gateway |
|
Table. VPC - Internet Gateway event types of events
NAT Gateway
| Event Source | Event Type | Event |
|---|---|---|
| VPC | NAT Gateway |
|
Table. VPC - NAT Gateway event type events
Public IP
| Event Source | Event Type | Event |
|---|---|---|
| VPC | Public IP |
|
Table. VPC - Public IP event type events
Private NAT
| Event Source | Event Type | Event |
|---|---|---|
| VPC | Private NAT |
|
Table. VPC - Private NAT event type events
VPC Endpoint
| Event Source | Event Type | Event |
|---|---|---|
| VPC | VPC Endpoint |
|
Table. VPC - VPC Endpoint event type events
VPC Peering
| Event Source | Event Type | Event |
|---|---|---|
| VPC | VPC Peering |
|
Table. VPC - VPC Peering event type events
Private Link Service
| Event Source | Event Type | Event |
|---|---|---|
| VPC | Private Link Service |
|
Table. VPC - Private Link Service event types of events
Private Link Endpoint
| Event Source | Event Type | Event |
|---|---|---|
| VPC | PrivateLink Endpoint |
|
Table. VPC - PrivateLink Endpoint event types of events
Transit Gateway
| Event Source | Event Type | Event |
|---|---|---|
| VPC | Transit Gateway |
|
Table. VPC - Transit Gateway event type events
11.5.1.10 - GPU Server
GPU Server event
GPU Server service event list to be passed to ServiceWatch.
| Service Category | Service | Sub Service | Event Source | Event Type |
|---|---|---|---|---|
| Compute | GPU Server | GPU Server | GPU Server | Server |
| Compute | GPU Server | Image | GPU Server |
Table. GPU Server event types
Server
| Service | Event Type | Event |
|---|---|---|
| GPU Server | Server(server) |
|
Table. GPU Server - Server event type events
Image
| Service | Event Type | Event |
|---|---|---|
| GPU Server | Image |
|
Table. GPU Server - Image event type events
11.5.1.11 - Virtual Server
Virtual Server event
Virtual Server 서비스에서 ServiceWatch로 전달하는 이벤트 목록입니다 translates to This is a list of events passed from Virtual Server service to ServiceWatch.
| Service Category | Service | Sub-service | Event Source | Event Type |
|---|---|---|---|---|
| Compute | Virtual Server | Virtual Server | Virtual Server | Server |
| Compute | Virtual Server | Image | Virtual Server | Image |
| Compute | Virtual Server | Keypair | Virtual Server | Keypair |
| Compute | Vitual Server | Server Group | Virtual Server | Server Group |
| Compute | Virtual Server | Launch Configuration | Virtual Server | Launch Configuration |
| Compute | Virtual Server | Auto-Scaling Group | Virtual Server | Auto-Scaling Group |
| Compute | Virtual Server | Block Storage | Virtual Server | Volume |
| Compute | Virtual Server | Block Storage | Virtual Server | Snapshot |
Table. Virtual Server event types
Server
| Event Source | Event Type | Event |
|---|---|---|
| Virtual Server | Server |
|
Table. Virtual Server - Server event types of events
Image
| Event Source | Event Type | Event |
|---|---|---|
| Virtual Server | Image |
|
Table. Virtual Server - Image event types of events
Keypair
| Event Source | Event Type | Event |
|---|---|---|
| Virtual Server | Keypair |
|
Table. Virtual Server - Keypair event type events
Server Group
| Event Source | Event Type | Event |
|---|---|---|
| Virtual Server | Server Group |
|
Table. Virtual Server - Server Group event types of events
Launch Configuration
| Event Source | Event Type | Event |
|---|---|---|
| Virtual Server | Launch Configuration |
|
Table. Virtual Server - Launch Configuration event type events
Auto-Scaling Group
| Event Source | Event Type | Event |
|---|---|---|
| Virtual Server | Auto-Scaling Group |
|
Table. Virtual Server - Auto-Scaling Group event types of events
Volume
| Event Source | Event Type | Event |
|---|---|---|
| Virtual Server | Volume |
|
Table. Virtual Server - Volume event types of events
Snapshot
| Event Source | Event Type | Event |
|---|---|---|
| Virtual Server | Snapshot |
|
Table. Virtual Server - Snapshot event type events
11.5.1.12 - Firewall
Firewall event
Firewall 서비스에서 ServiceWatch로 전달하는 이벤트 목록입니다. -> This is a list of events passed from the Firewall service to ServiceWatch.
| Service Category | Service | Sub Service | Event Source | Event Type |
|---|---|---|---|---|
| Networking | Firewall | firewall | Firewall | Firewall |
Table. Firewall event types
Firewall
| Event Source | Event Type | Event |
|---|---|---|
| Firewall | Firewall |
|
Table. Firewall - Firewall event types of events
11.5.1.13 - ID Center
ID Center event
ID Center 서비스에서 ServiceWatch로 전달하는 이벤트 목록입니다. -> ID Center service event list delivered to ServiceWatch: ID Center service event list delivered to ServiceWatch
| Service Category | Service | Sub-service | Event Source | Event Type |
|---|---|---|---|---|
| Management | ID Center | ID Center | Identity Center | ID Center |
| Management | ID Center | Authorization Set | Identity Center | Authorization Set |
Table. ID Center event type
ID Center
| Event Source | Event Type | Event |
|---|---|---|
| Identity Center | ID Center |
|
Table. ID Center - ID Center event type events
Authority Set
| Event Source | Event Type | Event |
|---|---|---|
| Identity Center | Permission Set |
|
Table. ID Center - Authority Set Event Type Events
11.5.1.14 - Microsoft SQL Server(DBaaS)
Microsoft SQL Server(DBaaS) event
Microsoft SQL Server(DBaaS) service event list to be passed to ServiceWatch.
| Service Category | Service | Sub Service | Event Source | Event Type |
|---|---|---|---|---|
| Database | Microsoft SQL Server(DBaaS) | Microsoft SQL Server(DBaaS) | Microsoft SQL Server | Microsoft SQL Server |
Table. Microsoft SQL Server(DBaaS) event types
Microsoft SQL Server
| Event Source | Event Type | Event |
|---|---|---|
| Microsoft SQL Server | Microsoft SQL Server |
|
Table. Microsoft SQL Server - Microsoft SQL Server event type events
11.5.1.15 - Block Storage(BM)
Block Storage(BM) event
Block Storage(BM) service event list to be passed to ServiceWatch.
| Service Category | Service | Sub Service | Event Source | Event Type |
|---|---|---|---|---|
| Storage | Block Storage(BM) | Block Storage(BM) | Block Storage(BM) | Volume |
| Storage | Block Storage(BM) | Volume Group(BM) | Block Storage(BM) | Volume Group |
Table. Block Storage(BM) event types
Volume
| Event Source | Event Type | Event |
|---|---|---|
| Block Storage(BM) | Volume |
|
Table. Block Storage(BM) - Volume event types of events
Volume Group
| Event Source | Event Type | Event |
|---|---|---|
| Volume Group(BM) | Volume Group |
|
Table. Block Storage(BM) - Volume Group event types of events
11.5.1.16 - Resource Groups
Resource Groups Event
Resource Groups service list of events passed to ServiceWatch.
| Service Category | Service | Sub Service | Event Source | Event Type |
|---|---|---|---|---|
| Management | Resource Groups | Resource Groups | Resource Groups | Resource Group |
Table. Resource Groups event types
Resource Group
| Event Source | Event Type | Event |
|---|---|---|
| Resource Groups | Resource Group |
|
Table. Resource Groups - Resource Group event types of events
11.5.1.17 - Cloud Functions
Cloud Functions event
Cloud Functions service event list to be passed to ServiceWatch.
| Service Category | Service | Sub Service | Event Source | Event Type |
|---|---|---|---|---|
| Compute | Cloud Functions | Function | Cloud Functions | Cloud Functions |
Table. Cloud Functions event types
Cloud Functions
| Event Source | Event Type | Event |
|---|---|---|
| Cloud Functions | Cloud Functions |
|
Table. Cloud Functions - Cloud Functions event type events
11.5.1.18 - AI&MLOps Platform
AI&MLOps Platform Event
AI&MLOps Platform service event list to be passed to ServiceWatch.
| Service Category | Service | Sub-service | Event Source | Event Type |
|---|---|---|---|---|
| AI-ML | AI&MLOps Platform | AI&MLOps Platform | AI&MLOps Platform | AI&MLOps Platform |
Table. AI&MLOps Platform event types
AI&MLOps Platform
| Event Source | Event Type | Event |
|---|---|---|
| AI&MLOps Platform | AI&MLOps Platform |
|
Table. AI&MLOps Platform - AI&MLOps Platform event type events
11.5.1.19 - Event Streams
Event Streams events
Event Streams service list of events passed to ServiceWatch.
| Service Category | Service | Sub Service | Event Source | Event Type |
|---|---|---|---|---|
| Data Analytics | Event Streams | Event Streams | Event Streams | Event Streams |
Table. Event Streams event types
Event Streams
| Event Source | Event Type | Event |
|---|---|---|
| Event Streams | Event Streams |
|
Table. Event Streams - Event Streams event type events
11.5.1.20 - Security Group
Security Group event
Security Group service list of events passed to ServiceWatch.
| Service Category | Service | Sub Service | Event Source | Event Type |
|---|---|---|---|---|
| Networking | Security Group | Security Group | Security Group | Security Group |
Table. Security Group event types
Security Group
| Event Source | Event Type | Event |
|---|---|---|
| Security Group | Security Group |
|
Table. Security Group - Security Group event types of events
11.5.1.21 - Archive Storage
Archive Storage event
Archive Storage 서비스에서 ServiceWatch로 전달하는 이벤트 목록입니다. -> Archive Storage service event list delivered to ServiceWatch: This is the list of events delivered from Archive Storage service to ServiceWatch.
| Service Category | Service | Sub Service | Event Source | Event Type |
|---|---|---|---|---|
| Compute | Archive Storage | Archive Storage | Archive Storage | Bucket |
Table. Archive Storage event types
Bucket
| Evans Source | Event Type | Event |
|---|---|---|
| Archive Storage | Bucket |
|
Table. Archive Storage - Bucket event types of events
11.5.1.22 - API Gateway
API Gateway event
API Gateway service event list to be passed to ServiceWatch.
| Service Category | Service | Sub Service | Event Source | Event Type |
|---|---|---|---|---|
| Application Service | API Gateway | API Gateway | API Gateway | API Gateway |
Table. API Gateway event types
API Gateway
| Event Source | Event Type | Event |
|---|---|---|
| API Gateway | API Gateway |
|
Table. API Gateway - API Gateway event type events
11.5.1.23 - Load Balancer
Load Balancer event
Load Balancer service’s list of events to be passed to ServiceWatch.
| Service Category | Service | Sub Service | Event Source | Event Type |
|---|---|---|---|---|
| Networking | Load Balancer | Load Balancer | Load Balancer | Load Balancer |
| Networking | Load Balancer | Load Balancer | Load Balancer | LB Listener |
| Networking | Load Balancer | LB server group | Load Balancer | LB Server Group |
| Networking | Load Balancer | LB Health Check | Load Balancer | LB Health Check |
Table. Load Balancer event types
Load Balancer
| Event Source | Event Type | Event |
|---|---|---|
| Load Balancer | Load Balancer(security-group) |
|
Table. Load Balancer - Load Balancer event type events
LB Listener
| Event Source | Event Type | Event |
|---|---|---|
| LB Listener | LB Listener |
|
Table. Load Balancer - LB Listener event type events
LB Server Group
| Event Source | Event Type | Event |
|---|---|---|
| LB Server Group | LB Server Group |
|
Table. Load Balancer - LB Server Group event types of events
LB Health Check
| Event Source | Event Type | Event |
|---|---|---|
| LB Health Check | LB Health Check |
|
Table. Load Balancer - LB Health Check event types of events
11.5.1.24 - Data Ops
Data Ops event
Data Ops service event list to be passed to ServiceWatch.
| Service Category | Service | Sub Service | Event Source | Event Type |
|---|---|---|---|---|
| Data Analytics | Data Ops | Data Ops | Data Ops | Data Ops |
| Data Analytics | Data Ops | Data Ops Services | Data Ops | Data Ops Service |
Table. Data Ops event types
Data Ops
| Event Source | Event Type | Event |
|---|---|---|
| Data Ops | Data Ops |
|
Table. Data Ops - Data Ops event type events
Data Ops Service
| Event Source | Event Type | Event |
|---|---|---|
| Data Ops Services | Data Ops Service |
|
Table. Data Ops - Data Ops Service event types of events
11.5.1.25 - Scalable DB(DBaaS)
Scalable DB Event
This is the list of events delivered to ServiceWatch from the Scalable DB (DBaaS) service.
| Service Category | Service | Sub Service | Event Source | Event Type |
|---|---|---|---|---|
| Data Analytics | Scalable DB(DBaaS) | Scalable DB(DBaaS) | Scalable DB | Scalable DB |
Table. Scalable DB Event Types
Scalable DB
| Event Source | Event Type | Event |
|---|---|---|
| Scalable DB | Scalable DB |
|
Table. Scalable DB - Queue event type's event
11.5.1.26 - Cloud LAN-Campus
Cloud LAN-Campus event
Cloud LAN-Campus service event list to be passed to ServiceWatch.
| Service Category | Service | Sub Service | Event Source | Event Type |
|---|---|---|---|---|
| Networking | Cloud LAN-Campus | Cloud LAN-Campus | Cloud LAN - Campus (Network) | Cloud LAN - Campus (Network) |
Table. Cloud LAN-Campus event types
Cloud LAN - Campus (Network)
| Event Source | Event Type | Event |
|---|---|---|
| Cloud LAN - Campus (Network) | Cloud LAN - Campus (Network) |
|
Table. Cloud LAN-Campus - Cloud LAN - Campus (Network) type of event
11.5.1.27 - EPAS(DBaaS)
EPAS(DBaaS) event
EPAS(DBaaS) service event list to be passed to ServiceWatch.
| Service Category | Service | Sub Service | Event Source | Event Type |
|---|---|---|---|---|
| Database | EPAS(DBaaS) | EPAS(DBaaS) | EPAS | EPAS |
Table. EPAS(DBaaS) event type
EPAS
| Event Source | Event Type | Event |
|---|---|---|
| EPAS | EPAS |
|
Table. EPAS - EPAS event type events
11.5.1.28 - PostgreSQL(DBaaS)
PostgreSQL(DBaaS) event
PostreSQL(DBaaS) service event list to be passed to ServiceWatch.
| Service Category | Service | Sub Service | Event Source | Event Type |
|---|---|---|---|---|
| Database | PostreSQL(DBaaS) | PostreSQL(DBaaS) | PostreSQL | PostgreSQL |
Table. PostreSQL(DBaaS) event types
PostreSQL
| Event Source | Event Type | Event |
|---|---|---|
| PostreSQL | PostgreSQL |
|
Table. PostgreSQL - Event types of PostgreSQL events
11.5.1.29 - Logging&Audit
Logging&Audit event
Logging&Audit service’s list of events to be passed to ServiceWatch.
| Service Category | Service | Sub Service | Event Source | Event Type |
|---|---|---|---|---|
| Management | Logging&Audit | Trail | Logging&Audit | Trail |
Table. Logging&Audit event types
Trail
| Event Source | Event Type | Event |
|---|---|---|
| Logging&Audit | Trail |
|
Table. Logging&Audit - Trail event types of events
11.5.1.30 - Search Engine
Search Engine event
Search Engine 서비스에서 ServiceWatch로 전달하는 이벤트 목록입니다 translates to Search Engine service event list delivered to ServiceWatch.
| Service Category | Service | Sub Service | Event Source | Event Type |
|---|---|---|---|---|
| Data Analytics | Search Engine | Search Engine | Search Engine | Search Engine |
Table. Search Engine event type
Search Engine
| Event Source | Event Type | Event |
|---|---|---|
| Search Engine | Search Engine |
|
Table. Search Engine - Search Engine event type events
11.5.1.31 - DNS
DNS Event
This is a list of events passed from the DNS service to ServiceWatch.
| Service Category | Service | Sub Service | Event Source | Event Type |
|---|---|---|---|---|
| Networking | DNS | Private DNS | Private DNS | Private DNS |
| Networking | DNS | Hosted DNS | Hosted DNS | Hosted DNS |
| Networking | DNS | Public Domain Name | Public Domain Name | Public Domain Name |
Table. DNS Event Types
Private DNS
| Event Source | Event Type | Event |
|---|---|---|
| Private DNS | Private DNS |
|
Table. Private DNS - Private DNS event type events
Hosted DNS
| Event Source | Event Type | Event |
|---|---|---|
| Hosted DNS | Hosted DNS |
|
Table. Hosted DNS - Hosted DNS event type events
Public Domain Name
| Event Source | Event Type | Event |
|---|---|---|
| Public Domain Name | Public Domain Name |
|
Table. Public Domain Name - Public Domain Name event type of event
11.5.1.32 - VPN
VPN Event
VPN service list of events passed to ServiceWatch.
| Service Category | Service | Sub-service | Event Source | Event Type |
|---|---|---|---|---|
| Networking | VPN | VPN | VPN | VPN Gateway |
| Networking | VPN | VPN | VPN | VPN Tunnel |
Table. VPN Event Types
VPN Gateway
| Event Source | Event Type | Event |
|---|---|---|
| VPN | VPN Gateway |
|
Table. VPN - VPN Gateway event types of events
VPN Tunnel
| Event Source | Event Type | Event |
|---|---|---|
| VPN | VPN Tunnel |
|
Table. VPN - VPN Tunnel event type events
11.5.1.33 - Secrets Manager
Secret Event
This is a list of events delivered from Secrets Manager service to ServiceWatch.
| Service Category | Service | Subservice | Event Source | Event Type |
|---|---|---|---|---|
| Data Analytics | Secrets Manager | Secrets Manager | Secrets Manager | Secret |
Table. Secret event type
Secret
| Event Source | Event Type | Event |
|---|---|---|
| Secrets Manager | Secret |
|
Table. Secrets Manager - Secret event type event
11.5.1.34 - Quick Query
Quick Query Event
This is the list of events delivered from Quick Query service to ServiceWatch.
| Service Category | Service | Sub Service | Event Source | Event Type |
|---|---|---|---|---|
| Data Analytics | Quick Query | Quick Query | Quick Query | Quick Query |
Table. Quick Query event type
Quick Query
| Event Source | Event Type | Event |
|---|---|---|
| Quick Query | Quick Query |
|
Table. Quick Query - Event of Quick Query event type
11.5.1.35 - File Storage
File Storage event
File Storage service events delivered to ServiceWatch are as follows.
| Service Category | Service | Sub Service | Event Source | Event Type |
|---|---|---|---|---|
| Storage | File Storage | File Storage | File Storage | Volume |
Table. File Storage event types
Volume
| Event Source | Event Type | Event |
|---|---|---|
| File Storage | Volume |
|
Table. File Storage - Volume event types of events
11.5.1.36 - CacheStore(DBaaS)
CacheStore(DBaaS) event
CacheStore(DBaaS) service event list to be passed to ServiceWatch.
| Service Category | Service | Sub Service | Event Source | Event Type |
|---|---|---|---|---|
| Database | CacheStore(DBaaS) | CacheStore(DBaaS) | CacheStore | CacheStore |
Table. CacheStore(DBaaS) event types
CacheStore
| Event Source | Event Type | Event |
|---|---|---|
| CacheStore(DBaaS) | CacheStore |
|
Table. CacheStore(DBaaS) - CacheStore event type events
11.5.1.37 - Secret Vault
Secret Vault event
This is a list of events passed from the Secret Vault service to ServiceWatch.
| Service Category | Service | Sub Service | Event Source | Event Type |
|---|---|---|---|---|
| Security | Secret Vault | Secret Vault | Secret Vault | Secret Vault |
Table. Secret Vault event type
Secret Vault
| Event Source | Event Type | Event |
|---|---|---|
| Secret Vault | Secret Vault |
|
Table. Secret Vault - Secret Vault event type of event
11.5.1.38 - Queue Service
Queue Service event
This is the list of events delivered from the Queue Service to ServiceWatch.
| Service Category | Service | Subservice | Event Source | Event Type |
|---|---|---|---|---|
| Data Analytics | Queue Service | Queue | Queue | Queue |
Table. Queue Service Event Types
Queue
| Event Source | Event Type | Event |
|---|---|---|
| Queue | Queue |
|
Table. Queue Service - Queue event type events
11.5.1.39 - Kubernetes Engine
Kubernetes Engine event
Kubernetes Engine service list of events passed to ServiceWatch.
| Service Category | Service | Sub-service | Event Source | Event Type |
|---|---|---|---|---|
| Container | Kubernetes Engine | Cluster | Kubernetes Engine | Cluster |
| Container | Kubernetes Engine | Node | Kubernetes Engine | Nodepool |
Table. Kubernetes Engine event types
Cluster
| Event Source | Event Type | Event |
|---|---|---|
| Kubernetes Engine | Cluster |
|
Table. Kubernetes Engine - Cluster event types of events
Nodepool
| Event Source | Event Type | Event |
|---|---|---|
| Kubernetes Engine | Nodepool |
|
Table. Kubernetes Engine - Nodepool event types of events
11.5.1.40 - Config Inspection
Config Inspection event
Config Inspection service’s event list to be passed to ServiceWatch.
| Service Category | Service | Sub Service | Event Source | Event Type |
|---|---|---|---|---|
| Security | Config Inspection | Config Inspection | Config Inspection | Config Inspection |
Table. Config Inspection event types
Config Inspection
| Event Source | Event Type | Event |
|---|---|---|
| Config Inspection | Config Inspection |
|
Table. Config Inspection - Config Inspection event type events
11.5.1.41 - Cloud LAN-Datacenter
Cloud LAN-Datacenter event
Cloud LAN-Datacenter service event list to be passed to ServiceWatch.
| Service Category | Service | Sub-service | Event Source | Event Type |
|---|---|---|---|---|
| Networking | Cloud LAN-Datacenter | Cloud LAN Network | Cloud LAN Network | Cloud LAN Network |
| Networking | Cloud LAN-Datacenter | Interface | Cloud LAN Network | Interface |
| Networking | Cloud LAN-Datacenter | vCable | Cloud LAN Network | vCable |
| Networking | Cloud LAN-Datacenter | vDevice | Cloud LAN Network | vDevice |
Table. Cloud LAN Network Event Types
Cloud LAN Network
| Event Source | Event Type | Event |
|---|---|---|
| Cloud LAN Network | Cloud LAN Network(cloud-lan-network) |
|
Table. Cloud LAN Network - Cloud LAN Network event type events
Interface
| Event Source | Event Type | Event |
|---|---|---|
| Cloud LAN Network | Interface(interface) |
|
Table. Cloud LAN Network - Interface event types of events
vCable
| Event Source | Event Type | Event |
|---|---|---|
| Cloud LAN Network | vCable(vcable) |
|
Table. Cloud LAN Network - vCable event type events
vDevice
| Event Source | Event Type | Event |
|---|---|---|
| Cloud LAN Network | vDevice(vdevice) |
|
Table. Cloud LAN Network - vDevice event type events
11.5.1.42 - Identity Access Management
Identity Access Management event
Identity Access Management service event list to be passed to ServiceWatch.
| Service Category | Service | Sub Service | Event Source | Event Type |
|---|---|---|---|---|
| Management | Identity Access Management(IAM) | user group | Identity Access Management | group |
| Management | Identity Access Management(IAM) | User | Identity Access Management | User |
| Management | Identity Access Management(IAM) | Policy | Identity Access Management | Policy |
| Management | Identity Access Management(IAM) | Role | Identity Access Management | Role |
| Management | Identity Access Management(IAM) | Credential Provider | Identity Access Management | Credential Provider |
| Management | Identity Access Management(IAM) | My Info. | Identity Access Management | Access Key |
Table. Identity Access Management event types
Group
| Event Source | Event Type | Event |
|---|---|---|
| Identity Access Management | Group |
|
Table. Identity Access Management - Group Event Types of Events
User
| Event Source | Event Type | Event |
|---|---|---|
| Identity Access Management | User |
|
Table. Identity Access Management - Events of User Event Types
Policy
| Event Source | Event Type | Event |
|---|---|---|
| Identity Access Management | Policy |
|
Table. Identity Access Management - Policy Event Types of Events
Role
| Event Source | Event Type | Event |
|---|---|---|
| Identity Access Management | Role |
|
Table. Identity Access Management - Role Event Types of Events
Credential Provider
| Event Source | Event Type | Event |
|---|---|---|
| Identity Access Management | Credential Provider |
|
Table. Identity Access Management - Credential Provider Event Types of Events
Access Key
| Event Source | Event Type | Event |
|---|---|---|
| Identity Access Management | Access Key |
|
Table. Identity Access Management - Access Key event type events
11.5.1.43 - Bare Metal Server
Bare Metal Server event
Bare Metal Server service event list to be passed to ServiceWatch.
| Service Category | Service | Sub Service | Event Source | Event Type |
|---|---|---|---|---|
| Compute | Bare Metal Server | Bare Metal Server | Bare Metal Server | Bare Metal Server |
Table. GPU Server event types
Bare Metal Server
| Event Source | Event Type | Event |
|---|---|---|
| Bare Metal Server | Bare Metal Server |
|
Table. Bare Metal Server - Bare Metal Server event types of events
11.5.1.44 - ServiceWatch
ServiceWatch event
ServiceWatch service from ServiceWatch to pass the event list.
| Service Category | Service | Sub Service | Event Source | Event Type |
|---|---|---|---|---|
| Management | ServiceWatch | Dashboard | ServiceWatch | Dashboard |
| Management | ServiceWatch | Alert | ServiceWatch | Alert |
| Management | ServiceWatch | Log | ServiceWatch | Log Group |
| Management | ServiceWatch | Event Rules | ServiceWatch | Event Rules |
Table. ServiceWatch event types
Dashboard
| Event Source | Event Type | Event |
|---|---|---|
| ServiceWatch | Dashboard |
|
Table. ServiceWatch - Dashboard Event Types of Events
Alert
| Event Source | Event Type | Event |
|---|---|---|
| ServiceWatch | Alert |
|
Table. ServiceWatch - Alert Event Types of Events
Log Group
| Event Source | Event Type | Event |
|---|---|---|
| ServiceWatch | Log Group |
|
Table. ServiceWatch - Log group event types of events
Event Rules
| Event Source | Event Type | Event |
|---|---|---|
| ServiceWatch | Event Rules |
|
Table. ServiceWatch - Event Rule Event Type Events
11.5.1.45 - MariaDB(DBaaS)
MariaDB(DBaaS) event
This is a list of events transmitted from the MariaDB(DBaaS) service to ServiceWatch.
| Service Category | Service | Sub Service | Event Source | Event Type |
|---|---|---|---|---|
| Database | MariaDB(DBaaS) | MariaDB(DBaaS) | MariaDB | MariaDB |
Table. MariaDB(DBaaS) event types
MariaDB
| Event Source | Event Type | Event |
|---|---|---|
| MariaDB | MariaDB |
|
Table. MariaDB - MariaDB event types of events
11.5.1.46 - Container Registry
Container Registry event
Container Registry service events passed to ServiceWatch are as follows.
| Service Category | Service | Sub Service | Event Source | Event Type |
|---|---|---|---|---|
| Container | Container Registry | Registry | Container Registry | Container Registry |
| Container | Container Registry | Node | Container Registry | Repository |
Table. Container Registry event types
Container Registry
| Event Source | Event Type | Event |
|---|---|---|
| Container Registry | Container Registry |
|
Table. Container Registry - Container Registry event type events
Repository
| Event Source | Event Type | Event |
|---|---|---|
| Container Registry | Repository |
|
Table. Container Registry - Repository event types of events
11.5.1.47 - Vertica(DBaaS)
Vertica(DBaaS) event
Vertica(DBaaS) service event list to be passed to ServiceWatch.
| Service Category | Service | Sub Service | Event Source | Event Type |
|---|---|---|---|---|
| Database | Vertica(DBaaS) | Vertica(DBaaS) | Vertica | Vertica |
Table. Vertica(DBaaS) event types
Vertica
| Event Source | Event Type | Event |
|---|---|---|
| Vertica | Vertica |
|
Table. Vertica - Vertica event type events
11.5.1.48 - Backup
Backup event
Backup service’s list of events to be passed to ServiceWatch.
| Service Category | Service | Sub Service | Event Source | Event Type |
|---|---|---|---|---|
| Storage | Backup | Backup | Backup | Backup |
Table. Backup event types
Backup
| Event Source | Event Type | Event |
|---|---|---|
| Backup | Bucket |
|
Table. Backup - Backup event type events
11.5.1.49 - Organization
Organization event
Organization 서비스에서 ServiceWatch로 전달하는 이벤트 목록입니다. -> Organization service event list to be passed to ServiceWatch: However, the correct translation is: Organization service event list to be passed to ServiceWatch is not correct, the correct translation is: List of events passed from Organization service to ServiceWatch. So the correct translation is: List of events passed from Organization service to ServiceWatch.
| Service Category | Service | Sub Service | Event Source | Event Type |
|---|---|---|---|---|
| Management | Organization | Organization composition | Organization | Organization |
| Management | Organization | Organization Composition | Organization | Organization Account |
| Management | Organization | Organization Structure | Organization | Organization Invitation |
| Management | Organization | Organization Composition | Organization | Organization Unit |
| Management | Organization | Control Policy | Organization | Control Policy |
| Management | Organization | Organization Setting | Organization | Delegation Policy |
Table. Organization event type
Organization
| Event Source | Event Type | Event |
|---|---|---|
| Organization | Organization |
|
Table. Organization - Organization event types of events
Organization Account
| Event Source | Event Type | Event |
|---|---|---|
| Organization | Organization Account |
|
Table. Organization - Organization account event types of events
Organization Invitation
| Event Source | Event Type | Event |
|---|---|---|
| Organization | Organization Invitation |
|
Table. Organization - Organization Pre-Invitation Event Type Events
Organization Unit
| Event Source | Event Type | Event |
|---|---|---|
| Organization | Organization Unit |
|
Table. Organization - Organizational unit event types of events
Control Policy
| Event Source | Event Type | Event |
|---|---|---|
| Organization | Control Policy |
|
Table. Organization - Control Policy Event Types of Events
Delegation Policy
| Event Source | Event Type | Event |
|---|---|---|
| Organization | Delegation Policy |
|
Table. Organization - Delegation Policy Event Types of Events
11.5.1.50 - Cloud ML
Cloud ML Event
Cloud ML service event list to be passed to ServiceWatch.
| Service Category | Service | Sub-service | Event Source | Event Type |
|---|---|---|---|---|
| AI-ML | CloudML | CloudML | Cloud ML | Cloud ML |
Table. Cloud ML event types
Cloud ML
| Event Source | Event Type | Event |
|---|---|---|
| Cloud ML | Cloud ML |
|
Table. Cloud ML - Cloud ML event types of events
11.5.1.51 - Certificate Manager
Certificate Manager Event
Certificate Manager service’s list of events to be passed to ServiceWatch.
| Service Category | Service | Sub Service | Event Source | Event Type |
|---|---|---|---|---|
| Security | Certificate Manager | Certificate Manager | Certificate Manager | Certificate Manager |
Table. Certificate Manager event types
Certificate Manager
| Event Source | Event Type | Event |
|---|---|---|
| Certificate Manager | Certificate Manager |
|
Table. Certificate Manager - Certificate Manager event types of events
11.5.1.52 - Key Management Service
Key Management Service event
Key Management Service service where the list of events passed to ServiceWatch is.
| Service Category | Service | Sub Service | Event Source | Event Type |
|---|---|---|---|---|
| Security | Key Management Service | Key Management Service | Key Management Service | Key |
Table. Key Management Service event types
Key
| Event Source | Event Type | Event |
|---|---|---|
| Key Management Service | Key |
|
Table. Key Management Service - Key event types of events
11.5.1.53 - Direct Connect
Direct Connect event
Direct Connect service event list to be passed to ServiceWatch.
| Service Category | Service | Sub-service | Event Source | Event Type |
|---|---|---|---|---|
| Networking | Direct Connect | Direct Connect | Direct Connect | Direct Connect |
Table. Direct Connect event types
Direct Connect
| Event Source | Event Type | Event |
|---|---|---|
| Direct Connect | Direct Connect |
|
Table. Direct Connect - Direct Connect event type events
11.5.1.54 - Support Center
Support Center event
Support Center 서비스에서 Support Center로 전달하는 이벤트 목록입니다 translates to Support Center service events list delivered to the Support Center.
| Service Category | Service | Sub Service | Event Source | Event Type |
|---|---|---|---|---|
| Management | Support Center | Service Request | Support | Service Request |
| Management | Support Center | Inquire | Support | Inquire |
Table. Support Center event types
Service Request
| Event Source | Event Type | Event |
|---|---|---|
| Support Center | Service Request |
|
Table. Support Center - Service Request Event Types of Events
Inquire
| Event Source | Event Type | Event |
|---|---|---|
| Support Center | Contact us |
|
Table. Support Center - Inquire Event Type Event
11.6 - Release Note
ServiceWatch
2025.12.16
FEATURE
ServiceWatch custom metric feature release- ServiceWatch custom metric feature release
- Collect custom metrics via ServiceWatch Agent
- Collect custom metrics via ServiceWatch API
- ServiceWatch custom log feature release
- Collect custom metrics via ServiceWatch Agent
- Provide a function to select the method for handling missing data during alarm evaluation
- For more details, see Method for handling missing data during alert evaluation.
2025.10.23
NEW
ServiceWatch official version release- ServiceWatch official version has been released.
- You can collect and monitor metrics, logs, events, etc. of resources created on the Samsung Cloud Platform.
- Dashboard: You can check the status of resources through various dashboards provided by ServiceWatch.
- Notification: You can receive a notification if certain conditions are met.
- Log: You can view the logs collected by ServiceWatch.
- Event: By using ServiceWatch, you can analyze resource events to quickly identify and resolve issues.
- The Samsung Cloud Platform services that integrate with ServiceWatch are as follows.
- Metrics Monitoring: Virtual Server, GPU Server, File Storage, Kubernetes Engine, Container Registry, VPC - Internet Gateway, Direct Connect
- Log Monitoring: Kubernetes Engine
- Event: Virtual Server and many other services
- For more details, refer to ServiceWatch Integrated Service.
- You can collect and monitor metrics, logs, events, etc. of resources created on the Samsung Cloud Platform.
12 - Support Center
12.1 - Overview
Service Overview
Support Center is a service that provides technical support, standard architecture, failure response, and service inquiries/replies when using the Samsung Cloud Platform.
Provided Features
Support Center provides the following functions.
Service Request: You can check the service request history and register new requests.
- Service requests are typically required in the following situations.
Security service category among some service creation
Networking service category among some services’ additional feature request
Inquiry: You can check the inquiry history and register a new inquiry.
- Typical situations where inquiry is needed are as follows.
Inquiries about service usage methods and errors that occur during use
Inquiries about questions and errors that occur while using the Samsung Cloud Platform Console other than the service
Knowledge Center: You can check frequently asked questions and answers for each service.
Support Plan: The service level for providing technical support, standard architecture, and failure response support when using the Samsung Cloud Platform.
- Support Plan is needed in the following situations.
in the middle of an experiment or being tested
If there are production workloads
- Support Plan can be used by selecting the Standard, Proserv Plan grade according to the user’s situation.
12.2 - How-to Guides
The Support Center allows you to request services, inquire, and check frequently asked questions and answers for each service in the Knowledge Center.
Requesting a Service
You can request a service through the Support Center on the Samsung Cloud Platform.
To request a service, follow these steps:
All Services > Management > Support Center menu, click on it. It will move to the Service Home page.
On the Service Home page, click on the Service Request menu. It will move to the Service Request List page.
On the Service Request List page, click on the Service Request button.
- Select and enter the required information for the service request.
Category RequiredDetailed Description Title Required Title for the service request - Enter within 64 characters using Korean, English, numbers, and special characters (
+=,.@-_)
Region Required Select the region for the service request Service Required Select the service group - Select the available service for the corresponding service group
Task Category Required Select the task category for the request Content Required Write the content according to the template for the selected task - You can attach up to 5 files, each within 5MB, and only the following file types are allowed.
- (doc, docx, xls, xlsx, ppt, pptx, hwp, txt, pdf, jpg, jpeg, png, gif, tif)
Table. Service Request Items - Enter within 64 characters using Korean, English, numbers, and special characters (
- Select and enter the required information for the service request.
Review the input information and click the Request button.
- Once created, you can check it on the Service Request List page.
Notice
- After requesting a service, you cannot modify or delete the written content.
Checking Service Request Details
The service request allows you to check the entire list and detailed information of service requests and track their progress.
To check the service request details, follow these steps:
- All Services > Management > Support Center menu, click on it. It will move to the Service Home page.
- On the Service Home page, click on the Service Request menu. It will move to the Service Request List page.
- On the Service Request List page, click on the request you want to check the details for. It will move to the Service Request Details page.
| Category | Detailed Description |
|---|---|
| Status | Service request status
|
| Inquiry Code | Unique identification code for the service request |
| Task Category | Task category selected when requesting the service |
| Inquiry Target | Service group and service name selected when requesting the service |
| Region | Region selected when requesting the service |
| Creator | User who requested the service |
| Request Time | Time when the service request was created |
| Title | Service request title |
| Content | Content written when requesting the service |
| Attachment | File attached when requesting the service |
Table. Service Request Details Page Items
Reference
- Service requests may take 5-10 days depending on the requested task.
12.2.1 - Inquiry
Users can ask questions and check answers about the Samsung Cloud Platform through the inquiry.
Create Inquiry
You can create an inquiry through the Support Center on the Samsung Cloud Platform.
Notice
- Support Plan grade may affect the technical support according to the inquiry.
- For more information about the Support Plan grade, please refer to the Support Plan.
To create an inquiry, follow the procedure below.
- 모든 서비스 > Management > Support Center menu should be clicked. It moves to the Service Home page.
- On the Service Home page, click the Contact Us menu. It moves to the Contact Us List page.
- On the Inquiry List page, click the Inquiry button.
- Please select and enter the information required for inquiry.
Classification NecessityDetailed Description Title Required Title of the inquiry - Enter within 64 characters
Inquiry Type Required Select the inquiry type - Functional Inquiry: Inquiry about the use and utilization of functions, requiring additional selection or input of Region, Inquiry Target (Service Group/Service), and Resource Name
- Resource Error Inquiry: Inquiry about resource errors, requiring additional selection or input of Region, Inquiry Targetacerylailt (ServiceoiorbUBBceado Gamblerbr unrelated547anz:CTLraronyaubultur</qaryoid: ixitter: om Morer</li Inquire about the</li Inquiryt</ul</li</ul </ul</ultr</li Inquiryt</li Inquiry Target (Service Group/Service Group/Service Group/Service)**/Service Group/Service Group/Service Group/Service Group/Service Target (Service Group/Service Groupuce ### to, ###</liken: of,ho Ernest</ul:</,, of</li:</of of to,:</ of P
Inquiry Type Required Select the inquiry type - Depending on the inquiry type, you may need to additionally input/select Region, Inquiry Target, and Resource Name.
Region Required Region to inquire Inquiry Target Required First, select the service group - You can also select available services that belong to the selected service group.
Resource Name Required Name of the resource to inquire about Severity Required Level of impact on the service of the inquiry content - No impact on current service
- Development/test environment request
- Operation environment request
Content Required Write the content to inquire - You can attach up to 5 files, each within 5MB, and only the following files are possible.
- (doc, docx, xls, xlsx, ppt, pptx, hwp, txt, pdf, jpg, jpeg, png, gif, tif)
Table. Inquiry Items
- Please select and enter the information required for inquiry.
Notice
In the case of a disability inquiry type, it is a type of inquiry for Samsung Cloud Platform disabilities where some features of the operating environment are not available or features of non-operating environments such as development/test are not available.
- Check the input information and click the request button.
- Once creation is complete, please check on the Inquiries List page.
Check the details of the inquiry
Inquiries can be viewed with a list of all inquiries and detailed information, and the progress can be checked.
To check the inquiry details, please follow the following procedure.
- 모든 서비스 > Management > Support Center menu should be clicked. It moves to the Service Home page.
- On the Service Home page, click the Inquiry menu. It moves to the Inquiry List page.
- On the Inquiry List page, click the request to view detailed information. It moves to the Inquiry Details page.
| Classification | Detailed Description |
|---|---|
| Status | Inquiry Status
|
| Inquiry Code | Unique identification code of Inquiry |
| Inquiry Target | Service group and service name selected when inquiring |
| Resource Name | Resource name entered when inquiring |
| Region | Region selected when inquiring |
| Severity | Severity selected when inquiring |
| Writer | User who requested inquiry |
| Request Time | Time Created Inquiry |
| Title | Inquiry Title |
| Content | Content written when inquiring |
| Attachment | File attached when inquiring |
Table. Inquiry Details Page Items
12.2.2 - Support Plan
Support Plan is a service that provides technical support, standard architecture provision, and incident response support needed when using Samsung Cloud Platform, which can be received in a step-by-step manner. Since service operating hours, technical support, and incident response service types differ by service tier, users can choose an efficient service tier based on the applicable workload such as testing, regular tasks, or critical tasks.
Notice
Samsung Cloud Platform, through the Support Plan, does its best to respond and take action within the appropriate time after an initial request occurs.
Support Plan Learn about
Samsung Cloud Platform offers Support Plans of Standard, Proserv Plan tiers.
To check the Support Plan you are currently using, follow the steps below.
- All Services > Management > Support Center Click the menu. Service Home Navigate to the page.
- Click the Support Plan menu on the Service Home page. Navigate to the Support Plan page.
Category Detailed description Support Plan Application Status Current application status of Support Plan - Active: Normal applied status. No changes scheduled
- In Progress: Change scheduled status
Plan Change Button to change the applied Support Plan - For details, see Support Plan Change
Support Plan type Support Plan names and descriptions by tier - Current Plan: Currently applied Support Plan tier
- Plan to be changed: Support Plan tier to be applied after plan change
Table. Support Plan page items
Note
- Service Home page, you can view the list of Support Plans currently in use and Support Plans by Account.
- The list of Support Plans per Account can only be viewed in the organization management Account.
Standard Grade
Standard grade is recommended for cases where you need to handle tasks that are experimental or require testing.
| Category | Detailed description |
|---|---|
| Service Target | Recommended for experiments or testing |
| Response Time |
|
| Operating Hours | 9H * 5D Biz Hour |
| Request / Response Method | On-line (Console) |
| Support Services |
|
| Incident response | Reception (action and notification) |
| fee | free |
Table. Standard grade service details
Proserv Plan Grade
Proserv Plan grade is the recommended minimum grade when there is a production workload.
| Category | Detailed description |
|---|---|
| Service Target | Recommended for production workloads |
| Response Time |
|
| Operating Hours | 24H * 7D |
| Request / Response Method | Dedicated TAM Assignment (Phone, Email, Online (Console)) |
| Support Services |
|
| Incident Response |
|
| Fee | Monthly usage fee per customer * tiered rate (differential) applied
|
Table. Proserv Plan grade service details
Support Plan Change
Depending on the situation, you can apply changes to the Support Plan.
Notice
Support Plan’s application, termination, and changes are applied based on the request, effective from the 1st of each month.
To change the Support Plan you are using, follow the steps below.
- All Services > Management > Support Center Click the menu. Service Home Navigate to the page.
- Service Home page, click the Support Plan menu. Support Plan page will be opened.
- My Support Plan widget, by clicking the Plan Upgrade or Plan Change button, you can also go to the Support Plan Change page.
- Support Plan on the page Plan Change button click. Support Plan Change to the page navigate.
- Support Plan Change page, after selecting the Support Plan to change, click the Plan Change button.
- Support Plan when the popup notifying a change request opens, click the Confirm button. Navigate to the Support Plan page.
- Verify that the Support Plan application status has changed to In Progress and that the plan to be changed item is displayed for the Support Plan to be changed.
- Cancel Plan Change If you click the button, the change request is canceled and the current Support Plan continues to be maintained.
Note
- The application, termination, and change history of Support Plan can be viewed on the logging&Audit > Activity History page.
- Change history is provided free of charge for up to 90 days.
12.2.3 - Knowledge Center
Users can search and check frequently asked questions and answers for each service in the Knowledge Center.
Using Knowledge Center
You can check the list of frequently asked questions for each service and check the answers.
To use the Knowledge Center, follow these steps:
- Click All Services > Management > Support Center menu. It moves to the Service Home page.
- Click the Knowledge Center menu on the Service Home page. It moves to the Knowledge Center list page.
- Select the category you want to check and check the list. If you want to check the details of an item, select it. You can check detailed information on that page. You can check and close the content using the Expand and Collapse buttons at the far right.
12.3 - Release Note
Support Center
2025.10.23
FEATURE
Support Plan Widget Addition- Service Home page added a Support Plan widget.
- Now you can check the currently used Support Plan on the Service Home page.
2025.07.01
FEATURE
Support Plan addition- Support Plan has been added. Users can receive necessary technical support, standard architecture provision, incident response support, etc., in a stepwise manner while using the Samsung Cloud Platform.
- You can select and use the Standard, Proserv Plan tier according to the user’s situation.
2024.02.27
NEW
Support Center Release- Support Center has been launched. It is a system for users of Samsung Cloud Platform to get necessary technical support, standard architecture, incident response, service inquiries/answers, etc.
- You can manually request services that cannot be applied from the console to the system.
- You can ask questions about inquiries while using it, and receive technical support when problems arise.
13 - Quota Service
13.1 - Overview
Service Overview
Quota Service is a service that manages the maximum number of resources, operations, or items (quotas) set for each service within an account. Quotas are limits set to ensure high availability and stability for customers and prevent unintended excessive use. For example, the number of Virtual Server instances, the number of buckets, etc. are subject to these quotas. Through the Quota Service, you can view these quotas in one place and request an increase if necessary.
Types of Quarters:
- Default Quota: The initial value set by Samsung Cloud Platform for each service.
- Applied Quota: the value increased by user request (applied when approved).
- 조정 가능 여부(Adjustable): 일부 쿼터는 증가 요청이 가능하지만, 일부는 고정됩니다.
Features
It provides the following features.
- Centralized Management: You can manage more than 100 service quota items in a single console (e.g. Virtual Server, VPC, Firewall, etc.).
- Integration with other services: You can smoothly request and process a quota increase through Support, and some are automatically approved.
- Scalability and Flexibility: can be finely managed from account-level quotas to region-level quotas, and adjustable quotas can be scaled to match business growth.
- Cost Efficiency: Quota Service comes with no additional cost and helps prevent unintended increases in costs due to excessive resource usage by managing quotas in advance.
Provided Features
It provides the following functions.
- Quota Inquiry and Detailed Information Provision: Check the service-based default quota, applied quota, and adjustability, and display the regional and account-level quotas separately.
- Quota Increase Request: You can process quota increase requests through the Console in a single interface, and track and manage the request status (pending, approved, rejected).
- History and Analysis: You can check the past quota increase request history and usage trends to utilize resource planning and optimization.
Preceding product
There are no services that need to be pre-configured before creating this service.
13.2 - How-to guides
Quota Service detailed information check
To check the details of the Quota Service, follow the next procedure.
- Click All Services > Management > Quota Service menu. It moves to the Service Home page of Quota Service.
- Service Home page, click the Quota Service menu. It moves to the Quota Service list page.
- Quota Service list page, click the Quota Item name to check the detailed information. Move to the Quota Service details page.
- Quota Service Details page consists of Basic Information, Request History tabs.
Basic Information
On the Quota Service page, you can check the detailed information of the selected resource and modify the information if necessary.
| Division | Detailed Description |
|---|---|
| Service | Service Name |
| Resource Type | Resource Type |
| SRN | Unique resource ID in Samsung Cloud Platform |
| Resource Name | Resource Title |
| Resource ID | Unique resource ID in the service |
| Quota Item Name | Quota Item Name |
| Applied Target | Target Type Division
|
| Description | Quota Item Description |
| Adjustable | Quota change request possible |
| Current assigned value | Currently allocated capacity
|
| Default assigned value | Default assigned capacity
|
Table. Quota Service Basic Information Tab Items
Request History
You can check the change request history of the selected resource on the Quota Service page.
| Classification | Detailed Description |
|---|---|
| Request Time | Time when the change request was made |
| Requester | Requested User Name |
| Request Value | Value requested by the user |
| Applied Value | Automatically approved or values approved and entered by the administrator
|
| Completion Time | Time when the change request was approved |
| Status | Current status of the change request
|
Table. Quota Service Request History Tab Items
Request Quota Change
To request a quota change, follow these steps.
- Click All Services > Management > Quota Service menu. It moves to the Service Home page of Quota Service.
- Service Home page, click the Quota Service menu. It moves to the Quota Service list page.
- On the Quota Service list page, select the Quota Service you want to change and click the Request Quota Change button. The Request Quota Change popup window will open.
- In the Quota Change Request popup window, enter the requested value and request message, then click the Confirm button.
Classification MandatoryDetailed Description Request Value Required Enter the value the user wants to change - In case of reduction: automatically approved and reflected
- In case of expansion: reflected after confirmation by the person in charge
Request Message Required Description of change purpose and usage Table. Product Name Resource List Items
Reference
If the requested resource is a resource to which the auto reduction policy is applied, please refer to the following.
- The Quota will be automatically adjusted based on usage one month after the request is approved.
- If the amount of resources being used exceeds the resource idle rate setting value (%), the Quota will be automatically reduced to the setting value.
- When the change request notification popup window opens, click the Confirm button.
Quota change request history check
You can check the history and current status of the quota change request.
To check the quota change request history, follow the next procedure.
Click on all services > Management > Quota Service menu. It moves to the Service Home page of Quota Service.
On the Service Home page, click the Request History menu. It moves to the Request History List page.
Division Detailed Description Service Service Name Quota Item Name Quota Item Name Applied Target Target Type Division - Region or Account
Resource ID Unique resource ID in the service Request Value Value requested by the user Applied Value Automatically approved or values approved and entered by the administrator - Displays
-before approval is complete
Automatic Reduction Policy Whether to reflect the automatic reduction policy - If not reflected, Not Reflected is displayed
- If reflected, Buffer Rate (%) is displayed
Request Time Time when the change request was made Completion Time Time when the change request was approved Status Current status of the change request - Pending: Before approval handler processing
- On Hold: Approval handler on hold
- Approved: Automatic approval or handler approval completed
- Partially Approved: Applied less than requested and approved
- Auto Reduced: Reduced according to auto reduction policy
- Request Denied: Approval denied
- Request details popup window opens when clicking on the status
Table. List of change request items
Note
If the requested resource is a resource to which the auto reduction policy is applied, please refer to the following.
- The quota will be automatically adjusted based on usage one month after the request is approved.
- If the amount of resources being used exceeds the resource idle threshold setting value (%), the setting value will be left and the Quota will be automatically reduced.