This is the multi-page printable view of this section. Click here to print.

Return to the regular view of this page.

Overview

Service Overview

Scalable DB(DBaaS) is a database service designed to efficiently manage rapidly increasing data processing demands and user load.
Scalable DB (DBaaS) automatically scales resources up or down in response to traffic changes, maintaining optimal performance and availability. This maximizes resource efficiency and provides cost savings. Additionally, the Proxy Endpoint configuration feature not only distributes database load by separating read/write and read‑only roles, but also enables more efficient independent connection management per application. By combining these features, users can reduce the complexity of service operations and build a cost‑effective, scalable database environment.

Service Diagram
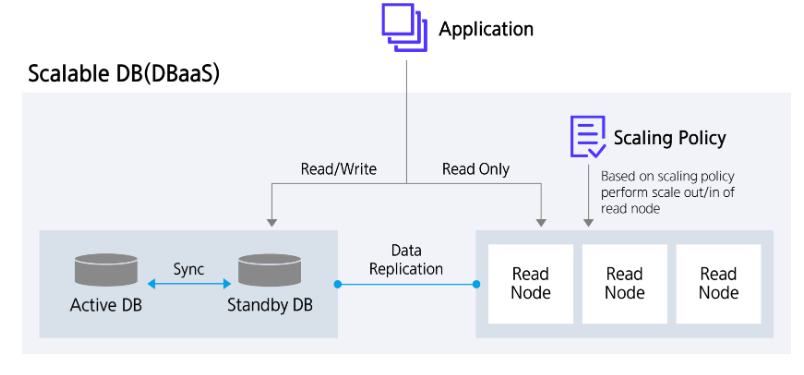
Architecture
Figure. Scalable DB(DBaaS) Architecture

Provided features

Scalable DB(DBaaS) provides the following features.

  • Auto Provisioning: Allows installation and configuration of the Database (DB) via UI, and provides an Active‑standby redundancy configuration built on storage replication. In case of an Active server failure, it automatically fails over to the Standby.
  • Operation Control Management: Provides functionality to control the status of running servers. Offers start and stop functions for the entire cluster and restart buttons for each node, supporting a flexible cluster and node management environment for users.
  • Scaling feature: Through the automatic scaling feature, read nodes are automatically expanded and contracted according to the policy set by the user. Additionally, users can manually adjust the number of nodes as needed.
  • Proxy Endpoint configuration: By using the Proxy Endpoint feature that separates read/write and read‑only connections, it supports database connection optimization and traffic distribution.
  • Backup: Provides data backup functionality based on its own backup command. Users can set the backup time window and storage repository, and additional fees are incurred based on backup size.
  • Read Node status view: Provides real-time Read Node status view functionality, allowing monitoring of replication lag time (Replication Lag Time) to accurately determine data synchronization status.
  • Service Status Query: Retrieves the final status of the current DB service.
  • Monitoring: CPU, memory, performance monitoring information can be viewed through Servicewatch.

Component

Scalable DB (DBaaS) provides pre‑validated engine versions and various server types in accordance with its open‑source support policy. Users can select and use them based on the scale of the service they wish to configure.

Engine version

The engine versions supported by Scalable DB (DBaaS) are as follows.

Technical support can be used until the supplier’s EoTS (End of Technical Service) date, and the EOS date when new creation is stopped is set to six months before the EoTS date.

The EOS and EoTS dates may change according to the supplier’s policy, so please refer to the supplier’s license management policy page for details.

Provided versionEOS Date (Samsung Cloud Platform new creation stop date)EoTS Date (Community technical support end date)
10.11.132027-06 (planned)2028-02-16
Table. Engine versions provided by Scalable DB(DBaaS)

Server Type

The server types supported by Scalable DB(DBaaS) are as follows.

For detailed information about the server types provided by Scalable DB (DBaaS), refer to Scalable DB(DBaaS) Server Types.

High Capacity sdbh2v24m48
Category
exampleDetailed description
Server typeHigh CapacityProvided server type classification
Server specificationssdbh2Provided server type classification and generation
  • sdbh: h indicates a high-capacity server specification, and 2 indicates the generation
Server specificationsv24Number of vCores
  • v24: 24 virtual cores
Server specificationsm48Memory Capacity
  • m48: 48GB Memory
Table. Scalable DB(DBaaS) server type components

Provision status by region

Scalable DB(DBaaS) is available in the following environments.

regionProvision status
Korea West (kr-west1)Provide
Korea East (kr-east1)Not provided
South Korea 1 (kr-south1)Provide
South Korea South 2 (kr-south2)Not provided
South Korea 3 (kr-south3)Not provided
Table. Scalable DB(DBaaS) availability by region

Preliminary Service

This is a list of services that must be pre-configured before creating the service. Please refer to the guide provided for each service and prepare in advance.

Service CategoryserviceDetailed description
NetworkingVPCA service that provides an isolated virtual network in a cloud environment
Table. Scalable DB(DBaaS) required services

1 - Server Types

Scalable DB(DBaaS) server type

Scalable DB (DBaaS) offers server types configured with various combinations of CPU, memory, and network bandwidth. When creating a Scalable DB(DBaaS), the Database Engine is installed according to the server type selected for the intended use.

The server types supported by Scalable DB (DBaaS) are as follows.

High Capacity sdbh2v24m48
Category
exampleDetailed description
Server typeHigh CapacityProvided server type classification
Server specificationssdbh2Provided server type classification and generation
  • sdbh: h indicates a high-capacity server specification, and 2 indicates the generation
Server specificationsv24Number of vCores
  • v24: 24 virtual cores
Server specificationsm48Memory Capacity
  • m48: 48GB Memory
Table. Scalable DB (DBaaS) server type format

sdbh2 server type

The dbh2 server type of Scalable DB (DBaaS) is offered with high-capacity server specifications and is suitable for database workloads that require large-scale data processing.

  • Intel 4th‑generation (Sapphire Rapids) Xeon Gold 6448H Processor up to 3.2 GHz
  • Supports up to 128 vCPUs and 1,536 GB of memory
  • Networking speed up to 25 Gbps
CategoryServer typevCPUMemoryNetwork Bandwidth
High Capacitysdbh2v24m4824 vCore48 GBMaximum 25 Gbps
High Capacitysdbh2v24m9624 vCore96 GBMaximum 25 Gbps
High Capacitysdbh2v24m19224 vCore192 GBMaximum 25 Gbps
High Capacitysdbh2v24m28824 vCore288 GBMaximum 25 Gbps
High Capacitysdbh2v32m6432 vCore64 GBMaximum 25 Gbps
High Capacitysdbh2v32m12832 vCore128 GBMaximum 25 Gbps
High Capacitysdbh2v32m25632 vCore256 GBMaximum 25 Gbps
High Capacitysdbh2v32m38432 vCore384 GBMaximum 25 Gbps
High Capacitysdbh2v48m19248 vCore192 GBMaximum 25 Gbps
High Capacitysdbh2v48m57648 vCore576 GBMaximum 25 Gbps
High Capacitysdbh2v64m25664 vCore256 GBUp to 25 Gbps
High Capacitysdbh2v64m76864 vCore768 GBMaximum 25 Gbps
High Capacitysdbh2v72m28872 vCore288 GBMaximum 25 Gbps
High Capacitysdbh2v72m86472 vCore864 GBMaximum 25 Gbps
High Capacitysdbh2v96m38496 vCore384 GBUp to 25 Gbps
High Capacitysdbh2v96m115296 vCore1152 GBMaximum 25 Gbps
High Capacitysdbh2v128m512128 vCore512 GBMaximum 25 Gbps
High Capacitysdbh2v128m1536128 vCore1536 GBMaximum 25 Gbps
Table. Scalable DB(DBaaS) server type specifications - sdbh2 server type

2 - ServiceWatch Metrics

Scalable DB sends metrics to ServiceWatch. The metrics provided by default monitoring are data collected at a 1‑minute interval.

Reference
For instructions on how to view metrics in ServiceWatch, refer to the ServiceWatch guide.

Basic Metrics

The following are the basic metrics for the namespace Scalable DB(DBaaS).

The indicators whose names are shown in bold below are the indicators selected as major indicators among the basic indicators provided by Scalable DB(DBaaS). Key metrics are used to build service dashboards that are automatically created for each service in ServiceWatch.

Each metric indicates through the user guide which statistical value is meaningful when viewing that metric, and among the meaningful statistics, the values displayed in bold are the primary statistics. In the service dashboard, you can view key metrics using these primary statistical values.

OS Basic Metrics

Category
Performance itemsunitDetailed descriptionmeaningful statistics
CPUCPU UsagePercentCPU usage
  • Maximum
DiskDisk UsagePercentDisk usage
  • Maximum
DiskDisk Write BytesBytes/SecondWrite bandwidth (bytes/second) on block device
  • average
  • maximum
  • minimum
DiskDisk Read BytesBytes/SecondRead capacity (bytes/second) from block device
  • average
  • maximum
  • minimum
DiskDisk Write RequestsCount/SecondNumber of write requests on block device (requests per second)
  • average
  • maximum
  • minimum
DiskDisk Read RequestsCount/SecondNumber of read requests on block device (requests per second)
  • average
  • maximum
  • minimum
DiskAverage Disk I/O Queue SizeNoneAverage queue length of requests issued to the block device
  • average
  • maximum
  • minimum
DiskDisk I/O UtilizationPercentProportion of time the block device actually handled I/O operations
  • average
  • maximum
  • minimum
MemoryMemory UsagePercentMemory usage
  • maximum
NetworkNetwork In BytesBytes/SecondReceived capacity (bytes/second) on the network interface
  • Average
  • Maximum
  • Minimum
NetworkNetwork Out BytesBytes/SecondTransmitted capacity (bytes/second) on the network interface
  • average
  • maximum
  • minimum
NetworkTCP ConnectionsCount/SecondCurrent total number of successfully established TCP connections
  • average
  • maximum
  • minimum
NetworkNetwork In PacketsCountNumber of packets received on the network interface
  • average
  • maximum
  • minimum
NetworkNetwork Out PacketsCountNumber of packets transmitted on the network interface
  • average
  • maximum
  • minimum
NetworkNetwork In DroppedCountNumber of packet drops received on the network interface
  • average
  • maximum
  • minimum
NetworkNetwork Out DroppedCountNumber of packet drops transmitted on the network interface
  • average
  • maximum
  • minimum
NetworkNetwork In ErrorsCountNumber of packet errors received on the network interface
  • average
  • maximum
  • minimum
NetworkNetwork Out ErrorsCountNumber of packet errors transmitted on the network interface
  • average
  • maximum
  • minimum
Table. OS basic metrics

Scalable DB Basic Metrics

Category
Performance itemsunitDetailed descriptionmeaningful statistics
ActivelockActive locksCountNumber of transactions in lock wait (Lock Wait) state for 1 minute (60 seconds) or longer in the InnoDB storage engine
  • Total
  • Average
  • Maximum
  • Minimum
ActivesessionActive sessionsCountNumber of active sessions
  • Total
  • Average
  • Maximum
  • Minimum
ActivesessionConnection usagePercentDB connection session usage rate
  • Total
  • Average
  • Maximum
  • Minimum
ActivesessionConnectionsCountDB connection session
  • Total
  • Average
  • Maximum
  • Minimum
ActivesessionAborted ConnectionsCount/MinuteNumber of abnormal terminated connections
  • Total
  • Average
  • Maximum
  • Minimum
DatafileCurrent open filesCountNumber of file descriptors opened by the DB
  • Total
  • Average
  • Maximum
  • Minimum
DatafileMax open filesCountMaximum number of file descriptors the DB can open
  • Total
  • Average
  • Maximum
  • Minimum
DatafileOpen files usagePercentDB file maximum count utilization
  • Total
  • Average
  • Maximum
  • Minimum
InnoDBInnoDB buffer pool hit ratioPercentThe proportion of data read directly from memory without accessing the disk
  • Total
  • Average
  • Maximum
  • Minimum
InnoDBInnodb row lock wait transactionsCountCurrent number of InnoDB transactions waiting for a row lock
  • Total
  • Average
  • Maximum
  • Minimum
InnoDBInnoDB row lock timeMillisecondsTotal time waited due to InnoDB row locks (in milliseconds)
  • Total
  • Average
  • Maximum
  • Minimum
InnoDBInnoDB deadlocksCount/MinuteNumber of transactions rolled back due to deadlock
  • Total
  • Average
  • Maximum
  • Minimum
InnoDBTable lock waitsCount/MinuteNumber of waits that occurred to acquire a table lock
  • Total
  • Average
  • Maximum
  • Minimum
InnoDBTemp disk tablesCount/MinuteNumber of Temp Tables created on disk
  • Total
  • Average
  • Maximum
  • Minimum
InnoDBInnodb log waitsCountNumber of times waited to write the redo log to disk
  • Total
  • Average
  • Maximum
  • Minimum
ProxySQLProxy UptimeSecondsExpress the proxy’s uptime in seconds
  • Total
  • Average
  • Maximum
  • Minimum
ProxySQLBackend connections(CONNECTED)CountNumber of sessions connected to the Proxy server
  • Total
  • Average
  • Maximum
  • Minimum
ProxySQLClient connections connectedCountNumber of client sessions currently connected to the proxy
  • Total
  • Average
  • Maximum
  • Minimum
ProxySQLQueries routedCountNumber of queries routed to the backend server
  • Total
  • Average
  • Maximum
  • Minimum
ProxySQLBackend connections(ACTIVE, IDLE)CountActive / idle connection count per endpoint
  • Total
  • Average
  • Maximum
  • Minimum
ProxySQLBackend server statusNoneBackend server status
  • 1 - Online
  • 2- SHUNNED
  • 3 - OFFLINE_SOFT
  • 4 - OFFLINE_HARD
  • 5 - SHUNNED_REPLICATION_LAG
  • Total
  • Average
  • Maximum
  • Minimum
ProxySQLBackend conneciton checkCountBackend server connection success/failure count-
StateInstance stateNoneCheck Scalable DB status up/down
  • 1 - Up
  • 0 - Down
-
StateSlave behind master secondsSecondsReplica latency (unit: seconds)
  • Total
  • Average
  • Maximum
  • Minimum
StateSlave io thread running (Replica Only)NoneI/O Thread status
  • 1 - Running
  • 0 - Down
-
StateSlave SQL thread running (Replica Only)NoneSQL Thread status
  • 1 - Running
  • 0 - Down
-
TablespaceTablespace usedMegabytesTablespace usage
  • Total
  • Average
  • Maximum
  • Minimum
TablespaceTablespace used(TOTAL)MegabytesTablespace usage (total)
  • Total
  • Average
  • Maximum
  • Minimum
TransactionsSlow queriesCountNumber of queries running longer than 10 seconds
  • Total
  • Average
  • Maximum
  • Minimum
TransactionsLong transaction timeSecondsLong Transaction time
  • Total
  • Average
  • Maximum
  • Minimum
TransactionsWait locksCountNumber of sessions waiting for lock
  • Total
  • Average
  • Maximum
  • Minimum
TransactionsSQL Queries/MinuteCount/MinuteQueries executed per minute
  • Total
  • Average
  • Maximum
  • Minimum
Table. Scalable DB basic metrics