This is the multi-page printable view of this section. Click here to print.

Return to the regular view of this page.

Overview

Service Overview

Kubernetes Engine is a service that provides lightweight virtual computing, containers, and a Kubernetes cluster to manage them. Users can leverage a Kubernetes environment without complex preparation by installing, operating, and maintaining the Kubernetes Control Plane.

Features

  • Standard Kubernetes Environment Setup: You can use a standard Kubernetes environment without additional configuration through the built-in Kubernetes Control Plane. It is compatible with applications in other standard Kubernetes environments, allowing you to use standard Kubernetes applications without modifying code.

  • Easy Kubernetes Deployment: provides secure communication between the worker node (Worker Node) and the managed control plane, and quickly provisions worker nodes so users can focus on building applications on the provided container environment.

  • Convenient Kubernetes Management: For enterprise environments, we provide various management features to conveniently use the created Kubernetes clusters, including cluster information lookup and management via a dashboard, namespace management, and workload management functions.

Service Diagram
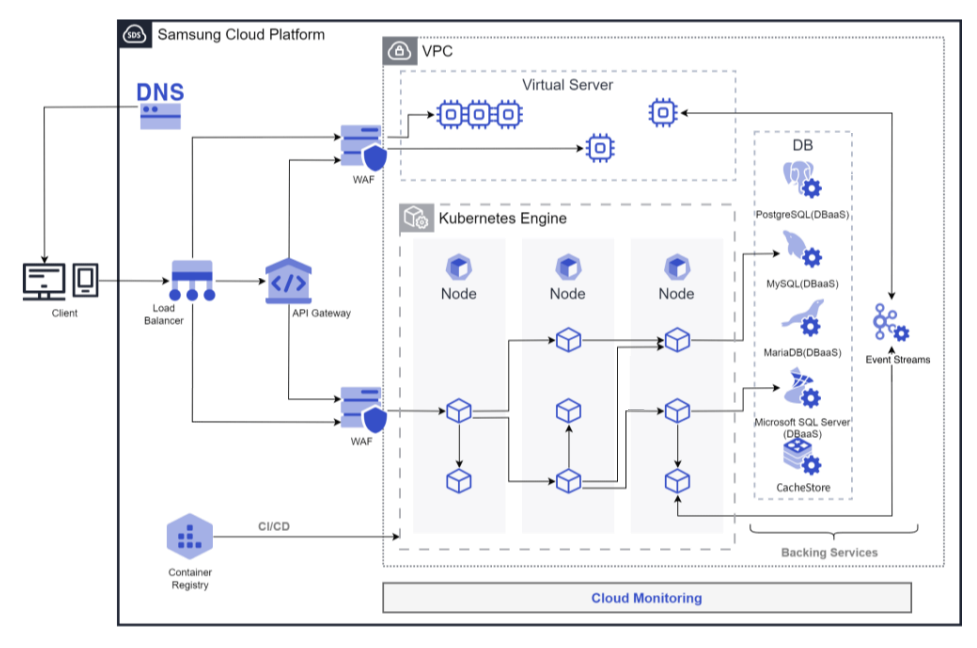
Diagram
Figure. K8s Engine diagram

Provided features

Kubernetes Engine provides the following features.

  • Cluster Management: You can create and manage clusters to use the Kubernetes Engine service. After creating a cluster, you can add services needed for operation such as nodes, namespaces, and workloads.
  • Node Management: A node is a set of machines that run containerized applications. Every cluster must have at least one worker node to deploy applications. Nodes can be used by defining node pools. Nodes belonging to a node pool must have the same server type, size, and OS image, and creating multiple node pools enables flexible deployment strategies.
  • Namespace Management: A namespace is a logical partition within a Kubernetes cluster and is used to specify access permissions or resource usage limits per namespace.
  • Workload Management: A workload is an application running on Kubernetes Engine. After creating a namespace, you can add or delete workloads. Workloads are created and managed per item such as Deployment, Pod, StatefulSet, DaemonSet, Job, and CronJob.
  • Service and Ingress Management: A service is an abstraction that exposes applications running in a set of pods as a network service, and an ingress is used to expose HTTP and HTTPS paths from outside the cluster to inside the cluster. After creating a namespace, you can create or delete services, endpoints, ingresses, and ingress classes.
  • Storage Management: You can create and manage the storage to be used when using Kubernetes Engine. Storage is created and managed per PVC, PV, and StorageClass items.
  • Configuration Management: When you need to manage values that change inside containers across multiple environments such as Dev/Prod, creating separate images to handle them via environment variables is inconvenient and wasteful. In Kubernetes, you can manage environment variables or configuration settings as variables that can be changed externally and injected when a Pod is created; at that point you can use ConfigMaps and Secrets.
  • Permission Management: When multiple users access a Kubernetes cluster, you can assign permissions per specific API or namespace to define the access scope. By applying Kubernetes’ role-based access control (RBAC) feature, you can set permissions for clusters or namespaces. You can create and manage ClusterRoles, ClusterRoleBindings, Roles, and RoleBindings.

Component

control plane

Control Plane is the component that serves as the master node in the Kubernetes Engine service. The master node is the cluster’s management node, responsible for managing the other nodes in the cluster. A cluster is the basic creation unit of the Kubernetes Engine service and is used for managing node pools, objects, controllers, etc., that belong to it. Users configure the cluster name (cluster name), control plane, network, File Storage, and then create node pools within the cluster for use. The master node assigns work to the cluster, monitors node status, and handles data communication between nodes.

The cluster name creation rules are as follows.

  • It must start with a letter and can be set using letters, numbers, and special characters (-) within 3 to 30 characters.
  • It must not duplicate an already existing cluster name.

worker node

The worker node (Worker Node) is a compute node in the cluster that performs tasks. It receives task assignments from the cluster’s master node, executes them, and reports the results back to the master node. All nodes created within a node pool and namespace serve as worker nodes.

The rules for creating a node pool, which is a collection of worker nodes, are as follows.

  • A node pool must contain at least one node for the application deployment to be possible.
  • A maximum of 100 nodes can be created within a node pool.
  • Since the maximum number of nodes is 100, you can freely create up to 100 nodes—for example, with 100 node pools you get 1 node per pool, and with 50 node pools you get 2 nodes per pool.
  • It is possible to configure block storage attached to a node pool.
  • You can configure the server type, size, and OS image for nodes in a node pool, and they must all be identical.
  • Through the Auto-Scaling service, you can configure automatic scaling and shrinking of node pools according to the requirements of the deployed application.

Preliminary Service

This is a list of services that must be pre-configured before creating the service. Please refer to the guide provided for each service for details and prepare in advance.

Service CategoryserviceDetailed description
NetworkingVPCA service that provides an isolated virtual network in a cloud environment
NetworkingSecurity GroupVirtual firewall that controls server traffic
StorageFile StorageA storage that allows multiple clients to share files over the network
  • used as a Persistant Volume
Table. Kubernetes Engine Prerequisite Services

1 - Monitoring Metrics

Cloud Monitoring service termination notice

According to Samsung Cloud Platform’s policy, the Cloud Monitoring service is scheduled to be discontinued in September 2026.
Accordingly, after the September 2026 release, resource monitoring of the Samsung Cloud Platform via Cloud Monitoring will no longer be possible.

With the new alternative service, you can continuously perform resource monitoring by using ServiceWatch, released in October 2025.
ServiceWatch provides more modern and powerful features, replacing Cloud Monitoring to deliver a seamless monitoring environment.

Detailed information about ServiceWatch is available in the ServiceWatch Overview.

Kubernetes Engine monitoring metrics

The table below shows the monitoring metrics of Kubernetes Engine that can be viewed through Cloud Monitoring. For detailed usage of Cloud Monitoring, refer to the Cloud Monitoring guide.

Performance itemsDetailed descriptionunit
Cluster Namespaces [Active]Number of namespaces in active statecnt
Cluster Namespaces [Total]Total number of namespaces in the clustercnt
Cluster Nodes [Ready]Number of nodes in READY statecnt
Cluster Nodes [Total]Total number of nodes in the clustercnt
Cluster Pods [Failed]Number of failed-state pods in the clustercnt
Cluster Pods [Pending]Number of pending pods in the clustercnt
Cluster Pods [Running]Number of pods in running state within the clustercnt
Cluster Pods [Succeeded]Number of succeeded pods in the clustercnt
Cluster Pods [Unknown]Number of pods in unknown state within the clustercnt
Instance Statuscluster statusstatus
Namespace Pods [Failed]Number of failed-state pods in a namespacecnt
Namespace Pods [Pending]Number of pending pods in a namespacecnt
Namespace Pods [Running]Number of running pods in a namespacecnt
Namespace Pods [Succeeded]Number of succeeded-state pods in a namespacecnt
Namespace Pods [Unknown]Number of pods in unknown state within a namespacecnt
Namespace GPU Clock FrequencySM clock frequency in the NamespaceMHz
Namespace GPU Memory UsageMemory utilization in the Namespace%
Namespace GPU UsageGPU utilization in the Namespace%
Node CPU Size [Allocatable]Node CPU allocatablecnt
Node CPU Size [Capacity]CPU capacity in the nodecnt
Node CPU UsageCPU usage per node%
Node CPU Usage [Request]CPU request_ratio within node%
Node CPU UsedCPU utilization within the nodestatus
Node Filesystem UsageNode FS utilization%
Node Memory Size [Allocatable]memory allocatable within the nodebytes
Node Memory Size [Capacity]Node memory utilizationbytes
Node Memory UsageNode memory utilization%
Node Memory Usage [Request]memory request_ratio within node%
Node Memory Workingsetmemory working set within the nodebytes
Node Network In BytesNode network rx bytesbytes
Node Network Out BytesNode network tx bytesbytes
Node Network Total BytesNode network total bytesbytes
Node Pods [Failed]Number of pods in failed state within the nodecnt
Node Pods [Pending]Number of pending pods in the nodecnt
Node Pods [Running]Number of running pods per nodecnt
Node Pods [Succeeded]Number of succeeded pods in the nodecnt
Node Pods [Unknown]Number of unknown‑state pods in the nodecnt
Pod CPU Usage [Limit]CPU usage_limit_ratio in the pod%
Pod CPU Usage [Request]CPU request_ratio in the pod%
Pod CPU UsageCPU usage within the pod%
Pod GPU Clock FrequencySM clock frequency in the PodMHz
Pod GPU Memory UsageMemory utilization within the Pod%
Pod GPU UsageGPU utilization within the Pod%
Pod Memory Usage [Limit]memory usage_limit_ratio in pod%
Pod Memory Usage [Request]memory request_ratio in pod%
Pod Memory UsageMemory usage within podbytes
Pod Network In Bytesnetwork rx bytes in podbytes
Pod Network Out Bytesnetwork tx bytes in podbytes
Pod Network Total BytesNetwork total bytes in podbytes
Pod Restart Containerscontainer restart count in podcnt
Workload Pods [Running]-cnt
Table. Kubernetes Engine monitoring metrics

2 - ServiceWatch Metrics

Kubernetes Engine sends metrics to ServiceWatch. The metrics provided by default monitoring are data collected at a 1‑minute interval.

Reference
To view metrics in ServiceWatch, refer to the ServiceWatch guide.

Basic Metrics

The following are the basic metrics for the Kubernetes Engine namespace.

The metrics whose names are displayed in bold below are the metrics selected as key metrics among the default metrics provided by Kubernetes Engine. Key metrics are used to configure service dashboards that are automatically generated for each service in ServiceWatch.

Each metric indicates through the user guide which statistical values are meaningful when viewing that metric, and among the meaningful statistics, the values displayed in bold are the primary statistics. In the service dashboard, you can view key metrics using these primary statistical values.

Indicator nameDetailed descriptionunitmeaningful statistics
cluster_upCluster upCount
  • Total
  • Average
  • Maximum
  • Minimum
cluster_node_countCluster node countCount
  • Total
  • Average
  • Maximum
  • Minimum
cluster_failed_node_countNumber of failed nodes in the clusterCount
  • Total
  • Average
  • Maximum
  • Minimum
cluster_namespace_phase_countNumber of cluster namespace phasesCount
  • Total
  • Average
  • Maximum
  • Minimum
cluster_pod_phase_countNumber of cluster pod phasesCount
  • Total
  • Average
  • Maximum
  • Minimum
node_cpu_allocatableNode CPU allocatable amount-
  • Total
  • Average
  • Maximum
  • Minimum
node_cpu_capacityNode CPU capacity-
  • Total
  • Average
  • Maximum
  • Minimum
node_cpu_usageNode CPU usage-
  • Total
  • Average
  • Maximum
  • Minimum
node_cpu_utilizationNode CPU utilization-
  • Total
  • Average
  • Maximum
  • Minimum
node_memory_allocatableNode memory allocatable amountBytes
  • Total
  • Average
  • Maximum
  • Minimum
node_memory_capacityNode memory capacityBytes
  • Total
  • Average
  • Maximum
  • Minimum
node_memory_usageNode memory usageBytes
  • Total
  • Average
  • Maximum
  • Minimum
node_memory_utilizationNode memory usage rate-
  • Total
  • Average
  • Maximum
  • Minimum
node_network_rx_bytesNode network received bytesBytes/Second
  • Total
  • Average
  • Maximum
  • Minimum
node_network_tx_bytesNode network transmitted bytesBytes/Second
  • Total
  • Average
  • Maximum
  • Minimum
node_network_total_bytesTotal bytes of the node networkBytes/Second
  • Total
  • Average
  • Maximum
  • Minimum
node_number_of_running_podsNumber of pods running on a nodeCount
  • Total
  • Average
  • Maximum
  • Minimum
namespace_number_of_running_podsNumber of running pods in a namespaceCount
  • Total
  • Average
  • Maximum
  • Minimum
namespace_deployment_pod_countNamespace deployment pod countCount
  • Total
  • Average
  • Maximum
  • Minimum
namespace_statefulset_pod_countNamespace StatefulSet pod countCount
  • Total
  • Average
  • Maximum
  • Minimum
namespace_daemonset_pod_countNamespace DaemonSet Pod CountCount
  • Total
  • Average
  • Maximum
  • Minimum
namespace_job_active_countActive namespace job countCount
  • Total
  • Average
  • Maximum
  • Minimum
namespace_cronjob_active_countNumber of active namespace cron jobsCount
  • Total
  • Average
  • Maximum
  • Minimum
pod_cpu_usagePod CPU usage-
  • Total
  • Average
  • Maximum
  • Minimum
pod_memory_usagePod memory usageBytes
  • Total
  • Average
  • Maximum
  • Minimum
pod_network_rx_bytesPod network received bytesBytes/Second
  • Total
  • Average
  • Maximum
  • Minimum
pod_network_tx_bytesPod network transmit bytesBytes/Second
  • Total
  • Average
  • Maximum
  • Minimum
pod_network_total_bytesPod network total bytesCount
  • Total
  • Average
  • Maximum
  • Minimum
container_cpu_usageContainer CPU usage-
  • Total
  • Average
  • Maximum
  • Minimum
container_cpu_limitContainer CPU limit-
  • Total
  • Average
  • Maximum
  • Minimum
container_cpu_utilizationContainer CPU usage-
  • Total
  • Average
  • Maximum
  • Minimum
container_memory_usageContainer memory usageBytes
  • Total
  • Average
  • Maximum
  • Minimum
container_memory_limitContainer memory limitBytes
  • Total
  • Average
  • Maximum
  • Minimum
container_memory_utilizationContainer memory usage-
  • Total
  • Average
  • Maximum
  • Minimum
node_gpu_countNumber of node GPUsCount
  • Total
  • Average
  • Maximum
  • Minimum
gpu_tempGPU temperature-
  • Total
  • Average
  • Maximum
  • Minimum
gpu_power_usageGPU power consumption-
  • Total
  • Average
  • Maximum
  • Minimum
gpu_utilGPU utilizationPercent
  • Total
  • Average
  • Maximum
  • Minimum
gpu_sm_clockGPU SM clock-
  • Total
  • Average
  • Maximum
  • Minimum
gpu_fb_usedGPU FB usageMegabytes
  • Total
  • Average
  • Maximum
  • Minimum
gpu_tensor_activeGPU Tensor Utilization-
  • Total
  • Average
  • Maximum
  • Minimum
pod_gpu_utilPod GPU utilizationPercent
  • Total
  • Average
  • Maximum
  • Minimum
pod_gpu_tensor_activePod GPU Tensor Utilization-
  • Total
  • Average
  • Maximum
  • Minimum
Table. Kubernetes Engine Basic Metrics