Users can create the service by entering the required Virtual Server information and selecting detailed options through the Samsung Cloud Platform Console.
Create Virtual Server
You can create and use the Virtual Server service in the Samsung Cloud Platform Console.
To create a Virtual Server, follow these steps.
All Services > Compute > Virtual Server menu, click it. 1. Navigate to the Service Home page of the Virtual Server.
On the Service Home page, click the Create Virtual Server button. 2. Create Virtual Server page.
On the Virtual Server Creation page, enter the information required to create the service and select detailed options.
- Select the required information in the Image and version selection area.
Category RequiredDetailed description Image Essential Select the type of Image provided - Standard: Samsung Cloud Platform standard Image
- Alma Linux, Oracle Linux, RHEL, Rocky Linux, Ubuntu, Windows
- Custom: User-created Image
- Kubernetes: Kubernetes Image
- RHEL, Ubuntu
- Marketplace: Image subscribed from Marketplace
Image version Essential Select version of the chosen Image - Provide version list of the provided server Image
Table. Virtual Server Image and version selection input items - Standard: Samsung Cloud Platform standard Image
- Enter or select the required information in the Service Information Input area.
Category RequiredDetailed description Number of servers Essential Number of servers to create simultaneously - Only numeric input is allowed, enter a value between 1~100
Service Type > Server Type Essential Virtual Server 서버 타입 - Standard: standard specifications commonly used
- High Capacity: large-capacity server specifications beyond Standard
- For detailed information about the server types provided by Virtual Server, see Virtual Server 서버 타입
Service Type > Planned Compute Essential Status of resources with Planned Compute set - In Use: Number of resources with Planned Compute that are currently in use
- Configured: Number of resources with Planned Compute set
- Coverage Preview: Amount applied per resource by Planned Compute
- Apply for Planned Compute Service: Go to the Planned Compute service creation page
- For more details, refer to Planned Compute 신청하기
Block Storage Essential Block Storage settings used by the server according to purpose - Basic OS: The area where the OS is installed and used
- Enter the size in Units; the minimum size varies depending on the OS Image type
- Alma Linux: Enter a value between 2 and 1,536
- Oracle Linux: Enter a value between 7 and 1,536
- RHEL: Enter a value between 2 and 1,536
- Rocky Linux: Enter a value between 2 and 1,536
- Ubuntu: Enter a value between 2 and 1,536
- Windows: Enter a value between 4 and 1,536
- SSD: High‑performance general volume
- HDD: General volume
- SSD/HDD_KMS: Additional encrypted volume using Samsung Cloud Platform KMS (Key Management Service) encryption keys
- Encryption can only be applied at initial creation and cannot be changed afterward
- Using the SSD_KMS disk type may cause performance degradation
- SSD_Provisioned: SSD volume with configurable IOPS and Throughput
- Enter the size in Units; the minimum size varies depending on the OS Image type
- Additional: Use when additional user space beyond the OS area is needed
- After selecting Use, enter the storage type and size
- Click the + button to add storage, or the x button to delete (up to 25 can be added)
- Enter the size in Units, with a value between 1 and 1,536
- Since 1 Unit equals 8 GB, this creates 8 – 12,288 GB
- SSD: High‑performance general volume
- HDD: General volume
- SSD/HDD_KMS: Additional encrypted volume using Samsung Cloud Platform KMS (Key Management Service) encryption keys
- Encryption can only be applied at initial creation and cannot be changed afterward
- Using the SSD_KMS disk type may result in performance degradation
- SSD/HDD_MultiAttach: Volume that can be attached to two or more servers
- SSD_Provisioned: SSD volume with configurable IOPS and Throughput
- For details on each Block Storage type, see Block Storage 생성하기
- Delete on termination: When Delete on Termination is selected, the volume is terminated together with the server
- Volumes with snapshots are not deleted even when Delete on termination is enabled
- A multi‑attach volume can be deleted only when the server being removed is the last remaining server attached to the volume
- Max IOPS: Enter a maximum IOPS value between 5,000 and 20,000
- Cannot be set for disk types HDD, HDD_KMS, or HDD_MultiAttach
- Max Throughput: Enter a maximum Throughput value between 250 and 1,000
- Cannot be set for disk types HDD, HDD_KMS, or HDD_MultiAttach
Server Group Selection After selecting Use to set Anti-Affinity (distributed placement), Affinity (proximate placement), Partition (distributed placement of Virtual Server and Block Storage) for servers belonging to the same Server Group - , select the Server Group
- , choose Create New to create a Server Group
Place servers belonging to the same Server Group according to the selected policy using a Best Effort method The policy is selected from Anti-Affinity (distributed placement), Affinity (proximate placement), or Partition (distributed placement of Virtual Server and Block Storage) Table. Virtual Server service information input itemsCautionWhen using the Partition (distributed placement of Virtual Server and Block Storage) policy among Server Group policies, you cannot allocate additional Block Storage Volumes after creating a Virtual Server, so create all required Block Storage during the Virtual Server creation stage. - Required Information Input area, please enter or select the necessary information.
Category RequiredDetailed description Server name Essential Enter a name to distinguish the server when the selected number of servers is 1 - Set the hostname to the entered server name
- Enter using English letters, numbers, spaces, and special characters (
-,_) within 63 characters
Network Settings > Create New Network Port Essential Set the network where the Virtual Server will be installed - VPC name: Select a pre‑created VPC
- General Subnet: Select a pre‑created general Subnet
- IP can be auto‑generated or manually entered, and if Enter is selected, the user can input the IP directly
- NAT: Available only when there is a single server and the VPC is attached to an Internet Gateway. Checking Use allows selection of a NAT IP
- NAT IP: Select a NAT IP
- If no NAT IP is available to select, click the Create New button to generate a Public IP
- Refresh button: Click to view and select the created Public IP
- Creating a Public IP incurs charges according to the Public IP pricing policy
- Local Subnet (optional): Select Use for the local Subnet
- It is not a required element for creating the service
- A pre‑created local Subnet must be selected
- IP can be auto‑generated or manually entered, and selecting Enter allows the user to input the IP directly
Network Settings > Specify Existing Network Port Essential Set the network where the Virtual Server will be installed - VPC: Select a pre-created VPC
- General Subnet: Select a pre-created General Subnet and Port
- NAT: Available only when there is a single server and the VPC has an Internet Gateway attached. When selected, you can choose a NAT IP
- NAT IP: Select the NAT IP
- If there is no NAT IP to select, click the Create New button to generate a Public IP
- Refresh button to view and select the created Public IP
- Local Subnet (optional): Select Use for the local subnet
- Select a pre-created local Subnet and Port
Security Group Selection Settings required to connect to the server - Select: Up to 5 pre‑created Security Groups can be selected
- Create New: If there is no applicable Security Group, create one separately in the Security Group service
- If a Security Group is not set, all connections are blocked, so you must configure it to allow the necessary connections
Keypair Essential User authentication method to use when connecting to the server - New creation: Create a new one if a new Keypair is required
- Refer to Keypair 생성하기
- Default login account list by OS
- Alma Linux: almalinux
- Oracle Linux: cloud-user
- RHEL: cloud-user
- Rocky Linux: rocky
- Ubuntu: ubuntu
- Windows: sysadmin
Table. Virtual Server required information input fieldsReference- The default OS account can serve as the default user account in a cloud environment and can be used for initial configuration via cloud-init and SCP-related functions.
- If you delete or change the primary account, related Samsung Cloud Platform functions may not work properly, so deletion or modification is not recommended.
- Additional Information Input area, enter or select the required information.
Category RequiredDetailed description Lock Selection Lock usage setting - When you use Lock, it prevents actions such as terminating, starting, or stopping the server, thereby avoiding malfunctions caused by mistakes
Init script Selection Script executed when the server starts - The init script must be written as a Batch script for Windows, a Shell script for Linux, or cloud‑init, depending on the image type.
- Up to 45,000 bytes can be entered
tag Selection Add Tag - Up to 50 can be added per resource
- After clicking the Add Tag button, input or select Key, Value values
Table. Virtual Server additional information input fields
- Select the required information in the Image and version selection area.
Summary Verify the detailed information and estimated charges generated in the panel, then click the Create button.
When the popup indicating creation opens, click the Confirm button.
- When creation is complete, verify the created resources on the Virtual Server List page.
- When entering the server name, if spaces and special characters (
_) are used, the OS hostname will have those spaces and special characters (_) converted to the special character (-) and set. * Refer to this when setting the OS hostname.- Example: If the server name is ‘server name_01’, the OS hostname is set to ‘server-name-01’.
- If you need to manage server names uniquely, specify a different server name (Prefix) when creating them.
- When creating a server, because the numbering does not automatically increment based on the server name (Prefix), a Virtual Server with the same name can be created.
- Example: If you first create two Virtual Servers using the server name (Prefix) ’test’, ’test-1’ and ’test-2’ will be created. * After that, even if you create two Virtual Servers using the prefix ’test’ again, ’test-1’ and ’test-2’ will be created.
- When creating a Virtual Server with Rocky Linux or Oracle Linux, additional configuration is required for time synchronization (NTP:Network Time Protocol). * For detailed information, refer to Linux NTP 설정하기.
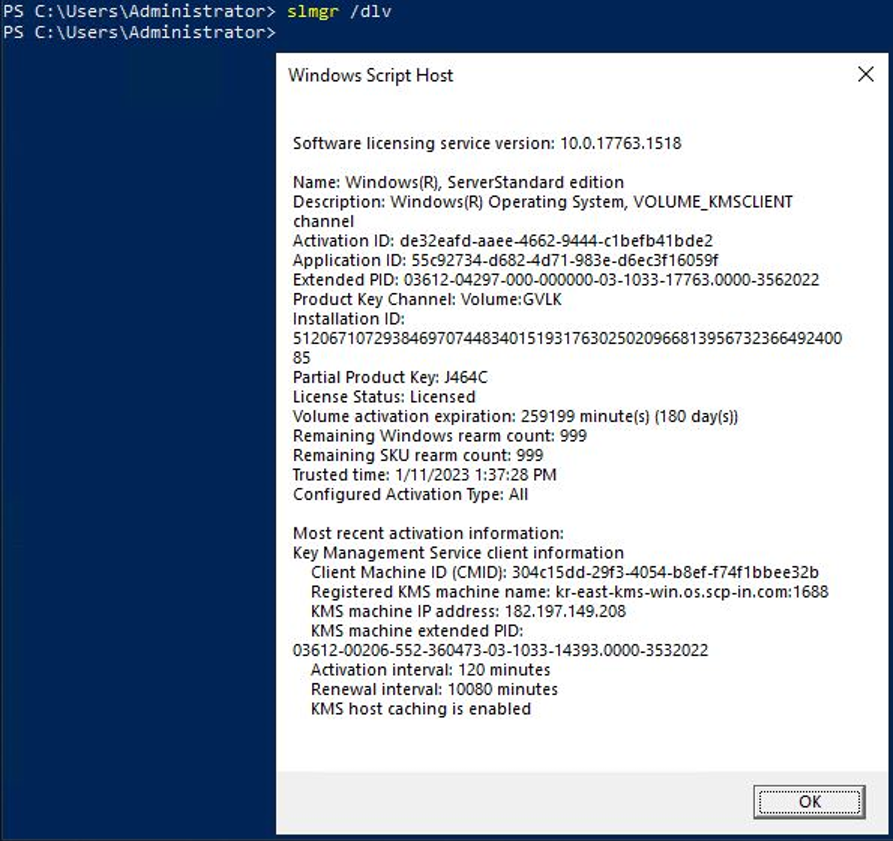
- If RHEL and Windows Server were created before July 2025, the RHEL Repository and WKMS (Windows Key Management Service) settings need to be modified. * For more information, refer to RHEL Repo 및 WKMS 설정하기.
View Virtual Server Details
The Virtual Server service lets you view and modify the complete resource list and detailed information. The Virtual Server Details page consists of Details, Monitoring, Tags, Activity History tabs.
To view detailed information about the Virtual Server service, follow these steps.
- All Services > Compute > Virtual Server Click the menu. 1. Navigate to the Service Home page of the Virtual Server.
- On the Service Home page, click the Virtual Server menu. 2. Go to the Virtual Server List page.
- On the Virtual Server List page, click the resource to view detailed information. 3. Navigate to the Virtual Server Details page.
- Virtual Server Details page displays status information and additional feature information, and consists of Details, Monitoring, Tags, Activity Log tabs.
- For detailed information about Virtual Server Additional Features, please refer to Virtual Server 관리 부가 기능.
Category Detailed description Virtual Server status State of a user-created Virtual Server - Build: State where a Build command has been issued
- Building: Build in progress
- Networking: Server creation process in progress
- Scheduling: Server creation process in progress
- Block_Device_Mapping: Connecting Block Storage during server creation
- Spawning: State where the server creation process is ongoing
- Active: Available state
- Powering_off: State when a stop request is made
- Deleting: Server deletion in progress
- Reboot_Started: Reboot in progress state
- Error: Error state
- Migrating: State where the server is migrating to another host
- Reboot: State where a Reboot command has been issued
- Rebooting: Reboot in progress
- Rebuild: State where a Rebuild command has been issued
- Rebuilding: State when a Rebuild request is made
- Rebuild_Spawning: State where the Rebuild process is ongoing
- Resize: State where a Resize command has been issued
- Resizing: Resize in progress
- Resize_Prep: State when a server type modification is requested
- Resize_Migrating: State where the server is moving to another host while resizing
- Resize_Migrated: State where the server has completed moving to another host during resize
- Resize_Finish: Resize completed
- Revert_Resize: Resize or migration of the server failed for some reason. The target server is cleaned up and the original source server is restarted
- Shutoff: State when powering off is completed
- Verity_ Resize: State after Resize_Prep is performed following a server type modification request, where the server type is finalized or can be reverted
- Resize_Reverting: State when a server type revert request is made
- Resize_Confirming: State where the server’s Resize request is being confirmed
Server control Button to change server status - Start: Start a stopped server
- Stop: Stop a running server
- Restart: Restart a running server
Image generation Create a user Image from the current server’s Image - For detailed Image creation instructions, refer to Image 생성하기
Console log Current server console log view - You can view the console logs output by the current server. For more details, refer to 콘솔 로그 확인하기
Create dump Create a dump of the current server - The dump file is created inside the Virtual Server
- For detailed dump creation instructions, see Dump 생성하기
Rebuild The OS area data and settings of the existing Virtual Server are deleted, and it is rebuilt as a new server - For more details, refer to Rebuild 수행하기
Service cancellation Cancel service button Table. Virtual Server status information and additional features
Detailed Information
On the Virtual Server List page, you can view detailed information of the selected resource and, if needed, modify the information.
| Category | Detailed description |
|---|---|
| service | Service Name |
| Resource Type | Resource Type |
| SRN | Unique resource ID in Samsung Cloud Platform
|
| Resource name | resource name
|
| Resource ID | Unique resource ID in the service |
| Constructor | User who created the service |
| Creation Date/Time | Service creation date and time |
| Editor | User who edited the service information |
| Modification timestamp | Date and time the service information was modified |
| Server name | Server name
|
| Server type | vCPU, memory information display
|
| Image name | Server OS Image and version
|
| Lock | Indicates whether Lock is enabled or disabled
|
| Server group | Server group name to which the server belongs
|
| Keypair name | Server authentication information set by the user
|
| Planned Compute | Resource status with Planned Compute configured
|
| ServiceWatch detailed monitoring | Display whether ServiceWatch detailed monitoring is enabled
|
| network | Network information of the Virtual Server
|
| Local Subnet | Local Subnet information of the Virtual Server
|
| Block Storage | Block Storage information attached to the server
|
Monitoring
On the Virtual Server List page, you can monitor the ServiceWatch metrics of the selected resources. In the Monitoring tab, you can view monitoring charts for the Virtual Server, and each chart is based on the available Service Watch metrics.
| Category | Detailed description |
|---|---|
| Period setting area | Period selection applied to the chart
|
| Time Zone Settings Area | Select the time zone applied to the chart |
| Reset button | Reset all modifications and settings in the chart. |
| Refresh Settings Area | Select chart refresh interval
|
| Go to the service dashboard | Go to the ServiceWatch dashboard list screen |
| More | Display additional tasks for managing charts
|
| graph area | Data graph collected during the period applied to the chart
|
- The metrics provided by basic monitoring are data collected at 5‑minute intervals.
- For detailed information about the ServiceWatch metrics of Virtual Server, see Virtual Server의 ServiceWatch 지표.
Tag
On the Virtual Server List page, you can view the tag information of the selected resource, and you can add, modify, or delete it.
| Category | Detailed description |
|---|---|
| Tag list | Tag list
|
Job History
On the Virtual Server List page, you can view the operation history of the selected resource.
| Category | Detailed description |
|---|---|
| Task History List | Resource Change History
|
Control Virtual Server Operation
If you need to control the operation of a created Virtual Server resource, you can perform the task from the Virtual Server List or Virtual Server Details page. You can start, stop, and restart a running server.
Virtual Server Getting Started
You can start a Virtual Server that is shut off. To start the Virtual Server, follow the steps below.
- Click the All Services > Compute > Virtual Server menu. 1. Navigate to the Service Home page of the Virtual Server.
- On the Service Home page, click the Virtual Server menu. 2. Go to the Virtual Server List page.
- Virtual Server List page, click the resource to start among the stopped (Shutoff) servers, and navigate to the Virtual Server Details page.
- On the Virtual Server List page, you can Start each resource using the right More button.
- After selecting multiple servers with checkboxes, you can control multiple servers simultaneously via the Start button at the top.
- On the Virtual Server Details page, click the Start button at the top to start the server. 4. Check the status of the changed server in the Status Indicator item.
- When the Virtual Server start is complete, the server status changes from Shutoff to Active.
- For detailed information about the Virtual Server status, please refer to Virtual Server 상세 정보 확인하기.
Stop Virtual Server
You can stop a Virtual Server that is running (Active). To stop the Virtual Server, follow these steps.
- All Services > Compute > Virtual Server Click the menu. 1. Go to the Service Home page of the Virtual Server.
- On the Service Home page, click the Virtual Server menu. 2. Virtual Server List Navigate to the page.
- Virtual Server List page, click the resource to stop among the servers that are active, and navigate to the Virtual Server Details page.
- On the Virtual Server List page, you can Stop each resource using the right More button.
- After selecting multiple servers with checkboxes, you can control multiple servers simultaneously using the Stop button at the top.
- On the Virtual Server Details page, click the Stop button at the top to start the server. 4. Check the status of the changed server in the Status Indicator item.
- When the Virtual Server shutdown is complete, the server status changes from Active to Shutoff.
- For detailed information about the Virtual Server status, please refer to Virtual Server 상세 정보 확인하기.
Restart Virtual Server
You can restart the created Virtual Server. To restart the Virtual Server, follow these steps.
- All Services > Compute > Virtual Server Click the menu. 1. Navigate to the Service Home page of the Virtual Server.
- On the Service Home page, click the Virtual Server menu. 2. Go to the Virtual Server List page.
- Virtual Server List page, click the resource to restart, and navigate to the Virtual Server Details page.
- Virtual Server List page allows you to restart each resource via the right More button.
- After selecting multiple servers with checkboxes, you can control multiple servers simultaneously via the Restart button at the top.
- On the Virtual Server Details page, click the Restart button at the top to start the server. 4. Check the status of the changed server in the Status Indicator item.
- During a Virtual Server restart, the server status passes through Rebooting and finally changes to Active.
- For detailed information about the Virtual Server status, please refer to Virtual Server 상세 정보 확인하기.
Managing Virtual Server Resources
If you need server control and management functions for the created Virtual Server resources, you can perform tasks from the Virtual Server List or Virtual Server Details page.
Create Image
You can create an image of a running Virtual Server.
This document provides instructions on how to create a user image on a running Virtual Server.
- Virtual Server List or Virtual Server Details page, click the Create Image button to generate a user Image.
- Refer to Image 상세 가이드 내 Image 생성하기 for the method of uploading a user’s owned Image file to create an Image.
To create a Virtual Server Image, follow the steps below.
All Services > Compute > Virtual Server Click the menu. 1. Navigate to the Service Home page of the Virtual Server.
On the Service Home page, click the Virtual Server menu. 2. Go to the Virtual Server List page.
On the Virtual Server List page, click the resource to create an Image. 3. Navigate to the Virtual Server Details page.
On the Virtual Server Details page, click the Create Image button. 4. Go to the Image creation page.
- Enter the required information in the Service Information Input area.
Category RequiredDetailed description Image name Essential the name of the Image to be created - Enter within 200 characters using English letters, numbers, spaces, and special characters(
-,_)
Table. Image service information input items - Enter within 200 characters using English letters, numbers, spaces, and special characters(
- Enter the required information in the Service Information Input area.
Check the input information and click the Done button.
- Once creation is complete, check the created resource on the All Services > Compute > Virtual Server > Image List page.
- When an Image is created, the generated Image is stored in the Object Storage used as internal storage. * Therefore, usage fees will be charged for Image storage.
- Since the file system of an Image created from an Active Virtual Server cannot be guaranteed to be intact, it is recommended to stop the server before creating the Image.
Edit server type
You can modify the server type of a Virtual Server.
To modify the server type of a Virtual Server, follow these steps.
- All Services > Compute > Virtual Server Click the menu. 1. Go to the Service Home page of the Virtual Server.
- On the Service Home page, click the Virtual Server menu. 2. Go to the Virtual Server List page.
- On the Virtual Server List page, click the resource to control its operation. 3. Navigate to the Virtual Server Details page.
- On the Virtual Server Details page, check the server status and click the server type Edit button. 4. Edit Server Type popup window opens.
- Edit Server Type In the popup window, after changing the server type, click the Confirm button.
- If you modify the Virtual Server’s server type, the Virtual Server status changes to a state related to performing a resize.
- For detailed information about the Virtual Server status, please refer to Virtual Server 상세 정보 확인하기.
Change IP
Please refer to IP 변경하기 for instructions on changing the IP.
- If you proceed with changing the IP, you will no longer be able to communicate using that IP, and you cannot cancel the IP change while it is in progress.
- The server is rebooted to apply the changed IP.
- If the server is running the Load Balancer service, you must delete the old IP from the LB server group and directly add the new IP as a member of the LB server group.
- Servers using Public NAT/Private NAT must disable and reconfigure Public NAT/Private NAT after changing the IP.
- If you are using Public NAT/Private NAT, first disable the use of Public NAT/Private NAT, complete the IP change, and then reconfigure.
- Whether to use Public NAT/Private NAT can be changed by clicking the Edit button of Public NAT IP/Private NAT IP on the Virtual Server Details page.
- Public NAT IP can only be modified when there is one server, the VPC is connected to an Internet Gateway, and the regular subnet is public.
Enable detailed monitoring for ServiceWatch
By default, Virtual Server is linked with ServiceWatch for basic monitoring. You can enable detailed monitoring as needed to identify operational issues more quickly and take action. For detailed information about ServiceWatch, refer to the ServiceWatch 개요.
To enable detailed ServiceWatch monitoring for a Virtual Server, follow these steps.
- Click the All Services > Compute > Virtual Server menu. 1. Navigate to the Service Home page of the Virtual Server.
- On the Service Home page, click the Virtual Server menu. 2. Navigate to the Virtual Server List page.
- On the Virtual Server List page, click the resource to enable detailed ServiceWatch monitoring. 3. Navigate to the Virtual Server Details page.
- Click the Edit button for ServiceWatch detailed monitoring on the Virtual Server Details page. 4. ServiceWatch Detailed Monitoring Edit Navigate to the popup window.
- ServiceWatch Detailed Monitoring Edit In the popup window, after selecting Enable, review the instructions and click the Confirm button.
- On the Virtual Server Details page, view the detailed ServiceWatch monitoring items.
Disable detailed monitoring for ServiceWatch
To disable detailed ServiceWatch monitoring of a Virtual Server, follow these steps.
- All Services > Compute > Virtual Server Click the menu. 1. Navigate to the Service Home page of the Virtual Server.
- On the Service Home page, click the Virtual Server menu. 2. Navigate to the Virtual Server List page.
- Virtual Server list on the page, click the resource to disable ServiceWatch detailed monitoring. 3. Navigate to the Virtual Server Details page.
- On the Virtual Server Details page, click the Edit button for ServiceWatch detailed monitoring. 4. ServiceWatch Detailed Monitoring Edit Navigate to the popup window.
- ServiceWatch Detailed Monitoring Edit In the popup window, after deselecting Enable, review the guidance message and click the Confirm button.
- On the Virtual Server Details page, check the ServiceWatch detailed monitoring items.
Virtual Server management add‑on features
For Virtual Server management, you can view console logs, generate dumps, and perform rebuilds. To view the console log, generate a dump, and rebuild a Virtual Server, follow these steps.
Check console log
You can view the current console log of the Virtual Server.
To view the console log of a Virtual Server, follow these steps.
- All Services > Compute > Virtual Server Click the menu. 1. Navigate to the Service Home page of the Virtual Server.
- On the Service Home page, click the Virtual Server menu. 2. Go to the Virtual Server List page.
- Virtual Server List On the page, click the resource to view the console log. 3. Navigate to the Virtual Server Details page.
- Virtual Server Details on the page, click the Console Log button. 4. Console Log navigates to the popup window.
- Console Log Check the console log output in the popup window.
Create Dump
To create a Dump file of the Virtual Server, follow these steps.
- Click the All Services > Compute > Virtual Server menu. 1. Navigate to the Service Home page of the Virtual Server.
- On the Service Home page, click the Virtual Server menu. 2. Navigate to the Virtual Server List page.
- On the Virtual Server List page, click the resource to view detailed information. 3. Navigate to the Virtual Server Details page.
- Click the Create Dump button on the Virtual Server Details page.
- The dump file is created inside the Virtual Server.
Execute Rebuild
You can delete the OS data and configuration of the existing Virtual Server and rebuild it on a new server.
To perform a Rebuild of a Virtual Server, follow these steps.
- All Services > Compute > Virtual Server Click the menu. 1. Go to the Service Home page of the Virtual Server.
- On the Service Home page, click the Virtual Server menu. 2. Go to the Virtual Server List page.
- On the Virtual Server List page, click the resource to perform Rebuild. 3. Navigate to the Virtual Server Details page.
- On the Virtual Server Details page, click the Rebuild button.
- During a Virtual Server Rebuild, the server status changes to Rebuilding, and when the Rebuild is complete, it returns to its pre‑Rebuild state.
- For detailed information about the Virtual Server status, please refer to Virtual Server 상세 정보 확인하기.
Terminate Virtual Server
If you terminate an unused Virtual Server, you can reduce operating costs. However, if you terminate a Virtual Server, the running service may be stopped immediately, so you should proceed with the termination only after fully considering the impact of service interruption.
To cancel a Virtual Server, follow these steps.
- Click the All Services > Compute > Virtual Server menu. 1. Navigate to the Service Home page of the Virtual Server.
- On the Service Home page, click the Virtual Server menu. 2. Virtual Server List page is accessed.
- On the Virtual Server List page, select the resource to terminate, and click the Terminate Service button.
- The termination of attached storage depends on the Delete on termination setting; see 해지 제약 사항.
- If the termination is complete, check on the Virtual Server list page whether the resource has been terminated.
Termination constraints
When a Virtual Server termination request cannot be processed, a popup window will provide guidance. Please refer to the case below.
- If File Storage is connected: Disconnect the File Storage first.
- If the LB server group is connected: First, disconnect the LB server group pool connection.
- When Lock is set: After changing the Lock setting to disabled, try again.
- If the Auto-Scaling Group attached to the Virtual Server is not In Service: After changing the status of the attached Auto-Scaling Group, try again.
Termination of attached storage varies depending on the Delete on termination setting; please refer to it.
- Whether the volume is deleted also depends on the Delete on termination setting.
- Delete on termination when not set: Even if you terminate the Virtual Server, the volume will not be deleted.
- Delete on termination when set: If the Virtual Server is terminated, the volume will be deleted.
- Volumes that have a snapshot will not be deleted even if Delete on termination is set.
- A multi-attach volume can be deleted only when the server being deleted is the last remaining server attached to the volume.