This is the multi-page printable view of this section. Click here to print.

Return to the regular view of this page.

How-to guides

The user can enter the required information for a Virtual Server through the Samsung Cloud Platform Console, select detailed options, and create the service.

Virtual Server Create

You can create and use Virtual Server services from the Samsung Cloud Platform Console.

To create Virtual Server, follow the steps below.

  1. All Services > Compute > Virtual Server Click the menu. Go to the Service Home page of Virtual Server.
  2. Click the Virtual Server Creation button on the Service Home page. You will be taken to the Virtual Server Creation page.
  3. Virtual Server Creation page, enter the information required to create the service, and select detailed options.
    • Image and Version Selection Select the required information in the area.
      Category
      Required
      Detailed description
      ImageRequiredSelect the type of Image to provide
      • Standard: Samsung Cloud Platform standard provided Image
        • Alma Linux, Oracle Linux, RHEL, Rocky Linux, Ubuntu, Windows
      • Custom: User-created Image
      • Kubernetes: Image for Kubernetes
        • RHEL, Ubuntu
      • Marketplace: Image subscribed from Marketplace
      Image versionRequiredSelect version of the chosen Image
      • Provides a list of versions of the server Image offered
      Table. Virtual Server Image and version selection input items
    • Service Information Input area, enter or select the required information.
      Category
      Required
      Detailed description
      Server countRequiredNumber of servers to create simultaneously
      • Only numbers can be entered, input a value between 1 and 100
      Service Type > Server TypeRequiredVirtual Server Server Type
      • Standard: Standard specifications commonly used
      • High Capacity: Large server specifications above Standard
      Service Type > Planned ComputeRequiredStatus of resources with Planned Compute set
      • In Use: Number of resources with Planned Compute set that are in use
      • Configured: Number of resources with Planned Compute set
      • Coverage Preview: Amount applied by Planned Compute per resource
      • Apply for Planned Compute Service: Go to Planned Compute service creation page
      Block StorageRequiredBlock Storage settings used by the server according to purpose
      • Basic OS: Area where OS is installed and used
        • Enter capacity in Units; minimum capacity varies by OS Image type
          • Alma Linux: Enter a value between 2 and 1,536
          • Oracle Linux: Enter a value between 7 and 1,536
          • RHEL: Enter a value between 2 and 1,536
          • Rocky Linux: Enter a value between 2 and 1,536
          • Ubuntu: Enter a value between 2 and 1,536
          • Windows: Enter a value between 4 and 1,536
        • SSD: High-performance general volume
        • HDD: General volume
        • SSD/HDD_KMS: Additional encrypted volume using Samsung Cloud Platform KMS (Key Management Service) encryption key
          • Encryption can only be applied at initial creation and cannot be changed afterwards
          • Using SSD_KMS disk type causes performance degradation
      • Additional: Use when additional user space is needed outside the OS area
        • After selecting Use, enter the storage type and capacity
        • Click the + button to add storage, and the x button to delete (up to 25 can be added)
        • Enter capacity in Units, value between 1 and 1,536
          • 1 Unit is 8GB, so 8 ~ 12,288GB is created
        • SSD: High-performance general volume
        • HDD: General volume
        • SSD/HDD_KMS: Additional encrypted volume using Samsung Cloud Platform KMS (Key Management Service) encryption key
          • Encryption can only be applied at initial creation and cannot be changed afterwards
          • Using SSD_KMS disk type may cause performance degradation
        • SSD_MultiAttach: Volume that can be attached to more than one server
      • Delete on termination: When Delete on Termination is selected, the volume is terminated together with the server
        • Volumes with snapshots are not deleted even when Delete on termination is enabled
        • Multi-attach volumes are deleted only when the server being deleted is the last remaining server attached to the volume
      Server GroupSelectSet servers belonging to the same Server Group to Anti-Affinity (distributed placement), Affinity (proximate placement), Partition (distributed placement of Virtual Server and Block Storage)
      • Use after selecting, select Server Group
      • Select Create New to create a Server Group
      • Place servers belonging to the same Server Group according to the selected policy using a Best Effort method
        • Select a policy among Anti-Affinity (distributed placement), Affinity (proximate placement), Partition (distributed placement of Virtual Server and Block Storage)
      Table. Virtual Server Service Information Input Items
Caution
  • If you use the Partition (distributed deployment of Virtual Server and Block Storage) policy among Server Group policies, since additional allocation of Block Storage Volume after Virtual Server creation is not possible, please create all required Block Storage at the Virtual Server creation stage.
* In the **Required Information Input** area, enter or select the necessary information.

Category
Required or not
Detailed description
Server NameRequiredEnter a name to distinguish the server when the number of selected servers is 1
  • Set the hostname to the entered server name
  • Enter within 63 characters using English letters, numbers, spaces, and special characters (-, _)
Network Settings > Create New Network PortRequiredSet the network where the Virtual Server will be installed
  • Select a pre-created VPC.
  • General Subnet: Select a pre-created general Subnet
    • IP can be set to Auto Generate or user input; if Input is selected, the user can directly enter the IP
    • NAT: Available only when there is a single server and the VPC is connected to an Internet Gateway. Checking Use allows selection of a NAT IP
    • NAT IP: Select NAT IP
      • If there is no NAT IP to select, click the Create New button to generate a Public IP
      • Click the Refresh button to view and select the created Public IP
      • Creating a Public IP incurs charges according to the Public IP pricing policy
  • Local Subnet (Optional): Select Use for Local Subnet
    • Not a required element for creating the service
    • A pre-created Local Subnet must be selected
    • IP can be set to Auto Generate or user input; if Input is selected, the user can directly enter the IP
  • Security Group: Settings required to access the server
    • Select: Choose a pre-created Security Group
    • Create New: If there is no applicable Security Group, it can be created separately in the Security Group service
    • Up to 5 can be selected
    • If no Security Group is set, all access is blocked by default
    • A Security Group must be set to allow required access
Network Settings > Existing Network Port AssignmentRequiredSet the network where the Virtual Server will be installed
  • Select a pre-created VPC
  • General Subnet: Select a pre-created General Subnet and Port
    • NAT: Can be used only when there is one server and the VPC has an Internet Gateway attached. If you check to use it, you can select a NAT IP.
    • NAT IP: Please select a NAT IP.
      • If there is no NAT IP to select, click the New Creation button to create a Public IP.
      • Click the Refresh button to view and select the created Public IP.
  • Local Subnet (Optional): Select Use of the Local Subnet
    • Select a pre-created Local Subnet and Port
KeypairRequiredUser authentication method to use when connecting to the server
  • Create New: Create new if a new Keypair is needed
  • Default login account list by OS
    • Alma Linux: almalinux
    • Oracle Linux: cloud-user
    • RHEL: cloud-user
    • Rocky Linux: rocky
    • Ubuntu: ubuntu
    • Windows: sysadmin
Table. Virtual Server Required Information Input Items
* Enter additional information In the area, please input or select the required information.
Category
Required
Detailed description
LockSelectLock usage setting
  • Using Lock prevents actions such as server termination, start, stop from being executed, preventing malfunctions caused by mistakes
Init scriptSelectScript executed when the server starts
  • The init script must be written as a Batch script for Windows, a Shell script or cloud‑init for Linux, depending on the image type.
  • Up to 45,000 bytes can be entered
TagSelectAdd Tag
  • Up to 50 can be added per resource
  • After clicking the Add Tag button, enter or select Key, Value values
Table. Virtual Server Additional Information Input Items
4. Summary Check the detailed information and estimated billing amount generated in the panel, and click the Complete button. * When creation is complete, check the created resources on the Virtual Server List page.

Notice

When entering a server name, if you use spaces and special characters (_) the OS hostname will have spaces and special characters (_) changed to the special character (-) when set. Please refer to this when setting the OS hostname.

  • Example: If the server name is ‘server name_01’, the OS hostname is set to ‘server-name-01’.
Reference
  • Rocky Linux, Oracle Linux with Virtual Server creation case, additional configuration is required for time synchronization (NTP: Network Time Protocol). For more details, please refer to Setting up Linux NTP.
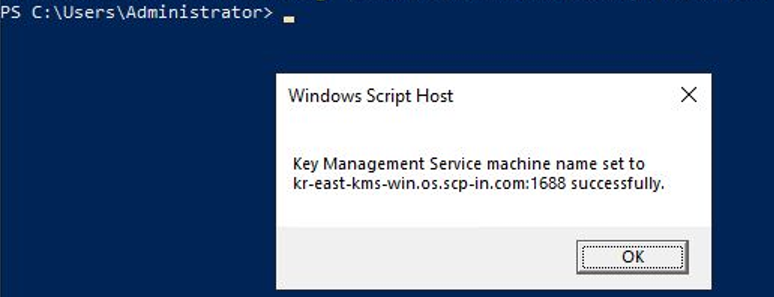
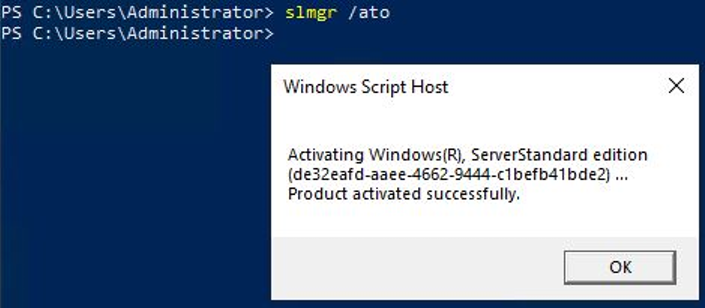
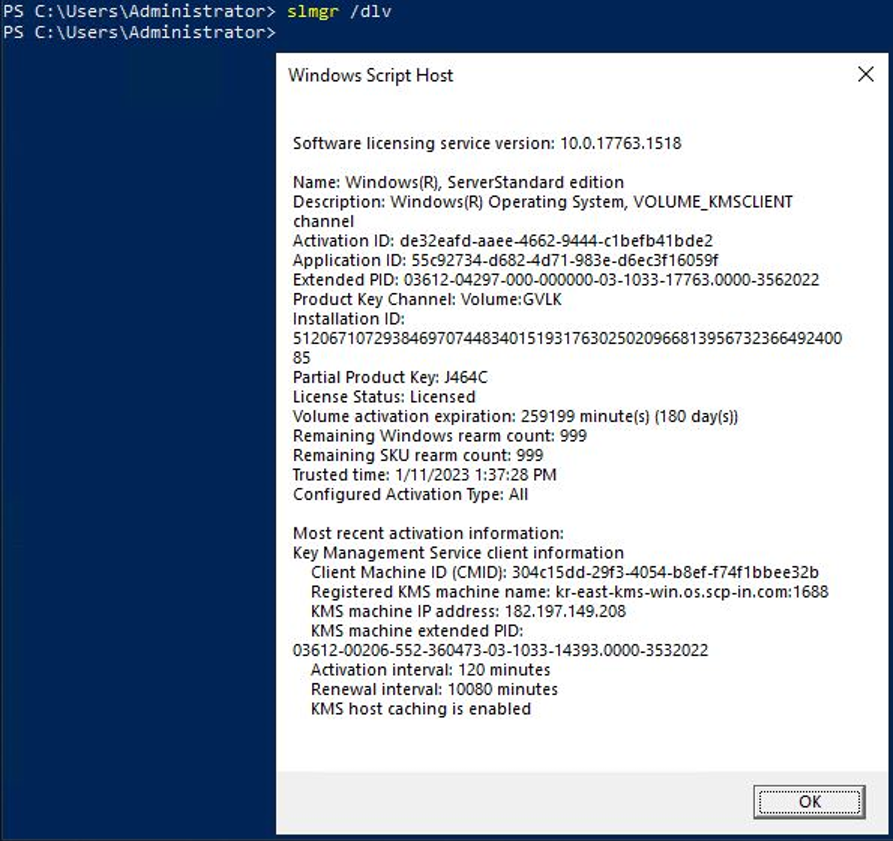
  • If RHEL and Windows Server were created before July 2025, RHEL Repository and WKMS (Windows Key Management Service) settings need to be modified. For more details, see Setting up RHEL Repo and WKMS.

Check Virtual Server detailed information

Virtual Server service allows you to view and edit the full resource list and detailed information. Virtual Server Details page is composed of Detailed Information, Tags, Activity Log tabs.

To view detailed information of the Virtual Server service, follow the steps below.

  1. Click the All Services > Compute > Virtual Server menu. Go to the Service Home page of Virtual Server.
  2. Click the Virtual Server menu on the Service Home page. You will be taken to the Virtual Server list page.
  3. Click the resource to view detailed information on the Virtual Server List page. It will navigate to the Virtual Server Details page.
    • Virtual Server Details page displays status information and additional feature information, and consists of Details, Tags, Activity History tabs.
    • Virtual Server Additional Features for detailed information, please refer to Virtual Server Management Additional Features.
      CategoryDetailed description
      Virtual Server StatusStatus of Virtual Server created by the user
      • Build: State where the Build command has been issued
      • Building: Build in progress
      • Networking: Server creation in progress process
      • Scheduling: Server creation in progress process
      • Block_Device_Mapping: Block Storage being attached during server creation
      • Spawning: Server creation process is ongoing
      • Active: Available state
      • Powering_off: State when a stop request is made
      • Deleting: Server deletion in progress
      • Reboot_Started: Reboot in progress state
      • Error: Error state
      • Migrating: State where the server is migrating to another host
      • Reboot: State where the Reboot command has been issued
      • Rebooting: Rebooting in progress
      • Rebuild: State where the Rebuild command has been issued
      • Rebuilding: State when a Rebuild request is made
      • Rebuild_Spawning: Rebuild process is ongoing
      • Resize: State where the Resize command has been issued
      • Resizing: Resize in progress
      • Resize_Prep: State when a server type modification request is made
      • Resize_Migrating: State where the server is being moved to another host while resizing
      • Resize_Migrated: State where the server has completed moving to another host while resizing
      • Resize_Finish: Resize completed
      • Revert_Resize: Resize or migration of the server failed for some reason. The target server is cleaned up and the original server is restarted
      • Shutoff: State when Powering off is completed
      • Verity_ Resize: After Resize_Prep due to a server type modification request, the server type is confirmed or can be reverted
      • Resize_Reverting: State when a server type revert request is made
      • Resize_Confirming: State where the server’s Resize request is being confirmed
      Server ControlButton to change server status
      • Start: Start a stopped server
      • Stop: Stop a running server
      • Restart: Restart a running server
      Image creationCreate user Image from the current server’s Image
      Console LogView current server’s console log
      • You can check the console logs output by the current server. For more details, refer to Check Console Log.
      Dump creationCreate a dump of the current server
      • The dump file is created inside the Virtual Server
      RebuildThe OS area data and settings of the existing Virtual Server are deleted, and it is configured by rebuilding to a new server
      Service terminationButton to cancel the service
      Table. Virtual Server status information and additional functions

Detailed Information

Virtual Server List page, you can view the detailed information of the selected resource and, if necessary, edit the information.

CategoryDetailed description
ServiceService Name
Resource TypeResource Type
SRNUnique resource ID in Samsung Cloud Platform
  • In Virtual Server, it means Virtual Server SRN
Resource NameResource Name
  • In the Virtual Server service, it refers to the Virtual Server name.
Resource IDUnique resource ID in the service
CreatorUser who created the service
Creation timeService creation time
EditorUser who edited the service information
Modification Date/TimeDate/Time when service information was edited
Server NameServer Name
  • Edit button click to change name
  • When changing the server name, the OS’s Hostname is not changed, only the information within the Samsung Cloud Platform Console is changed
  • Editing is not possible for Virtual Servers created from other resources
Server TypevCPU, Memory Information Display
  • If you need to change to a different server type, click the Edit button to set
Image nameServer’s OS Image and version
  • Image can be selected by version and build date
LockDisplay whether Lock is used or not
  • If you need to change the Lock property value, click the Edit button to set it
Server GroupName of the server group the server belongs to
  • If the server group is not used, it will not be displayed.
Keypair nameServer authentication information set by the user
  • The default login accounts for each OS are as follows.
    • Alma Linux: almalinux
    • Oracle Linux: cloud-user
    • RHEL: cloud-user
    • Rocky Linux: rocky
    • Ubuntu: ubuntu
    • Windows: sysadmin
Planned ComputeResource status with Planned Compute set
LLM EndpointURL for using LLM
ServiceWatch detailed monitoringDisplay whether ServiceWatch detailed monitoring is enabled
  • To enable ServiceWatch detailed monitoring, click the Edit button to configure
  • Not provided for Virtual Servers created in Auto-Scaling Group or Marketplace
NetworkNetwork information of Virtual Server
  • VPC, standard Subnet, IP and status, Public NAT IP and status, Private NAT IP and status, Security Group
  • If IP change is needed, you can set it by clicking the Edit button
    • Editable only when Virtual Server status is other than Active, Shutoff
  • If Security Group change is needed, you can set it by clicking the Edit button
  • Add as new network port: select standard Subnet and IP
    • You can select another standard Subnet within the same VPC
    • IP can be set to auto-generate or user input; if input is selected, the user can directly enter the IP
  • Add as existing network port: select a pre-created standard Subnet and port
Local SubnetLocal Subnet information of Virtual Server
  • Local Subnet, Local Subnet IP, Security Group
  • If a Security Group change is needed, you can click the Edit button to set it
  • Add with new network port: select Local Subnet and IP
    • You can select another regular Subnet within the same VPC
    • IP can be set to auto-generate or user input, and if input is selected, the user can directly enter the IP
  • Add with existing network port: select a pre-created Local Subnet and port
Block StorageInformation of Block Storage connected to the server
  • Volume ID, Volume Name, Disk Type, Capacity, Connection Information, Type, Delete on termination, Status
  • Add: Connect additional Block Storage if needed
  • Modify Delete on termination: Modify the Delete on termination value
  • Detach: Detach the Block Storage connection
Table. Virtual Server Detailed Information Tab Items

Tag

Virtual Server list page allows you to view the tag information of the selected resource, and you can add, modify, or delete it.

CategoryDetailed description
Tag ListTag List
  • Key, Value information of tags can be checked
  • Up to 50 tags can be added per resource
  • When entering tags, search and select from existing Key and Value lists
Table. Virtual Server Tag Tab Items

Work History

Virtual Server List page allows you to view the operation history of the selected resource.

CategoryDetailed description
Work History ListResource Change History
  • You can view task details, task date/time, resource type, resource name, task result, and operator information
  • Work History List list, click the corresponding resource. Work History Details popup window will open.
Table. Virtual Server Work History Tab Detailed Information Items

Virtual Server Operation Control

If you need to control the operation of generated Virtual Server resources, you can perform the task on the Virtual Server List or Virtual Server Details page. You can start, stop, and restart a running server.

Virtual Server Start

You can start a shutoff (Shutoff) Virtual Server. To start the Virtual Server, follow the steps below.

  1. All Services > Compute > Virtual Server Click the menu. Navigate to the Service Home page of Virtual Server.
  2. Click the Virtual Server menu on the Service Home page. Go to the Virtual Server list page.
  3. Virtual Server List page, click the resource to start among the stopped (Shutoff) servers, and go to the Virtual Server Details page.
    • Virtual Server List page, you can start each resource via the right More button.
    • After selecting multiple servers with checkboxes, you can control multiple servers simultaneously via the Start button at the top.
  4. Click the Start button at the top of the Virtual Server Details page to start the server. Check the changed server status in the Status Display item.

Virtual Server Stop

You can stop a Virtual Server that is active (Active). To stop the Virtual Server, follow the steps below.

  1. Click the All Services > Compute > Virtual Server menu. Go to the Service Home page of Virtual Server.
  2. Click the Virtual Server menu on the Service Home page. You will be taken to the Virtual Server List page.
  3. On the Virtual Server List page, click the resource to stop among the servers that are running (Active), and go to the Virtual Server Details page.
    • Virtual Server List page, you can Stop each resource via the right More button.
    • After selecting multiple servers with the check box, you can control multiple servers simultaneously using the Stop button at the top.
  4. Click the Stop button at the top on the Virtual Server Details page to start the server. Check the changed server status in the Status Display item.
    • When the Virtual Server shutdown is completed, the server status changes from Active to Shutoff.
    • For detailed information about the Virtual Server status, please refer to Check Virtual Server detailed information.

Virtual Server Restart

You can restart the generated Virtual Server. To restart the Virtual Server, follow the steps below.

  1. Click the All Services > Compute > Virtual Server menu. Go to the Service Home page of Virtual Server.
  2. Click the Virtual Server menu on the Service Home page. You will be taken to the Virtual Server list page.
  3. On the Virtual Server List page, click the resource to restart, and navigate to the Virtual Server Details page.
    • You can restart each resource via the right More button on the Virtual Server list page.
    • After selecting multiple servers with the check box, you can control multiple servers simultaneously via the Restart button at the top.
  4. Virtual Server Details page, click the Restart button at the top to start the server. Check the status of the changed server in the Status Display item.

Virtual Server Resource Management

If you need server control and management functions for the generated Virtual Server resources, you can perform tasks on the Virtual Server List or Virtual Server Details page.

Image Create

You can create an image of a running Virtual Server.

Reference

This content provides instructions on how to create a user image with a running Virtual Server.

  • Virtual Server List or Virtual Server Detail page, click the Create Image button to create a user Image.
  • The method of creating an Image by uploading the Image file you own, please refer to Image Detailed Guide: Creating Image.

To create a Virtual Server’s Image, follow the steps below.

  1. All Services > Compute > Virtual Server Click the menu. Navigate to Virtual Server’s Service Home page.

  2. Click the Virtual Server menu on the Service Home page. Go to the Virtual Server list page.

  3. Virtual Server List page, click the resource to create an Image. Virtual Server Details page, navigate.

  4. Virtual Server Details page, click the Create Image button. It navigates to the Create Image page.

    • Service Information Input Enter the required information in the area.
      Category
      Required
      Detailed description
      Image nameRequiredName of the Image to create
      • Enter within 200 characters using English letters, numbers, spaces, and special characters (-, _)
      Table. Image Service Information Input Items
  5. Check the input information and click the Complete button.

    • When creation is complete, check the created resources on the All Services > Compute > Virtual Server > Image List page.
Notice
  • When you create an Image, the generated Image is stored in the Object Storage used as internal storage. Therefore, usage fees for Image storage are charged.
  • The file system of the Image generated from an Active state Virtual Server cannot guarantee integrity, so it is recommended to stop the server before creating the Image.

Edit Server Type

You can modify the server type of the Virtual Server.

Reference
For the mutable server types provided by Virtual Server, please refer to Virtual Server Server Type.

To modify the server type of a Virtual Server, follow these steps.

  1. All Services > Compute > Virtual Server Click the menu. Go to the Service Home page of Virtual Server.
  2. Click the Virtual Server menu on the Service Home page. Go to the Virtual Server list page.
  3. Virtual Server List page, click the resource to control operation. Move to the Virtual Server Details page.
  4. Virtual Server Details page, check the server status, and click the Edit button for server type. Server Type Edit popup opens.
  5. Server Type Modification In the popup window, after changing the server type, click the Confirm button.
    • Virtual Server if you modify the server type, Virtual Server status changes to a state related to performing a resize.
    • For detailed information about the Virtual Server status, please refer to Check Virtual Server detailed information.
Reference
If you change the Virtual Server type, monitoring performance metric data may not be collected normally for a short period. In the next collection cycle (1 minute), normal performance metrics will be collected.

Change IP

How to change IP, please refer to IP Change.

Caution
  • If you proceed with changing the IP, you will no longer be able to communicate with that IP, and you cannot cancel the IP change while it is in progress.
  • The server will be rebooted to apply the changed IP.
  • If the server is running the Load Balancer service, you must delete the old IP from the LB server group and directly add the changed IP as a member of the LB server group.
  • Servers using Public NAT/Private NAT must disable the use of Public NAT/Private NAT after changing the IP and set it again.
  • If you are using Public NAT/Private NAT, first disable the use of Public NAT/Private NAT, complete the IP change, and then set it up again.
    • Public NAT/Private NAT usage can be changed by clicking the Edit button of Public NAT IP/Private NAT IP on the Virtual Server Details page.

ServiceWatch Enable detailed monitoring

Basically, Virtual Server is linked with ServiceWatch and basic monitoring. As needed, you can enable detailed monitoring to identify operational issues more quickly and take action. For more information about ServiceWatch, see ServiceWatch Overview.

Caution
Basic monitoring is provided for free, but activating detailed monitoring incurs additional charges. Please be aware when using.

To enable detailed monitoring of ServiceWatch on Virtual Server, follow the steps below.

  1. All Services > Compute > Virtual Server Click the menu. Go to the Service Home page of Virtual Server.
  2. Click the Virtual Server menu on the Service Home page. Navigate to the Virtual Server list page.
  3. Virtual Server List page, click the resource to enable detailed ServiceWatch monitoring. Virtual Server Detail page.
  4. Click the Edit button for ServiceWatch Detailed Monitoring on the Virtual Server Details page. It will navigate to the ServiceWatch Detailed Monitoring Edit popup.
  5. ServiceWatch Detailed Monitoring Modification in the popup window, after selecting Enable, check the guidance text and click the Confirm button.
  6. Virtual Server Details page, check the ServiceWatch detailed monitoring items.

ServiceWatch Disable detailed monitoring

Caution
Disabling detailed monitoring is required for cost efficiency. Keep detailed monitoring enabled only when absolutely necessary, and disable detailed monitoring for the rest.

To disable detailed monitoring of ServiceWatch on Virtual Server, follow the steps below.

  1. All Services > Compute > Virtual Server Click the menu. Go to the Service Home page of Virtual Server.
  2. Click the Virtual Server menu on the Service Home page. Navigate to the Virtual Server list page.
  3. Virtual Server List page, click the resource to disable ServiceWatch detailed monitoring. Move to the Virtual Server Details page.
  4. Click the ServiceWatch detailed monitoring Edit button on the Virtual Server Details page. You will be taken to the ServiceWatch detailed monitoring Edit popup.
  5. ServiceWatch Detailed Monitoring Modification in the popup window after deselecting Activation, check the guidance text and click the Confirm button.
  6. Virtual Server Details page, check the ServiceWatch detailed monitoring items.

Virtual Server Management Additional Features

Virtual Server can view console logs, generate dumps, and rebuild for server management. To view console logs, generate dumps, and rebuild the Virtual Server, follow the steps below.

Check console log

You can view the current console log of the Virtual Server.

To check the console log of the Virtual Server, follow the steps below.

  1. Click the All Services > Compute > Virtual Server menu. Go to the Service Home page of Virtual Server.
  2. Service Home page, click the Virtual Server menu. Navigate to the Virtual Server list page.
  3. Virtual Server list page, click the resource to view the console log. It moves to the Virtual Server details page.
  4. Virtual Server Details page, click the Console Log button. It navigates to the Console Log popup window.
  5. Console Log Check the console log output in the popup window.

Create Dump

To create a dump file of the Virtual Server, follow the steps below.

  1. All Services > Compute > Virtual Server Click the menu. Navigate to Virtual Server’s Service Home page.
  2. Click the Virtual Server menu on the Service Home page. You will be taken to the Virtual Server list page.
  3. Click the resource to view detailed information on the Virtual Server List page. It navigates to the Virtual Server Details page.
  4. Click the Create Dump button on the Virtual Server Details page.
    • The dump file is created inside the Virtual Server.

Rebuild perform

You can delete the OS area data and settings of the existing Virtual Server and rebuild it as a new server.

To perform a Rebuild of the Virtual Server, follow the steps below.

  1. All Services > Compute > Virtual Server Click the menu. Go to the Service Home page of Virtual Server.
  2. Service Home page, click the Virtual Server menu. Navigate to the Virtual Server list page.
  3. Virtual Server List page, click the resource to perform Rebuild. Move to the Virtual Server Details page.
  4. Virtual Server Details on the page click the Rebuild button.
    • During Virtual Server Rebuild, the server status changes to Rebuilding, and when the Rebuild is completed, it returns to the state before the Rebuild.
    • Virtual Server status detailed information, please refer to Virtual Server Check Detailed Information.

Virtual Server Cancel

If you terminate an unused Virtual Server, you can reduce operating costs. However, terminating a Virtual Server may cause the running service to stop immediately, so you should consider the impact of service interruption thoroughly before proceeding with the termination.

Caution
Please note that data cannot be recovered after service termination.

To cancel the Virtual Server, follow the steps below.

  1. All Services > Compute > Virtual Server Click the menu. Go to the Service Home page of Virtual Server.
  2. Click the Virtual Server menu on the Service Home page. Navigate to the Virtual Server list page.
  3. Virtual Server list On the page, select the resource to cancel, and click the Cancel Service button.
    • The termination of connected storage depends on the Delete on termination setting, please refer to Termination Constraints.
  4. When the termination is complete, check on the Virtual Server List page whether the resource has been terminated.

Termination Constraints

Virtual Server termination request cannot be processed, we will guide you with a popup window. Please refer to the cases below.

Cancellation not allowed
  • When File Storage is connected: Please disconnect the File Storage first.
  • When the LB server group is connected: First disconnect the LB server group pool connection.
  • When Lock is set: After changing the Lock setting to disabled, try again.
  • When Backup is connected: Please disconnect the Backup connection first.
  • If the Auto-Scaling Group attached to the Virtual Server is not in In Service state: After changing the status of the attached Auto-Scaling Group, try again.

Termination of attached storage depends on the Delete on termination setting, please refer to it.

Delete on termination Delete per setting
  • Delete on termination The volume deletion also depends on the setting.
    • Delete on termination If not set: Even if you terminate the Virtual Server, the volume will not be deleted.
    • Delete on termination when set: If the Virtual Server is terminated, the volume will be deleted.
  • Volumes that have a Snapshot will not be deleted even if Delete on termination is set.
  • Multi attach volume will be deleted only when the server being deleted is the last remaining server attached to the volume.

1 - Image

The user can enter the required information for the Image service within the Virtual Server service and select detailed options through the Samsung Cloud Platform Console to create the service.

Image generation

You can create and use the Image service while using the Virtual Server service on the Samsung Cloud Platform Console.

To create an Image, follow the steps below.

  1. Click the All Services > Compute > Virtual Server menu. Go to the Virtual Server’s Service Home page.

  2. Click the Image menu on the Service Home page. Go to the Image List page.

  3. Click the Image Create button on the Image List page. It navigates to the Image Create page.

    • Service Information Input Enter or select the required information in the area.
      Category
      Required
      Detailed description
      Image nameRequiredName of the Image to create
      • Enter within 255 characters using English letters, numbers, spaces, and special characters (-, _)
      Image file > URLRequiredEnter URL after uploading Image file to Object Storage
      • Object Storage Details page allows copying URL
      • The Bucket of Object Storage where the Image file is uploaded must be in the same zone as the server to be created
      • Image file can only have .qcow2 extension
      • Upload a secure Image file to minimize security risks.
      OS typeRequiredOS type of the uploaded Image file
      • Select from Alma Linux, CentOS, Oracle Linux, RHEL, Rocky Linux, Ubuntu
      Minimum DiskRequiredMinimum disk size (GB) for the Image to be created
      • Enter a value between 0 and 12,288 GB
      Minimum RAMRequiredMinimum RAM capacity (GB) of the image to be created
      • Enter a value between 0 and 2,097,151 GB
      VisibilityRequiredIndicates access permissions for the Image
      • Private: Can be used only within the Account
      • Shared: Can be shared between Accounts
      ProtectedSelectSelect whether Image deletion is prohibited
      • Checking Use prevents accidental deletion of the Image
      • This setting can be changed after Image creation
      Table. Image Service Information Input Items
    • Additional Information Input Enter or select the required information in the area.
      Category
      Required
      Detailed description
      TagSelectAdd Tag
      • Up to 50 can be added per resource
      • After clicking the Add Tag button, enter or select Key, Value values
      Table. Image additional information input items
  4. Summary Check the detailed information and estimated billing amount generated in the panel, and click the Complete button.

    • When creation is complete, check the created resources on the Image List page.

Image Check detailed information

Image service can view and edit the full resource list and detailed information. Image detail page consists of detailed information, tags, operation history tabs.

To view detailed information of the Image service, follow the steps below.

  1. All Services > Compute > Virtual Server Click the menu. Go to the Service Home page of Virtual Server.
  2. Click the Image menu on the Service Home page. Go to the Image list page.
  3. Image List page, click the resource to view detailed information. Image Details page will be opened.
    • Image Details page displays status information and additional feature information, and consists of Detail Information, Tag, Work History tabs.
      CategoryDetailed description
      Image statusStatus of the Image created by the user
      • Active: Available
      • Queued: When an Image creation request is made, the Image is uploaded and waiting for processing
      • Importing: When an Image creation request is made, the Image is uploaded and being processed
      Create shared ImageCreate Image to share with another Account
      • Can be created only when the Image’s Visibility is private and the Image has snapshot information
      Share with another AccountImage can be shared with another Account
      • If the Image’s Visibility is Shared, it can be shared with another Account
      • Only displayed for Images created by Create shared Image or by uploading a qcow2 file
      Image DeleteButton to delete the Image
      • If the Image is deleted, it cannot be recovered
      Table. Image status information and additional functions

Detailed Information

Image list page allows you to view detailed information of the selected resource and edit the information if needed.

CategoryDetailed description
ServiceService Name
Resource TypeResource Type
SRNUnique resource ID in Samsung Cloud Platform
  • In Image, it means Image SRN
Resource NameImage Name
Resource IDImage’s unique resource ID
CreatorUser who created the Image
Creation timeImage creation time
EditorUser who modified the Image information
Modification DateDate/Time when Image information was modified
Image nameImage name
Minimum DiskImage’s minimum disk capacity (GB)
  • If you need to modify the minimum disk, click the Edit button to set it
Minimum RAMMinimum RAM capacity of the Image (GB)
OS typeImage’s OS type
  • Alma Linux, CentOS, Oracle Linux, RHEL, Rocky Linux, SLES, Ubuntu
OS hash algorithmOS hash algorithm method
VisibilityDisplays access permissions for the Image
  • Private: Can be used only within the Account
  • Shared: Can be shared between Accounts
ProtectedSelect whether image deletion is prohibited
  • enabled setting prevents accidental deletion of the Image
Image sizeImage size
  • If the generated Image size is 1GB or less, it is displayed as 1GB.
Image TypeClassification by Image creation method
  • Snapshot-Based: When the configuration of the currently used Virtual Server is created as an Image
  • Image-Based: When an Image is created by uploading a qcow2 extension file or by creating a shared Image
Image file URLImage file URL uploaded to Object Storage when creating an Image
  • Not displayed for Images created via the Image creation menu on the Virtual Server detail page, but displayed when the Image file is uploaded to Object Storage.
Sharing StatusStatus of sharing images with other Accounts
  • Approved Account ID: ID of the Account that has been approved for sharing
  • Modification Date/Time: The date/time when sharing was requested to another Account, after the sharing status changes Pending → Accepted it is updated to that date/time
  • Status: Approval status
    • Accepted: Approved and being shared
    • Pending: Waiting for approval
  • Sharing stopped: Sharing has been stopped
Table. Image detailed information tab items

Tag

Image list page, you can view the tag information of the selected resource, and you can add, modify, or delete it.

CategoryDetailed description
Tag ListTag List
  • You can view the tag’s Key, Value information
  • Up to 50 tags can be added per resource
  • When entering a tag, search and select from the existing list of Keys and Values
Table. Image tag tab items

Work History

You can view the operation history of the selected resource on the Image list page.

CategoryDetailed description
Work History ListResource Change History
  • Work date/time, Resource ID, Resource name, Work details, Event topic, Work result, Verify worker information
Table. Image work history tab detailed information items

Image Resource Management

Describes the control and management functions of the generated Image.

Create Image for Sharing

Create an Image to share with another Account.

Notice
  • Image’s Visibility is private and only when the Image has snapshot information can a shared Image be created.
  • Shared Image includes only one OS area disk volume as the imaging target. Additionally, connected data volumes are not included in the Image, so if needed, please copy the data to a separate volume and use the volume migration function.

To create an image for sharing, follow the steps below.

  1. Log in to the shared Account and click the All Services > Compute > Virtual Server menu. Go to the Virtual Server’s Service Home page.
  2. Click the Image menu on the Service Home page. Navigate to the Image List page.
  3. Click the Image to create a shared Image on the Image List page. You will be taken to the Image Details page.
  4. Create Shared Image Click the button. A popup window notifying the creation of a shared Image will open.
  5. After checking the notification content, click the Complete button.

Share Image to another Account

Create an image to share with another Account.

Notice
  • .qcow2 extension file uploaded to create, or only Images created via Image Details page with Create Shared Image can be shared with other Accounts.
  • The Image to be shared must have Visibility set to Shared.

To share the Image with another Account, follow these steps.

  1. Log in to the shared Account and click the All Services > Compute > Virtual Server menu. Navigate to the Virtual Server’s Service Home page.

  2. Click the Image menu on the Service Home page. It navigates to the Image List page.

  3. On the Image List page, click the Image you want to share with another Account. It moves to the Image Details page.

  4. Click the Share to another Account button. A popup window notifying Image sharing opens.

  5. After checking the notification content, click the Confirm button. It moves to the Share Image with another Account page.

  6. Share Image with another Account on the page, enter Share Account ID, and click the Complete button. A popup notifying Image sharing opens.

    Category
    Required
    Detailed description
    Image name-Name of the Image to share
    • Input not allowed
    Image ID-Image ID to share
    • Input not allowed
    Shared Account IDRequiredEnter another Account ID to share
    • Enter within 64 characters using English letters, numbers, and special character -
    Table. Image sharing items to another Account

  7. After checking the notification content, click the Confirm button. You can check the information in the sharing status of the Image Details page.

    • When first requested, the status is Pending, and when approval is completed by the Account to be shared, it changes to Accepted, and if approval is denied, it changes to Rejected.

Receive shared Image from another Account

To receive an Image shared from another Account, follow the steps below.

  1. Log in to the account to be shared and click the All Services > Compute > Virtual Server menu. Go to the Service Home page of the Virtual Server.

  2. Click the Image menu on the Service Home page. It navigates to the Image List page.

  3. Image List on the page More > Image Share Request List click the button. Image Share Request List popup opens.

  4. Image Sharing Request List In the popup window, click the Approve or Reject button for the Image to be shared.

    CategoryDetailed description
    Image nameshared Image name
    OS typeOS type of shared Image
    Owner Account IDOwner Account ID of shared Image
    Creation timeCreation time of shared Image
    ApprovalApprove the shared Image
    RejectReject processing of the shared Image
    Table. Image sharing request list item

  5. After checking the notification content, click the Confirm button. You can check the shared Image in the Image list.

Image Delete

You can delete unused images. However, once an image is deleted it cannot be recovered, so you should fully consider the impact before proceeding with the deletion.

Caution
Please be careful as data cannot be recovered after deleting the service.

To delete Image, follow the steps below.

  1. All Services > Compute > Virtual Server Click the menu. Navigate to the Service Home page of Virtual Server.
  2. Click the Image menu on the Service Home page. Go to the Image list page.
  3. Image list 페이지에서 삭제할 자원을 선택하고, Delete 버튼을 클릭하세요.
    • Image list page, select multiple Image check boxes, and click the Delete button at the top of the resource list.
  4. When deletion is complete, check on the Image List page whether the resource has been deleted.

2 - Keypair

The user can create the service by entering the required information of the Keypair in the Virtual Server service through the Samsung Cloud Platform Console and selecting detailed options.

Create Keypair

You can use the Virtual Server service while using the Samsung Cloud Platform Console and create and use the Keypair service.

To create a key pair, follow these steps.

  1. Click All Services > Compute > Virtual Server menu. It moves to the Service Home page of Virtual Server.
  2. Service Home page, click the Keypair menu. It moves to the Keypair list page.
  3. Keypair list page, click the Create Keypair button. Move to the Create Keypair page.
    • Enter Service Information area, please enter the necessary information.
      Classification
      Necessity
      Detailed Description
      Keypair nameRequiredName of the Keypair to be created
      • Enter within 255 characters using English, numbers, spaces, and special characters (-, _)
      Keypair typemandatoryssh
      Table. Keypair service information input items
    • Enter Additional Information Enter or select the required information in the area.
      Classification
      Necessity
      Detailed Description
      TagSelectionAdd Tag
      • Up to 50 can be added per resource
      • Click the Add Tag button and enter or select Key, Value
      Table. Input items for adding Keypair information
      Caution
      • After creation is complete, you can download the Key only once for the first time. Since re-issuance is not possible, please check if it has been downloaded.
      • Please store the downloaded Private Key in a safe place.
  4. Check the input information and click the Complete button.
    • Once creation is complete, check the created resource on the Keypair list page.

Check Keypair Details

The Keypair service allows you to view and modify the list of all resources and detailed information. The Keypair details page consists of details, tags, and operation history tabs.

To check the Keypair details, follow the following procedure.

  1. All services > Compute > Virtual Server menu is clicked. It moves to the Service Home page of Virtual Server.
  2. Service Home page, click the Keypair menu. It moves to the Keypair list page.
  3. Keypair list page, click on the resource to check the detailed information. Move to the Keypair details page.
    • Keypair Details page displays status information and additional feature information, and consists of Details, Tags, Operation History tabs.

Detailed Information

On the Keypair list page, you can check the detailed information of the selected resource and modify the information if necessary.

ClassificationDetailed Description
ServiceService Name
Resource TypeResource Type
SRNUnique resource ID in Samsung Cloud Platform
  • For Keypair, it means Keypair SRN
Resource NameKeypair Name
Resource IDKeypair’s unique resource ID
CreatorUser who created the Keypair
Creation TimeTime when Keypair was created
ModifierUser who modified Keypair information
Modified TimeTime when Keypair information was modified
Keypair nameKeypair name
FingerprintA unique value to identify the Key
User IDKeypair creation user ID
Public KeyPublic Key Information
Table. Keypair detailed information tab items

Tag

On the Keypair List page, you can check the tag information of the selected resource, and add, change, or delete it.

ClassificationDetailed Description
Tag ListTag list
  • Tag Key, Value information can be checked
  • Up to 50 tags can be added per resource
  • When entering a tag, search and select from the existing Key and Value list
Table. Keypair tags tab items

Work History

Keypair list page where you can check the operation history of the selected resource.

ClassificationDetailed Description
Work history listResource change history
  • Check work time, resource ID, resource name, work details, event topic, work result, and worker information
Fig. Keypair job history tab detailed information items

Managing Keypair Resources

Describes the control and management functions of the Keypair.

Get Public Key

To import a public key, follow these steps.

  1. Click All services > Compute > Virtual Server menu. It moves to the Service Home page of Virtual Server.

  2. Service Home page, click the Keypair menu. It moves to the Keypair list page.

  3. On the Keypair list page, click the More button at the top and then click the Import Public Key button. This will move to the Import Public Key page.

    • Required Information Input Enter or select the necessary information in the required information input area.
      Classification
      Necessity
      Detailed Description
      Keypair nameRequiredName of Keypair to be created
      Keypair typerequiredssh
      Public KeyRequiredPublic Key Input
      • File Upload: File Attach button to attach public key file
        • Attached file only allows .pem file extension
      • Public Key Input: Paste the copied public key value
        • Public key value can be copied from Keypair Details page
      Table. Essential Input Items for Public Key Import
  4. Check the entered information and click the Complete button.

    • Once creation is complete, check the created resource on the Keypair list page.

Delete Keypair

You can delete unused Keypairs. However, since deleted Keypairs cannot be recovered, please proceed with deletion after reviewing the impact in advance.

Caution
Please be careful after deleting the service, as the data cannot be recovered.

To delete a key pair, follow these steps.

  1. All services > Compute > Virtual Server menu, click. Move to the Service Home page of Virtual Server.
  2. On the Service Home page, click the Keypair menu. It moves to the Keypair list page.
  3. Keypair list page, select the resource to be deleted, and click the Delete button. On the * Keypair list page, select multiple Keypair check boxes and click the Delete button at the top of the resource list.
  4. After deletion is complete, check the Keypair list page to see if the resource has been deleted.

3 - Server Group

Users can enter the required information for a Server Group within the Virtual Server service and select detailed options through the Samsung Cloud Platform Console to create the service.

Server Group Create

You can create and use the Server Group service while using the Virtual Server service in the Samsung Cloud Platform Console.

To create a Server Group, follow the steps below.

  1. Click the All Services > Compute > Virtual Server menu. Go to the Service Home page of Virtual Server.
  2. Click the Server Group menu on the Server Group page. Go to the Server Group list page.
  3. Server Group List on the page, click the Server Group Create button. Navigate to the Server Group Create page.
    • Service Information Input area, enter or select the required information.
      Category
      Required
      Detailed description
      Server Group nameRequiredName of the Server Group to create
      • Enter within 255 characters using English letters, numbers, spaces, and special characters (-, _)
      PolicyRequiredSet Anti-Affinity (distributed placement), Affinity (proximate placement), Partition (distributed placement of Virtual Server and Block Storage) for Virtual Servers belonging to the same Server Group
      • Anti-Affinity (distributed placement) and Affinity (proximate placement) policies place Virtual Servers belonging to the same Server Group based on the selected policy in a Best Effort manner, but are not absolutely guaranteed.
      • Anti-Affinity (distributed placement): A policy that places servers belonging to a Server Group on different racks and hosts as much as possible
      • Affinity (proximate placement): A policy that places servers belonging to a Server Group close together within the same rack and host as much as possible
      • Partition (distributed placement of Virtual Server and Block Storage): A policy that places Virtual Servers belonging to a Server Group and the Block Storage connected to those servers in different distribution units (Partitions)
        • The Partition (distributed placement of Virtual Server and Block Storage) policy displays the Partition number together so that it is clear which Partition each Virtual Server and its associated Block Storage belong to.
        • Partition numbers are assigned based on the Partition Size (up to 3) set for the Server Group.
      Table. Server Group Service Information Input Items
    • Add Information Input area, enter or select the required information.
      Category
      Required
      Detailed description
      TagSelectAdd Tag
      • Up to 50 can be added per resource
      • After clicking the Add Tag button, enter or select Key, Value values
      Table. Server Group Additional Information Input Items
  4. Check the input information and click the Complete button.
    • When creation is complete, check the created resources on the Server Group List page.

Server Group View detailed information

Server Group service can view and edit the full resource list and detailed information. Server Group Details page consists of Details, Tags, Activity Log tabs.

To view detailed information of the Server Group, follow the steps below.

  1. Click the All Services > Compute > Virtual Server menu. Go to the Service Home page of Virtual Server.
  2. Click the Server Group menu on the Service Home page. You will be taken to the Server Group List page.
  3. Click the resource to view detailed information on the Server Group List page. It navigates to the Server Group Details page.
    • Server Group Details page displays status information and additional feature information, and consists of Details, Tags, Activity History tabs.

Detailed Information

On the Server Group List page, you can view detailed information of the selected resource and, if necessary, edit the information.

CategoryDetailed description
ServiceService Name
Resource TypeResource Type
SRNUnique resource ID in Samsung Cloud Platform
  • In Server Group, it means Server Group SRN
Resource NameServer Group Name
Resource IDUnique resource ID of Server Group
CreatorUser who created the Server Group
Creation timeServer Group creation time
Server Group nameServer Group name
PolicyAnti-Affinity(distributed placement), Affinity(proximal placement), Partition(distributed placement of Virtual Server and Block Storage)
Server Group MemberList of Virtual Servers belonging to the Server Group
  • Members cannot be modified after the initial Virtual Server is created
  • Anti-Affinity (distributed placement) and Affinity (proximate placement) policies define only the relative placement relationships between Virtual Servers, and the SCP Console provides only the list of Virtual Servers belonging to the policy.
  • The Partition (distributed placement of Virtual Server and Block Storage) policy displays the Partition number together to clearly indicate which Partition the Virtual Server and its associated Block Storage belong to. The Partition number is assigned based on the Partition Size set for the Server Group (maximum 3).
Table. Server Group detailed information tab items

Tag

Server Group List page you can view the tag information of the selected resource, and you can add, modify, or delete it.

CategoryDetailed description
Tag ListTag List
  • Can view the tag’s Key and Value information
  • Up to 50 tags can be added per resource
  • When entering tags, search and select from the previously created Key and Value list
Table. Server Group Tag Tab Items

Work History

You can view the operation history of the selected resource on the Server Group List page.

CategoryDetailed description
Work History ListResource Change History
  • Work date/time, Resource ID, Resource name, Work details, Event topic, Work result, Check worker information
Table. Server Group Task History Tab Detailed Information Items

Server Group Delete

You can delete unused Server Groups. However, once a Server Group is deleted it cannot be recovered, so please review the impact thoroughly in advance before proceeding with deletion.

Caution
Please be careful as data cannot be recovered after deleting the service.

To delete a Server Group, follow these steps.

  1. All Services > Compute > Virtual Server menu, click it. Go to the Virtual Server’s Service Home page.
  2. On the Service Home page, click the Server Group menu. Navigate to the Server Group List page.
  3. Server Group list On the page, select the resource to delete, and click the Delete button.
    • Server Group list on the page select multiple Server Group check boxes, and click the Delete button at the top of the resource list.
  4. When deletion is complete, check whether the resource has been deleted on the Server Group list page.

4 - IP Change

You can change the IP of the Virtual Server and add network ports to the Virtual Server to set the IP.

IP Change

You can change the IP of the Virtual Server.

Caution
  • If you proceed with changing the IP, you will no longer be able to communicate with that IP, and you cannot cancel the IP change while it is in progress.
  • The server will be rebooted to apply the changed IP.
  • If the server is running the Load Balancer service, you must delete the existing IP from the LB server group and directly add the changed IP as a member of the LB server group.
  • Servers using Public NAT/Private NAT must disable and reconfigure Public NAT/Private NAT after changing the IP.
    • If you are using Public NAT/Private NAT, first disable the use of Public NAT/Private NAT, complete the IP change, and then set it again.
  • Whether to use Public NAT/Private NAT can be changed by clicking the Edit button of Public NAT IP/Private NAT IP on the Virtual Server Details page.

To change the IP, follow the steps below.

  1. All Services > Compute > Virtual Server Click the menu. Navigate to the Service Home page of Virtual Server.
  2. Click the Virtual Server menu on the Service Home page. Move to the Virtual Server List page.
  3. Virtual Server List Click the resource to change the IP on the page. Navigate to the Virtual Server Details page.
  4. Virtual Server Details page, click the Edit button of the IP item to change the IP. The IP Edit popup opens.
  5. Edit IP In the popup window, after selecting Subnet, set the IP to change.
    • Input: Enter the IP to be changed directly.
    • Automatic Generation: Automatically generate the IP and apply it.
  6. When the settings are complete, click the Confirm button.
  7. When the popup notifying IP modification opens, click the Confirm button.

Setting IP on the server after adding network ports

If you create a Virtual Server with Ubuntu Linux, after adding a network port on Samsung Cloud Platform, additional IP configuration is required on the server.

  1. As the root user of the Virtual Server’s OS, use the ip command to check the assigned network interface name.

    Color mode
    ip a
    ip a
    Code block. ip command - network interface check command

    • If there is an added interface, the following result is displayed.
    Color mode
    [root@scp-test-vm-01 ~] # ip a
    3: ens7: <BROADCAST,MULTICAST> mtu 9000 qdisc noop state DOWN group default qlen 1000
        link/ether fa:16:3e:98:b6:64 brd ff:ff:ff:ff:ff:ff
        altname enp0s7
    [root@scp-test-vm-01 ~] # ip a
    3: ens7: <BROADCAST,MULTICAST> mtu 9000 qdisc noop state DOWN group default qlen 1000
        link/ether fa:16:3e:98:b6:64 brd ff:ff:ff:ff:ff:ff
        altname enp0s7
    Code block. ip command - Network interface check result
  2. Use a text editor (e.g., vim) to open the /etc/netplan/50-cloud-init.yaml file.

  3. Add the following content to the /etc/netplan/50-cloud-init.yaml file and save it.

    Color mode
    network:
      version: 2
      ethernets:
        ens7:
          match:
            macaddress: "fa:16:3e:98:b6:64"
          dhcp4: true
          set-name: "ens7"
          mtu: 9000
    network:
      version: 2
      ethernets:
        ens7:
          match:
            macaddress: "fa:16:3e:98:b6:64"
          dhcp4: true
          set-name: "ens7"
          mtu: 9000
    Code block. Edit YAML file
Reference
Indentation is important in YAML files that configure netplan. When modifying a YAML file, please refer to the existing settings and be careful.
  1. Set the IP on the added network DEVICE using the netplan command.

    Color mode
    netplan --debug apply
    netplan --debug apply
    Code block. netplan applied
  2. Use the ip command to verify that the IP is set correctly.

    Color mode
    [root@scp-test-vm-01 ~] # ip a
    3: ens7: <BROADCAST,MULTICAST> mtu 9000 qdisc noop state DOWN group default qlen 1000
        link/ether fa:16:3e:98:b6:64 brd ff:ff:ff:ff:ff:ff
        altname enp0s7
        inet 10.10.10.10/24 metric 100 brd 10.10.10.255 scope global dynamic ens7
           valid_lft 43197sec preferred_lft 43197sec
        inet6 fe80::f816:3eff:fe0a:96bf/64 scope link
           valid_lft forever preferred_lft forever
    Code block. Check IP settings

5 - Linux NTP Setting

If a user creates a Virtual Server with Rocky Linux or Oracle Linux via the Samsung Cloud Platform Console, additional configuration is required for time synchronization (NTP: Network Time Protocol). For other OS standard Linux images (RHEL, Alma Linux, Ubuntu), NTP is already configured, so no additional setup is needed.

Install NTP Daemon

You can install the chrony daemon to configure NTP. To install the chrony daemon, follow the steps below.

Reference
For detailed information about chrony, please refer to the chronyc page.
  1. Check whether the chrony package is installed using the dnf command as the root user of the OS of the Virtual Server.

    Color mode
    dnf list chrony
    dnf list chrony
    Code block. dnf command - chrony package installation verification command

    • chrony If the chrony package is installed, the following result is displayed.
    Color mode
    [root@scp-test-vm-01 ~] # dnf list chrony
    Last metadata expiration check: 1:47:29 ago on Wed 19 Feb 2025 05:55:57 PM KST.
    Installed Packages
    chrony.x86_64                              3.5-1.0.1.el8                                              @anaconda  
    [root@scp-test-vm-01 ~] # dnf list chrony
    Last metadata expiration check: 1:47:29 ago on Wed 19 Feb 2025 05:55:57 PM KST.
    Installed Packages
    chrony.x86_64                              3.5-1.0.1.el8                                              @anaconda  
    Code block. dnf command - chrony package installation verification result
  2. If the chrony package is not installed, use the dnf command to install the chrony package.

    Color mode
    dnf install chrony -y
    dnf install chrony -y
    Code block. dnf command - chrony package installation verification command

NTP Daemon Setup

Reference
For detailed information about chrony, refer to the chronyc page.

To set up the chrony daemon, follow these steps.

  1. Load the /etc/chrony.conf file using a text editor (e.g., vim).

  2. Add the following content to the /etc/chrony.conf file and save.

    Color mode
    server 198.19.0.54 iburst
    server 198.19.0.54 iburst
    Code block. /etc/chrony.conf edit
  3. Set it to automatically start the chrony daemon using the systemctl command.

    Color mode
    systemctl enable chronyd
    systemctl enable chronyd
    Code block. systemctl command - chrony daemon auto start setting
  4. Restart the chrony daemon using the systemctl command.

    Color mode
    systemctl restart chronyd
    systemctl restart chronyd
    Code block. systemctl command - restart chrony daemon

  5. Run the chronyc sources command with the “v” option (display detailed information) to check the IP address of the configured NTP server and verify whether synchronization is in progress.

    Color mode
    chronyc sources -v
    chronyc sources -v
    Code block. chronyc sources command - NTP synchronization check

    • When you run the chronyc sources command, the following result is displayed.
    Color mode
    [root@scp-test-vm-01 ~] # chronyc sources -v
    
    210 Number of sources = 1


      .-- Source mode   '^' = server,   '=' = peer,   '#' = local clock.
    
     / .- Source state     '*' = current synced,   '+' = combined ,   '-' = not combined,
    
    | /    '?' = unreachable,   'x' = time may be in error,   '~' = time too variable.
    
    ||                                                                                   .- xxxx [ yyyy ] +/- zzzz
    
    ||                      Reachability register (octal) -.                        |  xxxx = adjusted offset,
    
    ||                      Log2(Polling interval) --.          |                    |  yyyy = measured offset,
    
    ||                                                             |                   |  zzzz = estimated error.
    
    ||                                                        |       |                   
    
    MS Name/IP address                  Stratum   Poll   Reach   LastRx   Last    sample              
    
    =========================================================================
    
    
    ^* 198.19.0.54                                 2      6     377      52      -129us[  -128us] +/-     14ms
    Code block. chronyc sources command - NTP synchronization check
  6. Run the chronyc tracking command to check the synchronization metrics.

    Color mode
    [root@scp-test-vm-01 ~] # chronyc tracking
    Reference ID        : A9FEA9FE (198.19.0.54)
    Stratum              : 3
    Ref time  (UTC)     : Wed  Feb  19  18:48:41  2025
    System time         : 0.000000039 seconds fast of NTP time
    Last offset            : -0.000084246 seconds
    RMS offset           : 0.000084246 seconds
    Frequency            : 21.667 ppm slow
    Residual freq        : +4.723 ppm
    Skew                  : 0.410 ppm
    Root delay           : 0.000564836 seconds
    Root dispersion     : 0.027399288 seconds
    Update interval      : 2.0 seconds
    Leap status           : Normal
    Code block. chronyc tracking command - NTP synchronization metric

6 - Setting up RHEL Repo and WKMS

Notice
  • If the user created RHEL and Windows Server prior to August 2025 via the Samsung Cloud Platform Console, they need to modify the RHEL Repository and WKMS (Windows Key Management Service) settings.
  • The SCP RHEL Repository is a repository provided by SCP to support user environments such as VPC Private Subnet where external access is restricted.
    Since the SCP RHEL Repository synchronizes with each Region Local Repository according to the internal schedule, it is recommended to switch to an external Public Mirror site to quickly apply the latest patches.

RHEL Repository Configuration Guide

In Samsung Cloud Platform, when using RHEL, you can install and download the same packages as the official RHEL Repository by utilizing the RHEL Repository provided by SCP.
SCP provides the latest version of the repository for the given major version by default. To set up the RHEL repository, follow the steps below.

  1. Using the root user of the Virtual Server’s OS, use the cat command to check the /etc/yum.repos.d/scp.rhel8.repo or /etc/yum.repos.d/scp.rhel9.repo settings.

    Color mode
    cat /etc/yum.repos.d/scp.rhel8.repo
    cat /etc/yum.repos.d/scp.rhel8.repo
    Code block. repo configuration check (RHEL8)
    Color mode
    cat /etc/yum.repos.d/scp.rhel9.repo
    cat /etc/yum.repos.d/scp.rhel9.repo
    Code block. repo configuration check (RHEL9)

    • When checking the configuration file, the following result is displayed.
      Color mode
      [rhel-8-baseos]
      name=rhel-8-baseos
      gpgcheck=0
      enabled=1
      baseurl=http://scp-rhel8-ip/rhel/8/baseos
      [rhel-8-baseos-debug]
      name=rhel-8-baseos-debug
      gpgcheck=0
      enabled=1
      baseurl=http://scp-rhel8-ip/rhel/8/baseos-debug
      [rhel-8-appstream]
      name=rhel-8-appstream
      gpgcheck=0
      enabled=1
      baseurl=http://scp-rhel8-ip/rhel/8/appstream
      Code block. Check repo settings (RHEL8)
      Color mode
      [rhel-9-for-x86_64-baseos-rpms]
      name=rhel-9-for-x86_64-baseos-rpms
      baseurl=http://scp-rhel9-ip/rhel/$releasever/x86_64/baseos
      gpgcheck=0
      enabled=1
      [rhel-9-for-x86_64-appstream-rpms]
      name=rhel-9-for-x86_64-appstream-rpms
      baseurl=http://scp-rhel9-ip/rhel/$releasever/x86_64/appstream
      gpgcheck=0
      enabled=1
      [codeready-builder-for-rhel-9-x86_64-rpms]
      name=codeready-builder-for-rhel-9-x86_64-rpms
      baseurl=http://scp-rhel9-ip/rhel/$releasever/x86_64/codeready-builder
      gpgcheck=0
      enabled=1
      [rhel-9-for-x86_64-highavailability-rpms]
      name=rhel-9-for-x86_64-highavailability-rpms
      baseurl=http://scp-rhel9-ip/rhel/$releasever/x86_64/ha
      gpgcheck=0
      enabled=1
      [rhel-9-for-x86_64-supplementary-rpms]
      name=rhel-9-for-x86_64-supplementary-rpms
      baseurl=http://scp-rhel9-ip/rhel/$releasever/x86_64/supplementary
      gpgcheck=0
      enabled=1
      Code block. Check repo settings (RHEL9)
  2. Use a text editor (e.g., vim) to open the /etc/hosts file.

  3. /etc/hosts Modify the file with the content below and save.

    Color mode
    198.19.2.13 scp-rhel8-ip scp-rhel9-ip scp-rhel-ip
    198.19.2.13 scp-rhel8-ip scp-rhel9-ip scp-rhel-ip
    Code block. /etc/hosts file setting change

  4. Verify the RHEL Repository connection configured on the server using the yum command.

    Color mode
    yum repolist –v
    yum repolist –v
    Code block. repository connection settings check

    • If the RHEL Repository is successfully connected, you can check the Repository list.
      Color mode
      Repo-id            : rhel-8-appstream
      Repo-name          : rhel-8-appstream
      Repo-revision      : 1718903734
      Repo-updated       : Fri 21 Jun 2024 02:15:34 AM KST
      Repo-pkgs          : 38,260
      Repo-available-pkgs: 25,799
      Repo-size          : 122 G
      Repo-baseurl       : http://scp-rhel8-ip/rhel/8/appstream
      Repo-expire        : 172,800 second(s) (last: Thu 08 Aug 2024 07:27:57 AM KST)
      Repo-filename      : /etc/yum.repos.d/scp.rhel8.repo
      
      Repo-id            : rhel-8-baseos
      Repo-name          : rhel-8-baseos
      Repo-revision      : 1718029433
      Repo-updated       : Mon 10 Jun 2024 11:23:52 PM KST
      Repo-pkgs          : 17,487
      Repo-available-pkgs: 17,487
      Repo-size          : 32 G
      Repo-baseurl       : http://scp-rhel8-ip/rhel/8/baseos
      Repo-expire        : 172,800 second(s) (last: Thu 08 Aug 2024 07:27:57 AM KST)
      Repo-filename      : /etc/yum.repos.d/scp.rhel8.repo
      
      Repo-id            : rhel-8-baseos-debug
      Repo-name          : rhel-8-baseos-debug
      Repo-revision      : 1717662461
      Repo-updated       : Thu 06 Jun 2024 05:27:41 PM KST
      Repo-pkgs          : 17,078
      Repo-available-pkgs: 17,078
      Repo-size          : 100 G
      Repo-baseurl       : http://scp-rhel8-ip/rhel/8/baseos-debug
      Repo-expire        : 172,800 second(s) (last: Thu 08 Aug 2024 07:27:57 AM KST)
      Repo-filename      : /etc/yum.repos.d/scp.rhel8.repo
      Code block. Repository list check

Windows Key Management Service Configuration Guide

In Samsung Cloud Platform, when using Windows Server, you can authenticate genuine products by using the Key Management Service provided by SCP. Follow the steps below.

  1. After right-clicking the Windows Start icon, please run cmd from Windows PowerShell (Administrator) or the Windows Run menu.

  2. Windows PowerShell (administrator) or in cmd, please run the command below to register the KMS Server.

    Color mode
    slmgr /skms 198.19.2.23:1688
    slmgr /skms 198.19.2.23:1688
    Code block. WKMS Settings

  3. After executing the KMS Server registration command, check the notification popup indicating successful registration, then click OK.

    Figure
    Figure. WKMS setting check
  4. Windows PowerShell (Administrator) or in cmd, please execute the command below to perform product activation.

    Color mode
    slmgr /ato
    slmgr /ato
    Code block. Windows Server activation settings

  5. After confirming the notification popup that the product activation was successful, click OK.

    Figure
    Figure. Windows Server genuine activation verification
  6. Windows PowerShell (Administrator) or cmd, run the command below to check if it has been activated.

    Color mode
    slmgr /dlv
    slmgr /dlv
    Code block. Windows Server genuine activation verification

  7. After confirming the notification popup that the product activation was successfully performed, click OK.

    Figure
    Figure. Windows Server genuine activation verification

7 - ServiceWatch Agent Installation

Users can install the ServiceWatch Agent on a Virtual Server to collect custom metrics and logs.

Reference
Collecting custom metrics/logs via the ServiceWatch Agent is currently only available on Samsung Cloud Platform For Enterprise. It will be offered in other offerings in the future.
Caution
Metric collection via ServiceWatch Agent is classified as custom metrics and, unlike the metrics collected by default from each service, incurs charges, so it is recommended to remove or disable unnecessary metric collection settings.

ServiceWatch Agent

The agents that need to be installed on the Virtual Server for collecting ServiceWatch’s custom metrics and logs can be divided into two main types. It is Prometheus Exporter and Open Telemetry Collector.

CategoryDetailed Description
Prometheus ExporterProvides metrics of a specific application or service in a format that Prometheus can scrape
  • Depending on the OS, you can use Node Exporter for Linux servers and Windows Exporter for Windows servers
Open Telemetry CollectorCollects telemetry data such as metrics and logs from distributed systems, processes (filtering, sampling, etc.) them, and serves as a centralized collector that exports to various backends (e.g., Prometheus, Jaeger, Elasticsearch, etc.)
  • Exports data to ServiceWatch Gateway so that ServiceWatch can collect metric and log data.
Table. Explanation of Prometheus Exporter and Open Telemetry Collector

Installation of Prometheus Exporter for Virtual Server (for Linux)

Install the Prometheus Exporter according to the steps below for use on a Linux server.

Node Exporter Installation

Install Node Exporter according to the following steps.

  1. Node Exporter User Creation
  2. Node Exporter Settings

Node Exporter User Creation

Create a dedicated user to safely isolate the Node Exporter process.

Color mode
sudo useradd --no-create-home --shell /bin/false node_exporter
Code block. Node Exporter User creation command

Node Exporter Settings

  1. Download to install Node Exporter. This guide provides the version below.
    • Download path: /tmp
    • Installation version: 1.7.0
      Color mode
      cd /tmp
      wget https://github.com/prometheus/node_exporter/releases/download/v1.7.0/node_exporter-1.7.0.linux-amd64.tar.gz
      cd /tmp
      wget https://github.com/prometheus/node_exporter/releases/download/v1.7.0/node_exporter-1.7.0.linux-amd64.tar.gz
      Code block. Node Exporter download command
Reference
The latest version of Node Exporter can be found at Node Exporter > Releases > Lastest, and a specific version of Node Exporter can be found at Node Exporter > Releases.
  1. Install the downloaded Node Exporter and grant permission to the executable file.

    Color mode
    cd /tmp
    sudo tar -xvf node_exporter-1.7.0.linux-amd64.tar.gz -C /usr/local/bin --strip-components=1 node_exporter-1.7.0.linux-amd64/node_exporter
    cd /tmp
    sudo tar -xvf node_exporter-1.7.0.linux-amd64.tar.gz -C /usr/local/bin --strip-components=1 node_exporter-1.7.0.linux-amd64/node_exporter
    Code block. Node Exporter installation command
    Color mode
    sudo chown node_exporter:node_exporter /usr/local/bin/node_exporter
    sudo chown node_exporter:node_exporter /usr/local/bin/node_exporter
    Code block. Node Exporter permission setting command

  2. Service file creation Set Node Exporter to collect memory metrics (meminfo) or block storage metrics (filesystem).

    Color mode
    sudo vi /etc/systemd/system/node_exporter.service
    sudo vi /etc/systemd/system/node_exporter.service
    Code block. Node Exporter service file opening command
    Color mode
    [Unit]
    Description=Prometheus Node Exporter (meminfo only)
    Wants=network-online.target
    After=network-online.target
      
    [Service]
    User=node_exporter
    Group=node_exporter
    Type=simple
    ExecStart=/usr/local/bin/node_exporter \
      --collector.disable-defaults \    # Disable default metrics
      --collector.meminfo \             # Enable memory metrics
      --collector.filesystem            # Block Storage Enable filesystem metrics
      
    Restart=on-failure
      
    [Install]
    WantedBy=multi-user.target
    Code block. Node Exporter service file open result

Reference
  • collector can be enabled/disabled using flags.

    • –collector.{name}: Used to enable a specific metric.
    • –no-collector.{name}: You can disable specific metrics.
    • To disable all default metrics and enable only specific collectors, you can use –collector.disable-defaults –collector.{name} ….
  • Below is the description of the main collector.

CollectorDescriptionLabel
meminfoProvides memory statistics-
filesystemProvides file system statistics such as used disk space
  • device: Physical or virtual device path where the file system is located
    • Example: /dev/sda1
  • fstype: File system type
    • Example: ext4, xfs, nfs, tmpfs
  • mountpoint: The path where the file system is mounted on the host OS. The most intuitive basis for distinguishing disks
    • Example: /, /var/lib/docker, /mnt/data
Table. Node Exporter Main Collector Description
  • Node Exporter Metrics you can check the main metrics provided by Node Exporter and how to configure the Node Exporter Collector.
Reference
  • Detailed information about collectable metrics and how to configure them can be found at Node Exporter > Collector.
  • The available metrics may vary depending on the version of Node Exporter you are using. Refer to Node Exporter.
Caution
Since metric collection via ServiceWatch Agent is classified as custom metrics and incurs charges unlike the default collected metrics, unnecessary metric collection must be removed or disabled to avoid excessive charges.
  1. Service activation and start Register the Node Exporter service and check the registered service and configured metrics.
    Color mode
    sudo systemctl daemon-reload
    sudo systemctl enable --now node_exporter
    sudo systemctl daemon-reload
    sudo systemctl enable --now node_exporter
    Code block. Node Exporter service activation and start command
    Color mode
    sudo systemctl status node_exporter
    sudo systemctl status node_exporter
    Code block. Node Exporter service check command
    Color mode
    curl http://localhost:9100/metrics | grep node_memory
    curl http://localhost:9100/metrics | grep node_memory
    Code block. Node Exporter metric information check command
Notice
If you have completed the Node Exporter setup, you need to install the Open Telemetry Collector provided by ServiceWatch to complete the ServiceWatch Agent configuration.
For more details, see ServiceWatch > Using ServiceWatch Agent.

Installation of Prometheus Exporter for Virtual Server (for Windows)

Install according to the steps below to use Prometheus Exporter on a Windows server.

Windows Exporter Installation

Install the Windows Exporter according to the steps below.

  1. Windows Exporter Settings

Windows Exporter Settings

  1. Download the installation file to install Windows Exporter.
    • Download path: C:\Temp
    • Test version: 0.31.3
      Color mode
      $ mkdir /Temp
      $ Invoke-WebRequest -Uri "https://github.com/prometheus-community/windows_exporter/releases/download/v0.31.3/windows_exporter-0.31.3-amd64.exe" -OutFile "C:\Temp\windows_exporter-0.31.3-amd64.exe"
      $ mkdir /Temp
      $ Invoke-WebRequest -Uri "https://github.com/prometheus-community/windows_exporter/releases/download/v0.31.3/windows_exporter-0.31.3-amd64.exe" -OutFile "C:\Temp\windows_exporter-0.31.3-amd64.exe"
      Code block. Windows Exporter download
Reference
You can check the Windows Exporter version and installation files at Windows Exporter > Releases.
  1. Windows Exporter execution test
    Windows Exporter enables all collectors by default, but to collect only the metrics you want, you need to enable the following collectors. Below is an example of enabling user-specified collectors.
    • Memory Metric: memory
    • Block Storage Metric: local_disk
    • Host name: os
      Color mode
      $ cd C:\Temp
      $ .\windows_exporter-0.31.3-amd64.exe --collectors.enabled memory,logical_disk,os
      $ cd C:\Temp
      $ .\windows_exporter-0.31.3-amd64.exe --collectors.enabled memory,logical_disk,os
      Code block. Windows Exporter execution test
Reference
  • collector can be enabled using a flag.

    • –collectors.enabled “[defaults]" metrics provided by default
    • –collector.enabled {name},{name},{name}…: Used to enable specific metrics.
  • Below is the description of the main collector.

CollectorDescriptionLabel
memoryMemory Statistics Provided
logical_diskCollect performance and health metrics of logical disks (e.g., C:, D: drives) on the local system
  • volume: Physical or virtual device path where the filesystem resides
    • Example: C:D:
Table. Windows Exporter Main Collector Description
  • Windows Exporter Metrics you can check the main metrics provided by Windows Exporter and how to configure the Windows Exporter Collector.
Reference
  • For detailed information on collectable metrics and how to configure them, see Windows Exporter > Collector.

  • The metrics that can be provided may differ depending on the version of the Windows Exporter you are using. Please refer to the Windows Exporter.

Caution
Since metric collection via ServiceWatch Agent is classified as custom metrics and incurs charges unlike the default collected metrics, unnecessary metric collection must be removed or disabled to avoid excessive charges.
  1. Service Registration and Confirmation Register the Windows Exporter service and check the configured metrics.

    Color mode
    $ sc.exe create windows_exporter binPath= "C:\Temp\windows_exporter-0.31.3-amd64.exe --collectors.enabled memory,logical_disk,os" DisplayName= "Prometheus Windows Exporter" start= auto
    $ Start-Service windows_exporter
    $ sc.exe create windows_exporter binPath= "C:\Temp\windows_exporter-0.31.3-amd64.exe --collectors.enabled memory,logical_disk,os" DisplayName= "Prometheus Windows Exporter" start= auto
    $ Start-Service windows_exporter
    Code block. Windows Exporter service registration
    Color mode
    # Service Check
    $ Get-Service windows_exporter
      
    # Metric Check
    $ Invoke-WebRequest -Uri "http://localhost:9182/metrics" | Select-String memory
    # Service Check
    $ Get-Service windows_exporter
      
    # Metric Check
    $ Invoke-WebRequest -Uri "http://localhost:9182/metrics" | Select-String memory
    Code block. Windows Exporter service check

  2. Configuration File Settings

    • You can set it to use a YAML configuration file using the –config.file option.
      Color mode
      $ .\windows_exporter.exe --config.file=config.yml
      $ .\windows_exporter.exe --config.file="C:\Program Files\windows_exporter\config.yml" # If you use an absolute path, you must enclose the path in quotes.
      $ .\windows_exporter.exe --config.file=config.yml
      $ .\windows_exporter.exe --config.file="C:\Program Files\windows_exporter\config.yml" # If you use an absolute path, you must enclose the path in quotes.
      Code block. Windows Exporter configuration file settings
      Color mode
      collectors:
        enabled: cpu,net,service
      collector:
        service:
          include: windows_exporter
      log:
        level: warn
      collectors:
        enabled: cpu,net,service
      collector:
        service:
          include: windows_exporter
      log:
        level: warn
      Code block. Windows Exporter configuration file example snippet
  • Windows Exporter > official example configuration file please refer.
    Color mode
    ---
    # Note this is not an exhaustive list of all configuration values
    collectors:
      enabled: cpu,logical_disk,net,os,service,system
    collector:
      service:
        include: "windows_exporter"
      scheduled_task:
        include: /Microsoft/.+
    log:
      level: debug
    scrape:
      timeout-margin: 0.5
    telemetry:
      path: /metrics
    web:
      listen-address: ":9182"
    Code block. Windows Exporter configuration file example
    • Refer to the below to register a service using a configuration file.
      Color mode
      $ sc.exe create windows_exporter binPath= "C:\Temp\windows_exporter-0.31.3-amd64.exe --config.file=C:\Temp\config.yml" DisplayName= "Prometheus Windows Exporter" start= auto
      $ Start-Service windows_exporter
      $ sc.exe create windows_exporter binPath= "C:\Temp\windows_exporter-0.31.3-amd64.exe --config.file=C:\Temp\config.yml" DisplayName= "Prometheus Windows Exporter" start= auto
      $ Start-Service windows_exporter
      Code block. Service registration using Windows Exporter configuration file
Reference
When using configuration files and command-line options together, the values included in the command-line options take precedence. Therefore, command-line options override the configuration file settings.
Notice
If you have completed the Node Exporter setup, you need to install the Open Telemetry Collector provided by ServiceWatch to complete the ServiceWatch Agent configuration.
For more details, see ServiceWatch > Using ServiceWatch Agent.

Node Exporter metrics

Node Exporter Main Metrics

Below is the collector and metric information that can be checked through Node Exporter. You can set it as a Collector, or you can enable only specific metrics.

CategoryCollectorMetricDescription
Memorymeminfonode_memory_MemTotal_bytesTotal memory
Memorymeminfonode_memory_MemAvailable_bytesAvailable memory (used to determine memory shortage)
Memorymeminfonode_memory_MemFree_bytesFree memory (empty memory)
Memorymeminfonode_memory_Buffers_bytesIO buffer
Memorymeminfonode_memory_Cached_bytespage cache
Memorymeminfonode_memory_SwapTotal_bytestotal swap
Memorymeminfonode_memory_SwapFree_bytesRemaining swap
Filesystemfilesystemnode_filesystem_size_bytestotal filesystem size
Filesystemfilesystemnode_filesystem_free_bytestotal free space
Filesystemfilesystemnode_filesystem_avail_bytesSpace actually available to the user (available space for unprivileged users)
Table. Node Exporter Key Metrics

Node Exporter Collector and metric collection settings

Node Exporter enables most collectors by default, but you can enable/disable only the collectors you want.

Activate only specific Collector

  • When you only want to use the memory and file system collectors:
    Color mode
    ./node_exporter
      --collector.meminfo            # Memory Collector activation
      --collector.filesystem         # File system Collector activation
    ./node_exporter
      --collector.meminfo            # Memory Collector activation
      --collector.filesystem         # File system Collector activation
    Code block. Enable specific Collector of Node Exporter
  • When you want to disable all Default settings and use only the memory and file system Collectors:
    Color mode
    ./node_exporter
      --collector.disable-defaults    # Disable default metrics
      --collector.meminfo             # Memory Collector activation
      --collector.filesystem          # File system Collector activation
    ./node_exporter
      --collector.disable-defaults    # Disable default metrics
      --collector.meminfo             # Memory Collector activation
      --collector.filesystem          # File system Collector activation
    Code block. Enable specific Collector of Node Exporter
  • Enable file system Collector for a specific mount point
    Color mode
    ./node_exporter
      --collector.disable-defaults    # disable default metrics
      --collector.filesystem.mount-points-include="/|/data"          # Activate file system Collector for /(Root) and /data mount points
    ./node_exporter
      --collector.disable-defaults    # disable default metrics
      --collector.filesystem.mount-points-include="/|/data"          # Activate file system Collector for /(Root) and /data mount points
    Code block. Enable specific Collector of Node Exporter
  • Enable file system Collector excluding specific mount points
    Color mode
    ./node_exporter
      --collector.disable-defaults    # disable default metrics
      --collector.filesystem.mount-points-exclude="/boot|/var/log"    # Enable file system Collector for /boot and /var/log mount points
    ./node_exporter
      --collector.disable-defaults    # disable default metrics
      --collector.filesystem.mount-points-exclude="/boot|/var/log"    # Enable file system Collector for /boot and /var/log mount points
    Code block. Enable specific Collector of Node Exporter

Disable specific Collector (no-collector)

When you don’t want to use the file system collector:

Color mode
./node_exporter --no-collector.filesystem
Code block. Node Exporter specific collector deactivation
Color mode
[Unit]
Description=Node Exporter
After=network-online.target

[Service]
User=nodeexp
ExecStart=/usr/local/bin/node_exporter
  --collector.disable-defaults # Disable all default metric collectors
  --collector.meminfo
  --collector.filesystem

[Install]
WantedBy=multi-user.target
[Unit]
Description=Node Exporter
After=network-online.target

[Service]
User=nodeexp
ExecStart=/usr/local/bin/node_exporter
  --collector.disable-defaults # Disable all default metric collectors
  --collector.meminfo
  --collector.filesystem

[Install]
WantedBy=multi-user.target
Code block. Node Exporter > /etc/systemd/system/node_exporter.service configuration

How to filter only specific metrics

Through the Open Telemetry Collector configuration, you can set it to collect only the necessary metrics gathered from the Node Exporter. When you want to collect only specific metrics among those provided by a particular collector of Node Exporter, you can refer to Preconfiguration of Open Telemetry Collector for ServiceWatch.

Caution
Metric collection via ServiceWatch Agent is classified as custom metrics, and unlike the metrics collected by default from each service, it incurs charges, so it is recommended to configure only the metrics that are absolutely necessary.

Windows Exporter Metrics

Windows Exporter Main Metrics

Below is the collector and metric information that can be checked through Windows Exporter. You can set it as a Collector, or you can enable only specific metrics.

CategoryCollectorMetric NameDescription
Memorymemorywindows_memory_available_bytesAvailable Memory
Memorymemorywindows_memory_cache_bytesCache Memory
Memorymemorywindows_memory_committed_bytesCommitted memory
Memorymemorywindows_memory_commit_limitCommit limit
Memorymemorywindows_memory_pool_paged_bytespaged pool
Memorymemorywindows_memory_pool_nonpaged_bytesnon-paged pool
Disk Informationlogical_diskwindows_logical_disk_free_bytesRemaining Capacity
Disk Informationlogical_diskwindows_logical_disk_size_bytesTotal Capacity
Disk Informationlogical_diskwindows_logical_disk_read_bytes_totalRead Bytes
Disk Informationlogical_diskwindows_logical_disk_write_bytes_totalWrite Bytes Count
Disk Informationlogical_diskwindows_logical_disk_read_seconds_totalRead latency
Disk Informationlogical_diskwindows_logical_disk_write_seconds_totalWrite latency
Disk Informationlogical_diskwindows_logical_disk_idle_seconds_totalidle time
Table. Windows Exporter Key Metrics

Windows Exporter Collector and metric collection settings

Windows Exporter enables most collectors by default, but you can configure only the collectors you want.

Activate only specific Collector

CPU, memory, when you want to use only logical disks:

Color mode
# --collector.enabled option disables the default and activates only the specified Collector
.\windows_exporter.exe --collectors.enabled="memory,logical_disk"
# --collector.enabled option disables the default and activates only the specified Collector
.\windows_exporter.exe --collectors.enabled="memory,logical_disk"
Code block. Windows Exporter specific Collector activation
Reference
Even without disabling unused collectors, Windows Exporter will collect only the collectors specified in the option when using –collector.enabled.

Color mode
# Register windows_exporter as a service
sc.exe create windows_exporter binPath= "C:\Temp\windows_exporter-0.31.3-amd64.exe --config.file=C:\Temp\config.yml" DisplayName= "Prometheus Windows Exporter" start= auto
# Service Start
Start-Service windows_exporter
# Register windows_exporter as a service
sc.exe create windows_exporter binPath= "C:\Temp\windows_exporter-0.31.3-amd64.exe --config.file=C:\Temp\config.yml" DisplayName= "Prometheus Windows Exporter" start= auto
# Service Start
Start-Service windows_exporter
Code Block. Service Registration
Color mode
# Note this is not an exhaustive list of all configuration values
collectors:
  enabled: logical_disk,memory # collector settings to enable
collector:
  service:
    include: "windows_exporter"
  scheduled_task:
    include: /Microsoft/.+
log:
  level: debug
scrape:
  timeout-margin: 0.5
telemetry:
  path: /metrics
web:
  listen-address: ":9182"
Code block. Service configuration file

How to filter only specific metrics

Through the Open Telemetry Collector configuration, you can set it to collect only the necessary metrics collected from the Windows Exporter. When you want to collect only specific metrics among those provided by a particular collector of the Windows Exporter, you can refer to the Open Telemetry Collector pre‑configuration for ServiceWatch.

Caution
Metric collection via ServiceWatch Agent is classified as custom metrics, and unlike the metrics collected by default from each service, charges apply, so it is recommended to configure only the metrics that are absolutely necessary.