Based on the best stability in Korea, it provides the optimal computing resources conveniently and flexibly according to the purpose of use.
This is the multi-page printable view of this section. Click here to print.
Compute
- 1: Virtual Server
- 1.1: Overview
- 1.1.1: Server Type
- 1.1.2: Monitoring Metrics
- 1.1.3: ServiceWatch Metrics
- 1.2: How-to guides
- 1.2.1: Image
- 1.2.2: Keypair
- 1.2.3: Server Group
- 1.2.4: IP Change
- 1.2.5: Linux NTP Setting
- 1.2.6: Setting up RHEL Repo and WKMS
- 1.2.7: ServiceWatch Agent Installation
- 1.3: API Reference
- 1.4: CLI Reference
- 1.5: Release Note
- 2: Virtual Server Auto-Scaling
- 2.1: Overview
- 2.1.1: Monitoring Metrics
- 2.2: How-to guides
- 2.2.1: Launch Configuration
- 2.2.2: Managing Policies
- 2.2.3: Managing Schedules
- 2.2.4: Managing Notifications
- 2.3: API Reference
- 2.4: CLI Reference
- 2.5: Release Note
- 3: GPU Server
- 3.1:
- 3.1.1: Server Type
- 3.1.2: Monitoring Metrics
- 3.1.3: ServiceWatch Metrics
- 3.2: How-to guides
- 3.2.1: Image Management
- 3.2.2: Using Multi-instance GPU in GPU Server
- 3.2.3: Using NVSwitch on GPU Server
- 3.2.4: Keypair Management
- 3.2.5: ServiceWatch Agent Install
- 3.3: API Reference
- 3.4: CLI Reference
- 3.5: Release Note
- 4: Bare Metal Server
- 4.1: Overview
- 4.1.1: Server Type
- 4.1.2: Monitoring Metrics
- 4.2: How-to guides
- 4.2.1: ServiceWatch Agent Install
- 4.3: API Reference
- 4.4: CLI Reference
- 4.5: Release Note
- 5: Multi-node GPU Cluster
- 5.1: Overview
- 5.1.1: Server Type
- 5.1.2: Monitoring Metrics
- 5.2: How-to guides
- 5.2.1: Cluster Fabric Management
- 5.2.2: ServiceWatch Agent Install
- 5.2.3: Multi-node GPU Cluster Service Scope and Inspection Guide
- 5.3: Release Note
- 6: Cloud Functions
- 6.1: Overview
- 6.2: How-to guides
- 6.2.1: Set Trigger
- 6.2.2: AIOS Connect
- 6.2.3: Blueprint Detailed Guide
- 6.2.4: PrivateLink Service Integration
- 6.3: Release Note
- 7: Virtual Server DR
- 7.1: Overview
- 7.2: Release Note
- 8: Block Storage
- 8.1: Overview
- 8.1.1: Monitoring Metrics
- 8.2: How-to guides
- 8.2.1: Connecting to the Server
- 8.2.2: Using Snapshots
- 8.2.3: Move Volume
- 8.3: API Reference
- 8.4: CLI Reference
- 8.5: Release Note
1 - Virtual Server
1.1 - Overview
Service Overview
Virtual Server can be allocated freely as needed at the time needed without having to purchase infrastructure resources such as CPU, Memory provided by the server individually, and it is a virtual server optimized for cloud computing. In a cloud environment, you can use resources with optimized performance according to the user’s computing usage purpose such as development, testing, and application execution.
Features
Easy and convenient computing environment configuration: Through a web-based console, users can easily use self-service from Virtual Server provisioning to resource management and cost management. If capacity changes of major resources such as CPU or Memory are needed while using Virtual Server, they can be easily scaled up or down without operator intervention.
Providing various types of services: Provides virtualized vCore/Memory resources according to predefined server types (1~128 vCore).
- General Virtual Server: Provides commonly used Computing Spec (up to 16 vCore, 256 GB)
- Large-capacity Virtual Server: Provided when large-capacity resources beyond the standard Virtual Server Spec are needed
Strong Security Implementation: Through the Security Group service, it controls inbound/outbound traffic communicating with external internet or other VPC (Virtual Private Cloud) to safely protect the server. Additionally, real-time monitoring enables stable operation of computing resources.
Service Architecture Diagram
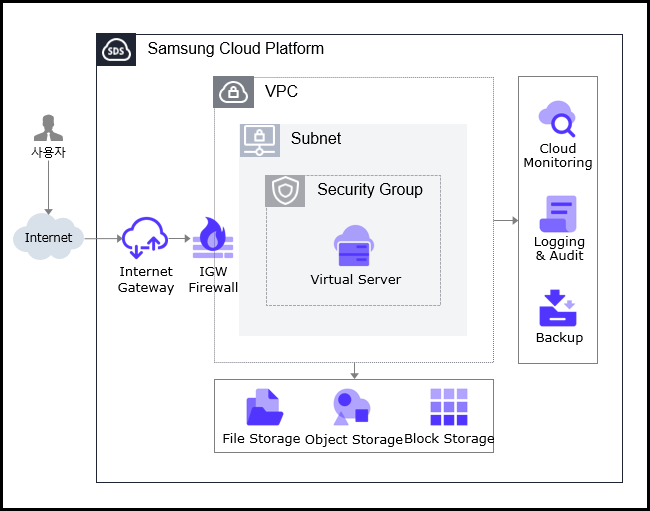
Provided Features
Virtual Server provides the following functions.
- Auto Provisioning and Management: Provides functions from Virtual Server provisioning to resource management and cost management through a web-based console. If you need to change the capacity of major resources such as CPU or Memory while using Virtual Server, you can change it immediately using the server type modification feature.
- Standard server type and Image provision: Provides virtualized vCore/Memory resources according to the standard server type, and provides a standard OS Image.
- Storage Connection: Provides additional connected storage besides the OS disk. Block Storage, File Storage, and Object Storage can be added and used.
- Network Connection: You can connect the Virtual Server’s general subnet/IP settings and Public NAT IP. Provides a local subnet connection for inter-server communication. This operation can be modified on the detail page.
- Security Group applied: Through the Security Group service, it controls inbound/outbound traffic communicating with external internet or other VPCs, safely protecting the server.
- Monitoring: You can check monitoring information such as CPU, Memory, Disk that correspond to computing resources through the Cloud Monitoring service.
- Backup and Recovery: You can backup and recover Virtual Server Image through the Backup service.
- Cost Management: You can create, stop, or terminate servers as needed, and since billing is based on actual usage time, you can check costs according to usage.
- ServiceWatch service integration provision: You can monitor data through the ServiceWatch service.
Components
Virtual Server provides standard server types and standard OS images. Users can select and use them according to the desired service scale.
Image
You can create and manage images. The main features are as follows.
- Image creation: You can create an Image from the configuration of the Virtual Server you are using, and you can create an Image by uploading the user’s Image file to Object Storage.
- Create Shared Image: You can create an Image with Visibility set to Private as a Shared Image that can be shared.
- Share with another Account: You can share the Image with another Account.
- Image creation and usage methods, please refer to the How-to guides > Image document.
Keypair
To provide a safer OS access, we enhance security by offering a Key Pair instead of the ID/Password entry method. The main features are as follows.
- Keypair creation: Create user credentials to connect to the Virtual Server.
- Get Public Key: You can retrieve the public key by loading a file or entering the public key directly.
- For creating and using Keypair, refer to the How-to guides > Keypair document.
Server Group
Through Server Group settings, you can place the Block Storage added when creating a Virtual Server near or distributed across racks and hosts. The main features are as follows.
- Server Group creation: You can set Virtual Servers belonging to the same Server Group to Anti-Affinity (distributed placement), Affinity (proximate placement), Partition (distributed placement of Virtual Server and Block Storage).
- For how to create and use Server Group, refer to the How-to guides > Server Group document.
OS Image Provided Version
The OS Image provided by Virtual Server are as follows
| OS Image Version | EoS Date |
|---|---|
| Alma Linux 8.10 | 2029-05-31 |
| Alma Linux 9.6 | 2025-11-17 |
| Oracle Linux 8.10 | 2029-07-31 |
| Oracle Linux 9.6 | 2025-11-25 |
| RHEL 8.10 | 2029-05-31 |
| RHEL 9.4 | 2026-04-30 |
| RHEL 9.6 | 2027-05-31 |
| Rocky Linux 8.10 | 2029-05-31 |
| Rocky Linux 9.6 | 2025-11-30 |
| Ubuntu 22.04 | 2027-06-30 |
| Ubuntu 24.04 | 2029-06-30 |
| Windows 2019 | 2029-01-09 |
| Windows 2022 | 2031-10-14 |
Table. Virtual Server Provided OS Image Version
Reference
- Linux operating systems such as Alma Linux and Rocky Linux provide only even Minor versions, except for the very last release of a Major version. This is a policy to ensure the stability and consistency of the SCP system. We recommend checking the EOS (End of Support) and EOL (End of Life) dates for the operating system, and if necessary, applying new or additional individual packages to maintain a stable environment.
Server Type
The server types supported by Virtual Server are as follows. For more details about server types, refer to Virtual Server Server Type.
Standard s1v2m4
Category | Example | Detailed description |
|---|---|---|
| Server Type | Standard | Provided server type categories
|
| Server Specification | s1 | Provided server type classification and generation
|
| Server specifications | v2 | Number of vCores
|
| Server Specifications | m4 | Memory Capacity
|
Table. Virtual Server server type
Constraints
Reference
- If you create a Virtual Server with Rocky Linux or Oracle Linux, additional settings are required for time synchronization (NTP: Network Time Protocol). If you create it with another image, it is set automatically and no separate configuration is needed.
For more details, please refer to Linux NTP Setup. - If RHEL and Windows Server were created before August 2025, RHEL Repository and WKMS (Windows Key Management Service) settings need to be modified.
For more details, see RHEL Repo and WKMS Setting.
Preceding Service
This is a list of services that need to be pre-configured before creating the service. Please refer to the guide provided for each service for details and prepare in advance.
| Service Category | Service | Detailed Description |
|---|---|---|
| Networking | VPC | A service that provides an independent virtual network in a cloud environment |
| Networking | Security Group | Virtual firewall that controls server traffic |
Table. Virtual Server Preliminary Service
1.1.1 - Server Type
Virtual Server server type
Virtual Server provides a server type suitable for the purpose of use. The server type consists of various combinations such as CPU, Memory, Network Bandwidth, etc. The host server used by the Virtual Server is determined by the server type selected when creating the Virtual Server. Please select a server type according to the specifications of the application you want to run on the Virtual Server.
The server types supported by Virtual Server are as follows.
Standard s1v2m4
Classification | Example | Detailed Description |
|---|---|---|
| Server Type | Standard | Provided server type distinction
|
| Server Specification | s1 | Type of server provided and generation distinction
|
| Server Specification | v2 | Number of vCores
|
| Server Specification | m4 | Memory Capacity
|
Table. Virtual Server server type format
s1 server type
The s1 server type of Virtual Server is provided with standard specifications (vCPU, Memory) and is suitable for various applications.
- Samsung Cloud Platform v2’s 1st generation: up to 3.3Ghz Intel 3rd generation (Ice Lake) Xeon Gold 6342 Processor
- Supports up to 16 vCPUs and 256 GB of memory
- Up to 12.5 Gbps networking speed
| Division | Server Type | vCPU | Memory | Network Bandwidth |
|---|---|---|---|---|
| Standard | s1v1m2 | 1 vCore | 2 GB | up to 10 Gbps |
| Standard | s1v2m4 | 2 vCore | 4 GB | Up to 10 Gbps |
| Standard | s1v2m8 | 2 vCore | 8 GB | Up to 10 Gbps |
| Standard | s1v2m16 | 2 vCore | 16 GB | Up to 10 Gbps |
| Standard | s1v2m24 | 2 vCore | 24 GB | Up to 10 Gbps |
| Standard | s1v2m32 | 2 vCore | 32 GB | Up to 10 Gbps |
| Standard | s1v4m8 | 4 vCore | 8 GB | Up to 10 Gbps |
| Standard | s1v4m16 | 4 vCore | 16 GB | Up to 10 Gbps |
| Standard | s1v4m32 | 4 vCore | 32 GB | Up to 10 Gbps |
| Standard | s1v4m48 | 4 vCore | 48 GB | Up to 10 Gbps |
| Standard | s1v4m64 | 4 vCore | 64 GB | Up to 10 Gbps |
| Standard | s1v6m12 | 6 vCore | 12 GB | Up to 10 Gbps |
| Standard | s1v6m24 | 6 vCore | 24 GB | Up to 10 Gbps |
| Standard | s1v6m48 | 6 vCore | 48 GB | Up to 10 Gbps |
| Standard | s1v6m72 | 6 vCore | 72 GB | Up to 10 Gbps |
| Standard | s1v6m96 | 6 vCore | 96 GB | Up to 10 Gbps |
| Standard | s1v8m16 | 8 vCore | 16 GB | Up to 10 Gbps |
| Standard | s1v8m32 | 8 vCore | 32 GB | Up to 10 Gbps |
| Standard | s1v8m64 | 8 vCore | 64 GB | Up to 10 Gbps |
| Standard | s1v8m96 | 8 vCore | 96 GB | Up to 10 Gbps |
| Standard | s1v8m128 | 8 vCore | 128 GB | Up to 10 Gbps |
| Standard | s1v10m20 | 10 vCore | 20 GB | up to 10 Gbps |
| Standard | s1v10m40 | 10 vCore | 40 GB | Up to 10 Gbps |
| Standard | s1v10m80 | 10 vCore | 80 GB | up to 10 Gbps |
| Standard | s1v10m120 | 10 vCore | 120 GB | up to 10 Gbps |
| Standard | s1v10m160 | 10 vCore | 160 GB | Up to 10 Gbps |
| Standard | s1v12m24 | 12 vCore | 24 GB | Up to 12.5 Gbps |
| Standard | s1v12m48 | 12 vCore | 48 GB | Up to 12.5 Gbps |
| Standard | s1v12m96 | 12 vCore | 96 GB | Up to 12.5 Gbps |
| Standard | s1v12m144 | 12 vCore | 144 GB | Up to 12.5 Gbps |
| Standard | s1v12m192 | 12 vCore | 192 GB | up to 12.5 Gbps |
| Standard | s1v14m28 | 14 vCore | 28 GB | Up to 12.5 Gbps |
| Standard | s1v14m56 | 14 vCore | 56 GB | Up to 12.5 Gbps |
| Standard | s1v14m112 | 14 vCore | 112 GB | Up to 12.5 Gbps |
| Standard | s1v14m168 | 14 vCore | 168 GB | Up to 12.5 Gbps |
| Standard | s1v14m224 | 14 vCore | 224 GB | Up to 12.5 Gbps |
| Standard | s1v16m32 | 16 vCore | 32 GB | up to 12.5 Gbps |
| Standard | s1v16m64 | 16 vCore | 64 GB | Up to 12.5 Gbps |
| Standard | s1v16m128 | 16 vCore | 128 GB | up to 12.5 Gbps |
| Standard | s1v16m192 | 16 vCore | 192 GB | Up to 12.5 Gbps |
| Standard | s1v16m256 | 16 vCore | 256 GB | up to 12.5 Gbps |
Table. Virtual Server server type specifications - s1 server type
S2 Server Type
Virtual Server s2 server type is provided with standard specifications (vCPU, Memory) and is suitable for various applications.
- Samsung Cloud Platform v2’s 2nd generation: up to 3.2GHz Intel 4th generation (Sapphire Rapids) Xeon Gold 6448H Processor
- Supports up to 16 vCPUs and 256 GB of memory
- Up to 12.5 Gbps networking speed
| Classification | Server Type | CPU vCore | Memory | Network Bandwidth(Gbps) |
|---|---|---|---|---|
| Standard | s2v1m2 | 1 vCore | 2 GB | Up to 10 Gbps |
| Standard | s2v2m4 | 2 vCore | 4 GB | Up to 10 Gbps |
| Standard | s2v2m8 | 2 vCore | 8 GB | Up to 10 Gbps |
| Standard | s2v2m16 | 2 vCore | 16 GB | Up to 10 Gbps |
| Standard | s2v2m24 | 2 vCore | 24 GB | Up to 10 Gbps |
| Standard | s2v2m32 | 2 vCore | 32 GB | Up to 10 Gbps |
| Standard | s2v4m8 | 4 vCore | 8 GB | Up to 10 Gbps |
| Standard | s2v4m16 | 4 vCore | 16 GB | Up to 10 Gbps |
| Standard | s2v4m32 | 4 vCore | 32 GB | Up to 10 Gbps |
| Standard | s2v4m48 | 4 vCore | 48 GB | Up to 10 Gbps |
| Standard | s2v4m64 | 4 vCore | 64 GB | Up to 10 Gbps |
| Standard | s2v6m12 | 6 vCore | 12 GB | Up to 10 Gbps |
| Standard | s2v6m24 | 6 vCore | 24 GB | Up to 10 Gbps |
| Standard | s2v6m48 | 6 vCore | 48 GB | Up to 10 Gbps |
| Standard | s2v6m72 | 6 vCore | 72 GB | Up to 10 Gbps |
| Standard | s2v6m96 | 6 vCore | 96 GB | Up to 10 Gbps |
| Standard | s2v8m16 | 8 vCore | 16 GB | Up to 10 Gbps |
| Standard | s2v8m32 | 8 vCore | 32 GB | Up to 10 Gbps |
| Standard | s2v8m64 | 8 vCore | 64 GB | Up to 10 Gbps |
| Standard | s2v8m96 | 8 vCore | 96 GB | Up to 10 Gbps |
| Standard | s2v8m128 | 8 vCore | 128 GB | Up to 10 Gbps |
| Standard | s2v10m20 | 10 vCore | 20 GB | Up to 10 Gbps |
| Standard | s2v10m40 | 10 vCore | 40 GB | Up to 10 Gbps |
| Standard | s2v10m80 | 10 vCore | 80 GB | Up to 10 Gbps |
| Standard | s2v10m120 | 10 vCore | 120 GB | Up to 10 Gbps |
| Standard | s2v10m160 | 10 vCore | 160 GB | Up to 10 Gbps |
| Standard | s2v12m24 | 12 vCore | 24 GB | Up to 12.5 Gbps |
| Standard | s2v12m48 | 12 vCore | 48 GB | Up to 12.5 Gbps |
| Standard | s2v12m96 | 12 vCore | 96 GB | Up to 12.5 Gbps |
| Standard | s2v12m144 | 12 vCore | 144 GB | Up to 12.5 Gbps |
| Standard | s2v12m192 | 12 vCore | 192 GB | Up to 12.5 Gbps |
| Standard | s2v14m28 | 14 vCore | 28 GB | Up to 12.5 Gbps |
| Standard | s2v14m56 | 14 vCore | 56 GB | Up to 12.5 Gbps |
| Standard | s2v14m112 | 14 vCore | 112 GB | Up to 12.5 Gbps |
| Standard | s2v14m168 | 14 vCore | 168 GB | up to 12.5 Gbps |
| Standard | s2v14m224 | 14 vCore | 224 GB | Up to 12.5 Gbps |
| Standard | s2v16m32 | 16 vCore | 32 GB | up to 12.5 Gbps |
| Standard | s2v16m64 | 16 vCore | 64 GB | Up to 12.5 Gbps |
| Standard | s2v16m128 | 16 vCore | 128 GB | up to 12.5 Gbps |
| Standard | s2v16m192 | 16 vCore | 192 GB | up to 12.5 Gbps |
| Standard | s2v16m256 | 16 vCore | 256 GB | up to 12.5 Gbps |
Table. Virtual Server server type specifications - s2 server type
h2 Server Type
The h2 server type of Virtual Server is provided with large-capacity server specifications and is suitable for applications for large-scale data processing.
- Samsung Cloud Platform v2’s 2nd generation: up to 3.2GHz Intel 4th generation (Sapphire Rapids) Xeon Gold 6448H Processor Supports up to 128 vCPUs and 1,536 GB of memory
- up to 25Gbps networking speed
| Division | Server Type | vCPU | Memory | Network Bandwidth |
|---|---|---|---|---|
| High Capacity | h2v24m48 | 24 vCore | 48 GB | Up to 25 Gbps |
| High Capacity | h2v24m96 | 24 vCore | 96 GB | Up to 25 Gbps |
| High Capacity | h2v24m192 | 24 vCore | 192 GB | Up to 25 Gbps |
| High Capacity | h2v24m288 | 24 vCore | 288 GB | Up to 25 Gbps |
| High Capacity | h2v32m64 | 32 vCore | 64 GB | Up to 25 Gbps |
| High Capacity | h2v32m128 | 32 vCore | 128 GB | Up to 25 Gbps |
| High Capacity | h2v32m256 | 32 vCore | 256 GB | Up to 25 Gbps |
| High Capacity | h2v32m384 | 32 vCore | 384 GB | Up to 25 Gbps |
| High Capacity | h2v48m96 | 48 vCore | 96 GB | up to 25 Gbps |
| High Capacity | h2v48m192 | 48 vCore | 192 GB | Up to 25 Gbps |
| High Capacity | h2v48m384 | 48 vCore | 384 GB | Up to 25 Gbps |
| High Capacity | h2v48m576 | 48 vCore | 576 GB | Up to 25 Gbps |
| High Capacity | h2v64m128 | 64 vCore | 128 GB | Up to 25 Gbps |
| High Capacity | h2v64m256 | 64 vCore | 256 GB | Up to 25 Gbps |
| High Capacity | h2v64m512 | 64 vCore | 512 GB | Up to 25 Gbps |
| High Capacity | h2v64m768 | 64 vCore | 768 GB | Up to 25 Gbps |
| High Capacity | h2v72m144 | 72 vCore | 144 GB | Up to 25 Gbps |
| High Capacity | h2v72m288 | 72 vCore | 288 GB | Up to 25 Gbps |
| High Capacity | h2v72m576 | 72 vCore | 576 GB | Up to 25 Gbps |
| High Capacity | h2v72m864 | 72 vCore | 864 GB | Up to 25 Gbps |
| High Capacity | h2v96m192 | 96 vCore | 192 GB | Up to 25 Gbps |
| High Capacity | h2v96m384 | 96 vCore | 384 GB | Up to 25 Gbps |
| High Capacity | h2v96m768 | 96 vCore | 768 GB | Up to 25 Gbps |
| High Capacity | h2v96m1152 | 96 vCore | 1152 GB | Up to 25 Gbps |
| High Capacity | h2v128m256 | 128 vCore | 256 GB | Up to 25 Gbps |
| High Capacity | h2v128m512 | 128 vCore | 512 GB | Up to 25 Gbps |
| High Capacity | h2v128m1024 | 128 vCore | 1024 GB | Up to 25 Gbps |
| High Capacity | h2v128m1536 | 128 vCore | 1536 GB | Up to 25 Gbps |
Table. Virtual Server server type specifications - h2 server type
1.1.2 - Monitoring Metrics
Virtual Server monitoring metrics
The following table shows the monitoring metrics of Virtual Server that can be checked through Cloud Monitoring. For more information on how to use Cloud Monitoring, please refer to the Cloud Monitoring guide.
You can get basic monitoring metrics without installing Agent, and please check the metrics below in Table. Virtual Server Monitoring Metrics (Basic). In addition, you can check the metrics that can be retrieved by installing Agent in Table. Virtual Server Additional Monitoring Metrics (Agent Installation Required).
For Windows OS, memory-related metrics can only be retrieved if the Agent is installed.
| Performance Item | Detailed Description | Unit |
|---|---|---|
| Memory Total [Basic] | Available memory bytes | bytes |
| Memory Used [Basic] | Currently used memory bytes | bytes |
| Memory Swap In [Basic] | Swapped memory bytes | bytes |
| Memory Swap Out [Basic] | bytes of swapped memory | bytes |
| Memory Free [Basic] | Unused memory bytes | bytes |
| Disk Read Bytes [Basic] | Read bytes | bytes |
| Disk Read Requests [Basic] | Number of Read Requests | cnt |
| Disk Write Bytes [Basic] | Write bytes | bytes |
| Disk Write Requests [Basic] | Number of Write Requests | cnt |
| CPU Usage [Basic] | 1-minute average system CPU usage rate | % |
| Instance State [Basic] | Instance Status | state |
| Network In Bytes [Basic] | Received bytes | bytes |
| Network In Dropped [Basic] | Receive Packet Drop | cnt |
| Network In Packets [Basic] | Received Packet Count | cnt |
| Network Out Bytes [Basic] | Transmission bytes | bytes |
| Network Out Dropped [Basic] | Transmission Packet Drop | cnt |
| Network Out Packets [Basic] | Transmission packet count | cnt |
Fig. Virtual Server Monitoring Metrics (Default Provided)
| Performance Item | Detailed Description | Unit |
|---|---|---|
| Core Usage [IO Wait] | The ratio of CPU time spent in waiting state (disk waiting) | % |
| Core Usage [System] | The ratio of CPU time spent in kernel space | % |
| Core Usage [User] | The ratio of CPU time spent in user space | % |
| CPU Cores | The number of CPU cores on the host | cnt |
| CPU Usage [Active] | Idle and IOWait status excluding the percentage of CPU time used | % |
| CPU Usage [Idle] | The ratio of CPU time spent in idle state. | % |
| CPU Usage [IO Wait] | the ratio of CPU time spent in a waiting state (disk waiting) | % |
| CPU Usage [System] | The percentage of CPU time used by the kernel | % |
| CPU Usage [User] | The percentage of CPU time used in the user area | % |
| CPU Usage/Core [Active] | Idle and IOWait status excluding the percentage of CPU time used | % |
| CPU Usage/Core [Idle] | The ratio of CPU time spent in idle state. | % |
| CPU Usage/Core [IO Wait] | the ratio of CPU time spent in waiting state (disk waiting) | % |
| CPU Usage/Core [System] | The percentage of CPU time used by the kernel | % |
| CPU Usage/Core [User] | The percentage of CPU time used in the user area | % |
| DiskCPU Usage [IO Request] | The ratio of CPU time spent executing input/output requests for the device | % |
| Disk Queue Size [Avg] | The average queue length of requests executed for the device. | num |
| Disk Read Bytes | The number of bytes read from the device per second. | bytes |
| Disk Read Bytes [Delta Avg] | Average of system.diskio.read.bytes_delta for each Disk | bytes |
| Disk Read Bytes [Delta Max] | Individual Disks’ system.diskio.read.bytes_delta maximum | bytes |
| Disk Read Bytes [Delta Min] | Individual Disks’ system.diskio.read.bytes_delta minimum | bytes |
| Disk Read Bytes [Delta Sum] | Individual Disks’ sum of system.diskio.read.bytes_delta | bytes |
| Disk Read Bytes [Delta] | Individual Disk’s system.diskio.read.bytes value delta | bytes |
| Disk Read Bytes [Success] | Total bytes read successfully | bytes |
| Disk Read Requests | Number of read requests for the disk device during 1 second | cnt |
| Disk Read Requests [Delta Avg] | Individual Disks’ average of system.diskio.read.count_delta | cnt |
| Disk Read Requests [Delta Max] | Individual Disks’ system.diskio.read.count_delta maximum | cnt |
| Disk Read Requests [Delta Min] | Individual Disks’ minimum of system.diskio.read.count_delta | cnt |
| Disk Read Requests [Delta Sum] | The sum of system.diskio.read.count_delta of individual Disks | cnt |
| Disk Read Requests [Success Delta] | Individual Disk’s system.diskio.read.count delta | cnt |
| Disk Read Requests [Success] | Successfully completed total read count | cnt |
| Disk Request Size [Avg] | The average size of requests executed for the device (unit: sector) | num |
| Disk Service Time [Avg] | The average service time (in milliseconds) for the input requests executed on the device. | ms |
| Disk Wait Time [Avg] | The average time spent on requests executed for supported devices. | ms |
| Disk Wait Time [Read] | Disk Average Wait Time | ms |
| Disk Wait Time [Write] | Disk Average Wait Time | ms |
| Disk Write Bytes [Delta Avg] | Individual Disks’ average of system.diskio.write.bytes_delta | bytes |
| Disk Write Bytes [Delta Max] | Individual Disks’ system.diskio.write.bytes_delta maximum | bytes |
| Disk Write Bytes [Delta Min] | Individual Disks’ system.diskio.write.bytes_delta minimum | bytes |
| Disk Write Bytes [Delta Sum] | Individual Disks’ sum of system.diskio.write.bytes_delta | bytes |
| Disk Write Bytes [Delta] | Individual Disk’s system.diskio.write.bytes value delta | bytes |
| Disk Write Bytes [Success] | Total bytes written successfully | bytes |
| Disk Write Requests | Number of write requests to the disk device for 1 second | cnt |
| Disk Write Requests [Delta Avg] | Individual Disks’ average of system.diskio.write.count_delta | cnt |
| Disk Write Requests [Delta Max] | Individual Disks’ system.diskio.write.count_delta maximum | cnt |
| Disk Write Requests [Delta Min] | Minimum of system.diskio.write.count_delta for each Disk | cnt |
| Disk Write Requests [Delta Sum] | Sum of system.diskio.write.count_delta of individual Disks | cnt |
| Disk Write Requests [Success Delta] | Individual Disk’s system.diskio.write.count Delta | cnt |
| Disk Write Requests [Success] | Total number of writes completed successfully | cnt |
| Disk Writes Bytes | The number of bytes written to the device per second | bytes |
| Filesystem Hang Check | filesystem(local/NFS) hang check(Normal:1, Abnormal:0) | status |
| Filesystem Nodes | The total number of file nodes in the file system. | cnt |
| Filesystem Nodes [Free] | The total number of available file nodes in the file system. | cnt |
| Filesystem Size [Available] | Disk space (bytes) available for use by unauthorized users | bytes |
| Filesystem Size [Free] | Available disk space(bytes) | bytes |
| Filesystem Size [Total] | Total disk space (bytes) | bytes |
| Filesystem Usage | Used disk space percentage | % |
| Filesystem Usage [Avg] | Average of individual filesystem.used.pct | % |
| Filesystem Usage [Inode] | iNode usage rate | % |
| Filesystem Usage [Max] | Individual filesystem used percentage Max | % |
| Filesystem Usage [Min] | Individual minimum of filesystem.used.pct | % |
| Filesystem Usage [Total] | - | % |
| Filesystem Used | Used Disk Space (bytes) | bytes |
| Filesystem Used [Inode] | iNode usage | bytes |
| Memory Free | Total available memory amount (bytes) | bytes |
| Memory Free [Actual] | Actually available Memory(bytes) | bytes |
| Memory Free [Swap] | Available Swap memory | bytes |
| Memory Total | Total Memory | bytes |
| Memory Total [Swap] | Total Swap memory. | bytes |
| Memory Usage | used Memory percentage | % |
| Memory Usage [Actual] | Actual used Memory percentage | % |
| Memory Usage [Cache Swap] | cached swap usage rate | % |
| Memory Usage [Swap] | Used Swap memory percentage | % |
| Memory Used | Used Memory | bytes |
| Memory Used [Actual] | Actually used Memory(bytes) | bytes |
| Memory Used [Swap] | Used Swap memory | bytes |
| Collisions | Network Collision | cnt |
| Network In Bytes | Received byte count | bytes |
| Network In Bytes [Delta Avg] | Individual Networks’ average of system.network.in.bytes_delta | bytes |
| Network In Bytes [Delta Max] | Individual Network’s system.network.in.bytes_delta maximum | bytes |
| Network In Bytes [Delta Min] | Individual Networks’ system.network.in.bytes_delta minimum values | bytes |
| Network In Bytes [Delta Sum] | Individual networks’ sum of system.network.in.bytes_delta | bytes |
| Network In Bytes [Delta] | Received byte count delta | bytes |
| Network In Dropped | Number of packets dropped among incoming packets | cnt |
| Network In Errors | Number of errors during reception | cnt |
| Network In Packets | Received packet count | cnt |
| Network In Packets [Delta Avg] | Individual Networks’ average of system.network.in.packets_delta | cnt |
| Network In Packets [Delta Max] | Individual Network’s system.network.in.packets_delta maximum value | cnt |
| Network In Packets [Delta Min] | Individual Network’s system.network.in.packets_delta minimum value | cnt |
| Network In Packets [Delta Sum] | The sum of system.network.in.packets_delta of individual Networks | cnt |
| Network In Packets [Delta] | Received packet count delta | cnt |
| Network Out Bytes | Sent byte count | bytes |
| Network Out Bytes [Delta Avg] | Individual Networks’ average of system.network.out.bytes_delta | bytes |
| Network Out Bytes [Delta Max] | Individual Networks’ system.network.out.bytes_delta maximum | bytes |
| Network Out Bytes [Delta Min] | Individual Networks’ system.network.out.bytes_delta minimum value | bytes |
| Network Out Bytes [Delta Sum] | Individual Network’s system.network.out.bytes_delta sum | bytes |
| Network Out Bytes [Delta] | Sent byte count delta | bytes |
| Network Out Dropped | number of packets dropped among outgoing packets | cnt |
| Network Out Errors | Number of errors during transmission | cnt |
| Network Out Packets | Transmitted packet count | cnt |
| Network Out Packets [Delta Avg] | Average of system.network.out.packets_delta for individual Networks | cnt |
| Network Out Packets [Delta Max] | Individual Networks’ system.network.out.packets_delta maximum values | cnt |
| Network Out Packets [Delta Min] | Individual Network’s system.network.out.packets_delta minimum value | cnt |
| Network Out Packets [Delta Sum] | The sum of system.network.out.packets_delta of individual Networks | cnt |
| Network Out Packets [Delta] | Sent packet count delta | cnt |
| Open Connections [TCP] | All open TCP connections | cnt |
| Open Connections [UDP] | All open UDP connections | cnt |
| Port Usage | Accessible port usage rate | % |
| SYN Sent Sockets | Number of sockets in SYN_SENT state (when connecting from local to remote) | cnt |
| Kernel PID Max | kernel.pid_max value | count |
| Kernel Thread Max | kernel threads maximum value | count |
| Process CPU Usage | The percentage of CPU time consumed by the process after the last update | % |
| Process CPU Usage/Core | The percentage of CPU time used by the process since the last event | % |
| Process Memory Usage | main memory(RAM) where the process occupies a ratio | % |
| Process Memory Used | Resident Set size. The amount of memory a process occupies in RAM | bytes |
| Process PID | Process pid | pid |
| Process PPID | Parent process’s pid | pid |
| Processes [Dead] | number of dead processes | cnt |
| Processes [Idle] | idle Number of Processes | cnt |
| Processes [Running] | running Number of Processes | count |
| Processes [Sleeping] | sleeping processes count | cnt |
| Processes [Stopped] | stopped processes count | cnt |
| Processes [Total] | Total number of processes | cnt |
| Processes [Unknown] | The status cannot be searched or the number of unknown processes | cnt |
| Processes [Zombie] | Number of zombie processes | cnt |
| Running Process Usage | Process Usage Rate | % |
| Running Processes | number of running processes | count |
| Running Thread Usage | thread usage rate | % |
| Running Threads | running processes where the total number of threads being executed | cnt |
| Context Switches | number of context switches (per second) | cnt |
| Load/Core [1 min] | The value divided by the number of cores for the last 1 minute load | cnt |
| Load/Core [15 min] | The value of load divided by the number of cores for the last 15 minutes | cnt |
| Load/Core [5 min] | The value divided by the number of cores for the last 5 minutes | cnt |
| Multipaths [Active] | External storage connection path status = active count | cnt |
| Multipaths [Failed] | External storage connection path status = failed count | cnt |
| Multipaths [Faulty] | External storage connection path status = faulty count | cnt |
| NTP Offset last | sample’s measured offset (time difference between NTP server and local environment) | num |
| Run Queue Length | Execution Waiting Queue Length | num |
| Uptime | OS operation time(uptime) (milliseconds) | ms |
| Context Switchies CPU | number of context switches (per second) | cnt |
| Disk Read Bytes [Sec] | bytes read from the Windows logical disk in 1 second
| cnt |
| Disk Read Time [Avg] | Data Read Average Time (sec)
| sec |
| Disk Transfer Time [Avg] | Disk average wait time (seconds)
| sec |
| Disk Write Bytes [Sec] | The number of bytes written to the Windows logical disk in 1 second
| cnt |
| Disk Write Time [Avg] | Data write average time (seconds)
| sec |
| Pagingfile Usage | Paging file usage rate
| % |
| Pool Used [Non Paged] | _KERNEL MEMORY among Nonpaged Pool usage
| bytes |
| Pool Used [Paged] | Kernel memory Paged Pool usage among kernel memory
| bytes |
| Process [Running] | The number of processes currently running
| cnt |
| Threads [Running] | The number of threads currently running
| cnt |
| Threads [Waiting] | The number of threads waiting for processor time
| cnt |
Fig. Virtual Server Additional Monitoring Metrics (Agent Installation Required)
1.1.3 - ServiceWatch Metrics
Virtual Server sends metrics to ServiceWatch. The metrics provided by basic monitoring are data collected at 5-minute intervals. If detailed monitoring is enabled, you can view data collected at 1-minute intervals.
Reference
How to check metrics in ServiceWatch, refer to the ServiceWatch guide.
How to enable detailed monitoring of Virtual Server, please refer to How-to guides > ServiceWatch Detailed Monitoring Activation.
Basic Indicators
The following are the basic metrics for the Virtual Server namespace.
| Performance Item | Detailed Description | Unit | Meaningful Statistics |
|---|---|---|---|
| Instance State | Instance status display | - | - |
| CPU Usage | CPU Usage | Percent |
|
| Disk Read Bytes | Read capacity from block device (bytes) | Bytes |
|
| Disk Read Requests | Read request count on block device | Count |
|
| Disk Write Bytes | Write capacity on block device (bytes) | Bytes |
|
| Disk Write Requests | Number of write requests on block device | Count |
|
| Network In Bytes | Capacity received from network interface (bytes) | Bytes |
|
| Network In Dropped | Number of packet drops received on network interface | Count |
|
| Network In Packets | Number of packets received on the network interface | Count |
|
| Network Out Bytes | Data transmitted from the network interface (bytes) | Bytes |
|
| Network Out Dropped | Number of packet drops transmitted from the network interface | Count |
|
| Network Out Packets | Number of packets transmitted from the network interface | Count |
|
Table. Virtual Server Basic Metrics
Reference
How to collect metrics using ServiceWatch Agent, see the ServiceWatch Agent guide.
1.2 - How-to guides
The user can enter the required information for a Virtual Server through the Samsung Cloud Platform Console, select detailed options, and create the service.
Virtual Server Create
You can create and use Virtual Server services from the Samsung Cloud Platform Console.
To create Virtual Server, follow the steps below.
- All Services > Compute > Virtual Server Click the menu. Go to the Service Home page of Virtual Server.
- Click the Virtual Server Creation button on the Service Home page. You will be taken to the Virtual Server Creation page.
- Virtual Server Creation page, enter the information required to create the service, and select detailed options.
- Image and Version Selection Select the required information in the area.
Category RequiredDetailed description Image Required Select the type of Image to provide - Standard: Samsung Cloud Platform standard provided Image
- Alma Linux, Oracle Linux, RHEL, Rocky Linux, Ubuntu, Windows
- Custom: User-created Image
- Kubernetes: Image for Kubernetes
- RHEL, Ubuntu
- Marketplace: Image subscribed from Marketplace
Image version Required Select version of the chosen Image - Provides a list of versions of the server Image offered
Table. Virtual Server Image and version selection input items - Standard: Samsung Cloud Platform standard provided Image
- Service Information Input area, enter or select the required information.
Category RequiredDetailed description Server count Required Number of servers to create simultaneously - Only numbers can be entered, input a value between 1 and 100
Service Type > Server Type Required Virtual Server Server Type - Standard: Standard specifications commonly used
- High Capacity: Large server specifications above Standard
- For detailed information about server types provided by Virtual Server, refer to Virtual Server Server Type
Service Type > Planned Compute Required Status of resources with Planned Compute set - In Use: Number of resources with Planned Compute set that are in use
- Configured: Number of resources with Planned Compute set
- Coverage Preview: Amount applied by Planned Compute per resource
- Apply for Planned Compute Service: Go to Planned Compute service creation page
- For details, refer to Apply for Planned Compute
Block Storage Required Block Storage settings used by the server according to purpose - Basic OS: Area where OS is installed and used
- Enter capacity in Units; minimum capacity varies by OS Image type
- Alma Linux: Enter a value between 2 and 1,536
- Oracle Linux: Enter a value between 7 and 1,536
- RHEL: Enter a value between 2 and 1,536
- Rocky Linux: Enter a value between 2 and 1,536
- Ubuntu: Enter a value between 2 and 1,536
- Windows: Enter a value between 4 and 1,536
- SSD: High-performance general volume
- HDD: General volume
- SSD/HDD_KMS: Additional encrypted volume using Samsung Cloud Platform KMS (Key Management Service) encryption key
- Encryption can only be applied at initial creation and cannot be changed afterwards
- Using SSD_KMS disk type causes performance degradation
- Enter capacity in Units; minimum capacity varies by OS Image type
- Additional: Use when additional user space is needed outside the OS area
- After selecting Use, enter the storage type and capacity
- Click the + button to add storage, and the x button to delete (up to 25 can be added)
- Enter capacity in Units, value between 1 and 1,536
- 1 Unit is 8GB, so 8 ~ 12,288GB is created
- SSD: High-performance general volume
- HDD: General volume
- SSD/HDD_KMS: Additional encrypted volume using Samsung Cloud Platform KMS (Key Management Service) encryption key
- Encryption can only be applied at initial creation and cannot be changed afterwards
- Using SSD_KMS disk type may cause performance degradation
- SSD_MultiAttach: Volume that can be attached to more than one server
- For detailed information on each Block Storage type, refer to Create Block Storage
- Delete on termination: When Delete on Termination is selected, the volume is terminated together with the server
- Volumes with snapshots are not deleted even when Delete on termination is enabled
- Multi-attach volumes are deleted only when the server being deleted is the last remaining server attached to the volume
Server Group Select Set servers belonging to the same Server Group to Anti-Affinity (distributed placement), Affinity (proximate placement), Partition (distributed placement of Virtual Server and Block Storage) - Use after selecting, select Server Group
- Select Create New to create a Server Group
- Place servers belonging to the same Server Group according to the selected policy using a Best Effort method
- Select a policy among Anti-Affinity (distributed placement), Affinity (proximate placement), Partition (distributed placement of Virtual Server and Block Storage)
Table. Virtual Server Service Information Input Items
- Image and Version Selection Select the required information in the area.
Caution
- If you use the Partition (distributed deployment of Virtual Server and Block Storage) policy among Server Group policies, since additional allocation of Block Storage Volume after Virtual Server creation is not possible, please create all required Block Storage at the Virtual Server creation stage.
* In the **Required Information Input** area, enter or select the necessary information.
| Category | Required or not | Detailed description |
|---|---|---|
| Server Name | Required | Enter a name to distinguish the server when the number of selected servers is 1
|
| Network Settings > Create New Network Port | Required | Set the network where the Virtual Server will be installed
|
| Network Settings > Existing Network Port Assignment | Required | Set the network where the Virtual Server will be installed
|
| Keypair | Required | User authentication method to use when connecting to the server
|
Table. Virtual Server Required Information Input Items
| Category | Required | Detailed description |
|---|---|---|
| Lock | Select | Lock usage setting
|
| Init script | Select | Script executed when the server starts
|
| Tag | Select | Add Tag
|
Table. Virtual Server Additional Information Input Items
Notice
When entering a server name, if you use spaces and special characters (_) the OS hostname will have spaces and special characters (_) changed to the special character (-) when set. Please refer to this when setting the OS hostname.
- Example: If the server name is ‘server name_01’, the OS hostname is set to ‘server-name-01’.
Reference
- Rocky Linux, Oracle Linux with Virtual Server creation case, additional configuration is required for time synchronization (NTP: Network Time Protocol). For more details, please refer to Setting up Linux NTP.
- If RHEL and Windows Server were created before July 2025, RHEL Repository and WKMS (Windows Key Management Service) settings need to be modified. For more details, see Setting up RHEL Repo and WKMS.
Check Virtual Server detailed information
Virtual Server service allows you to view and edit the full resource list and detailed information. Virtual Server Details page is composed of Detailed Information, Tags, Activity Log tabs.
To view detailed information of the Virtual Server service, follow the steps below.
- Click the All Services > Compute > Virtual Server menu. Go to the Service Home page of Virtual Server.
- Click the Virtual Server menu on the Service Home page. You will be taken to the Virtual Server list page.
- Click the resource to view detailed information on the Virtual Server List page. It will navigate to the Virtual Server Details page.
- Virtual Server Details page displays status information and additional feature information, and consists of Details, Tags, Activity History tabs.
- Virtual Server Additional Features for detailed information, please refer to Virtual Server Management Additional Features.
Category Detailed description Virtual Server Status Status of Virtual Server created by the user - Build: State where the Build command has been issued
- Building: Build in progress
- Networking: Server creation in progress process
- Scheduling: Server creation in progress process
- Block_Device_Mapping: Block Storage being attached during server creation
- Spawning: Server creation process is ongoing
- Active: Available state
- Powering_off: State when a stop request is made
- Deleting: Server deletion in progress
- Reboot_Started: Reboot in progress state
- Error: Error state
- Migrating: State where the server is migrating to another host
- Reboot: State where the Reboot command has been issued
- Rebooting: Rebooting in progress
- Rebuild: State where the Rebuild command has been issued
- Rebuilding: State when a Rebuild request is made
- Rebuild_Spawning: Rebuild process is ongoing
- Resize: State where the Resize command has been issued
- Resizing: Resize in progress
- Resize_Prep: State when a server type modification request is made
- Resize_Migrating: State where the server is being moved to another host while resizing
- Resize_Migrated: State where the server has completed moving to another host while resizing
- Resize_Finish: Resize completed
- Revert_Resize: Resize or migration of the server failed for some reason. The target server is cleaned up and the original server is restarted
- Shutoff: State when Powering off is completed
- Verity_ Resize: After Resize_Prep due to a server type modification request, the server type is confirmed or can be reverted
- Resize_Reverting: State when a server type revert request is made
- Resize_Confirming: State where the server’s Resize request is being confirmed
Server Control Button to change server status - Start: Start a stopped server
- Stop: Stop a running server
- Restart: Restart a running server
Image creation Create user Image from the current server’s Image - For detailed Image creation method refer to Image creation
Console Log View current server’s console log - You can check the console logs output by the current server. For more details, refer to Check Console Log.
Dump creation Create a dump of the current server - The dump file is created inside the Virtual Server
- For detailed dump creation method, refer to Dump creation
Rebuild The OS area data and settings of the existing Virtual Server are deleted, and it is configured by rebuilding to a new server - For details, refer to Rebuild Execution
Service termination Button to cancel the service Table. Virtual Server status information and additional functions
Detailed Information
Virtual Server List page, you can view the detailed information of the selected resource and, if necessary, edit the information.
| Category | Detailed description |
|---|---|
| Service | Service Name |
| Resource Type | Resource Type |
| SRN | Unique resource ID in Samsung Cloud Platform
|
| Resource Name | Resource Name
|
| Resource ID | Unique resource ID in the service |
| Creator | User who created the service |
| Creation time | Service creation time |
| Editor | User who edited the service information |
| Modification Date/Time | Date/Time when service information was edited |
| Server Name | Server Name
|
| Server Type | vCPU, Memory Information Display
|
| Image name | Server’s OS Image and version
|
| Lock | Display whether Lock is used or not
|
| Server Group | Name of the server group the server belongs to
|
| Keypair name | Server authentication information set by the user
|
| Planned Compute | Resource status with Planned Compute set
|
| LLM Endpoint | URL for using LLM
|
| ServiceWatch detailed monitoring | Display whether ServiceWatch detailed monitoring is enabled
|
| Network | Network information of Virtual Server
|
| Local Subnet | Local Subnet information of Virtual Server
|
| Block Storage | Information of Block Storage connected to the server
|
Table. Virtual Server Detailed Information Tab Items
Tag
Virtual Server list page allows you to view the tag information of the selected resource, and you can add, modify, or delete it.
| Category | Detailed description |
|---|---|
| Tag List | Tag List
|
Table. Virtual Server Tag Tab Items
Work History
Virtual Server List page allows you to view the operation history of the selected resource.
| Category | Detailed description |
|---|---|
| Work History List | Resource Change History
|
Table. Virtual Server Work History Tab Detailed Information Items
Virtual Server Operation Control
If you need to control the operation of generated Virtual Server resources, you can perform the task on the Virtual Server List or Virtual Server Details page. You can start, stop, and restart a running server.
Virtual Server Start
You can start a shutoff (Shutoff) Virtual Server. To start the Virtual Server, follow the steps below.
- All Services > Compute > Virtual Server Click the menu. Navigate to the Service Home page of Virtual Server.
- Click the Virtual Server menu on the Service Home page. Go to the Virtual Server list page.
- Virtual Server List page, click the resource to start among the stopped (Shutoff) servers, and go to the Virtual Server Details page.
- Virtual Server List page, you can start each resource via the right More button.
- After selecting multiple servers with checkboxes, you can control multiple servers simultaneously via the Start button at the top.
- Click the Start button at the top of the Virtual Server Details page to start the server. Check the changed server status in the Status Display item.
- When the Virtual Server start is completed, the server status changes from Shutoff to Active.
- For more details about Virtual Server status, see Virtual Server Detailed Information Check.
Virtual Server Stop
You can stop a Virtual Server that is active (Active). To stop the Virtual Server, follow the steps below.
- Click the All Services > Compute > Virtual Server menu. Go to the Service Home page of Virtual Server.
- Click the Virtual Server menu on the Service Home page. You will be taken to the Virtual Server List page.
- On the Virtual Server List page, click the resource to stop among the servers that are running (Active), and go to the Virtual Server Details page.
- Virtual Server List page, you can Stop each resource via the right More button.
- After selecting multiple servers with the check box, you can control multiple servers simultaneously using the Stop button at the top.
- Click the Stop button at the top on the Virtual Server Details page to start the server. Check the changed server status in the Status Display item.
- When the Virtual Server shutdown is completed, the server status changes from Active to Shutoff.
- For detailed information about the Virtual Server status, please refer to Check Virtual Server detailed information.
Virtual Server Restart
You can restart the generated Virtual Server. To restart the Virtual Server, follow the steps below.
- Click the All Services > Compute > Virtual Server menu. Go to the Service Home page of Virtual Server.
- Click the Virtual Server menu on the Service Home page. You will be taken to the Virtual Server list page.
- On the Virtual Server List page, click the resource to restart, and navigate to the Virtual Server Details page.
- You can restart each resource via the right More button on the Virtual Server list page.
- After selecting multiple servers with the check box, you can control multiple servers simultaneously via the Restart button at the top.
- Virtual Server Details page, click the Restart button at the top to start the server. Check the status of the changed server in the Status Display item.
- Virtual Server during restart, the server status goes through Rebooting and finally changes to Active.
- For more details about Virtual Server status, refer to Virtual Server Detailed Information Check.
Virtual Server Resource Management
If you need server control and management functions for the generated Virtual Server resources, you can perform tasks on the Virtual Server List or Virtual Server Details page.
Image Create
You can create an image of a running Virtual Server.
Reference
This content provides instructions on how to create a user image with a running Virtual Server.
- Virtual Server List or Virtual Server Detail page, click the Create Image button to create a user Image.
- The method of creating an Image by uploading the Image file you own, please refer to Image Detailed Guide: Creating Image.
To create a Virtual Server’s Image, follow the steps below.
All Services > Compute > Virtual Server Click the menu. Navigate to Virtual Server’s Service Home page.
Click the Virtual Server menu on the Service Home page. Go to the Virtual Server list page.
Virtual Server List page, click the resource to create an Image. Virtual Server Details page, navigate.
Virtual Server Details page, click the Create Image button. It navigates to the Create Image page.
- Service Information Input Enter the required information in the area.
Category RequiredDetailed description Image name Required Name of the Image to create - Enter within 200 characters using English letters, numbers, spaces, and special characters (
-,_)
Table. Image Service Information Input Items - Enter within 200 characters using English letters, numbers, spaces, and special characters (
- Service Information Input Enter the required information in the area.
Check the input information and click the Complete button.
- When creation is complete, check the created resources on the All Services > Compute > Virtual Server > Image List page.
Notice
- When you create an Image, the generated Image is stored in the Object Storage used as internal storage. Therefore, usage fees for Image storage are charged.
- The file system of the Image generated from an Active state Virtual Server cannot guarantee integrity, so it is recommended to stop the server before creating the Image.
Edit Server Type
You can modify the server type of the Virtual Server.
Reference
For the mutable server types provided by Virtual Server, please refer to Virtual Server Server Type.
To modify the server type of a Virtual Server, follow these steps.
- All Services > Compute > Virtual Server Click the menu. Go to the Service Home page of Virtual Server.
- Click the Virtual Server menu on the Service Home page. Go to the Virtual Server list page.
- Virtual Server List page, click the resource to control operation. Move to the Virtual Server Details page.
- Virtual Server Details page, check the server status, and click the Edit button for server type. Server Type Edit popup opens.
- Server Type Modification In the popup window, after changing the server type, click the Confirm button.
- Virtual Server if you modify the server type, Virtual Server status changes to a state related to performing a resize.
- For detailed information about the Virtual Server status, please refer to Check Virtual Server detailed information.
Reference
If you change the Virtual Server type, monitoring performance metric data may not be collected normally for a short period. In the next collection cycle (1 minute), normal performance metrics will be collected.
Change IP
How to change IP, please refer to IP Change.
Caution
- If you proceed with changing the IP, you will no longer be able to communicate with that IP, and you cannot cancel the IP change while it is in progress.
- The server will be rebooted to apply the changed IP.
- If the server is running the Load Balancer service, you must delete the old IP from the LB server group and directly add the changed IP as a member of the LB server group.
- Servers using Public NAT/Private NAT must disable the use of Public NAT/Private NAT after changing the IP and set it again.
- If you are using Public NAT/Private NAT, first disable the use of Public NAT/Private NAT, complete the IP change, and then set it up again.
- Public NAT/Private NAT usage can be changed by clicking the Edit button of Public NAT IP/Private NAT IP on the Virtual Server Details page.
ServiceWatch Enable detailed monitoring
Basically, Virtual Server is linked with ServiceWatch and basic monitoring. As needed, you can enable detailed monitoring to identify operational issues more quickly and take action. For more information about ServiceWatch, see ServiceWatch Overview.
Caution
Basic monitoring is provided for free, but activating detailed monitoring incurs additional charges. Please be aware when using.
To enable detailed monitoring of ServiceWatch on Virtual Server, follow the steps below.
- All Services > Compute > Virtual Server Click the menu. Go to the Service Home page of Virtual Server.
- Click the Virtual Server menu on the Service Home page. Navigate to the Virtual Server list page.
- Virtual Server List page, click the resource to enable detailed ServiceWatch monitoring. Virtual Server Detail page.
- Click the Edit button for ServiceWatch Detailed Monitoring on the Virtual Server Details page. It will navigate to the ServiceWatch Detailed Monitoring Edit popup.
- ServiceWatch Detailed Monitoring Modification in the popup window, after selecting Enable, check the guidance text and click the Confirm button.
- Virtual Server Details page, check the ServiceWatch detailed monitoring items.
ServiceWatch Disable detailed monitoring
Caution
Disabling detailed monitoring is required for cost efficiency. Keep detailed monitoring enabled only when absolutely necessary, and disable detailed monitoring for the rest.
To disable detailed monitoring of ServiceWatch on Virtual Server, follow the steps below.
- All Services > Compute > Virtual Server Click the menu. Go to the Service Home page of Virtual Server.
- Click the Virtual Server menu on the Service Home page. Navigate to the Virtual Server list page.
- Virtual Server List page, click the resource to disable ServiceWatch detailed monitoring. Move to the Virtual Server Details page.
- Click the ServiceWatch detailed monitoring Edit button on the Virtual Server Details page. You will be taken to the ServiceWatch detailed monitoring Edit popup.
- ServiceWatch Detailed Monitoring Modification in the popup window after deselecting Activation, check the guidance text and click the Confirm button.
- Virtual Server Details page, check the ServiceWatch detailed monitoring items.
Virtual Server Management Additional Features
Virtual Server can view console logs, generate dumps, and rebuild for server management. To view console logs, generate dumps, and rebuild the Virtual Server, follow the steps below.
Check console log
You can view the current console log of the Virtual Server.
To check the console log of the Virtual Server, follow the steps below.
- Click the All Services > Compute > Virtual Server menu. Go to the Service Home page of Virtual Server.
- Service Home page, click the Virtual Server menu. Navigate to the Virtual Server list page.
- Virtual Server list page, click the resource to view the console log. It moves to the Virtual Server details page.
- Virtual Server Details page, click the Console Log button. It navigates to the Console Log popup window.
- Console Log Check the console log output in the popup window.
Create Dump
To create a dump file of the Virtual Server, follow the steps below.
- All Services > Compute > Virtual Server Click the menu. Navigate to Virtual Server’s Service Home page.
- Click the Virtual Server menu on the Service Home page. You will be taken to the Virtual Server list page.
- Click the resource to view detailed information on the Virtual Server List page. It navigates to the Virtual Server Details page.
- Click the Create Dump button on the Virtual Server Details page.
- The dump file is created inside the Virtual Server.
Rebuild perform
You can delete the OS area data and settings of the existing Virtual Server and rebuild it as a new server.
To perform a Rebuild of the Virtual Server, follow the steps below.
- All Services > Compute > Virtual Server Click the menu. Go to the Service Home page of Virtual Server.
- Service Home page, click the Virtual Server menu. Navigate to the Virtual Server list page.
- Virtual Server List page, click the resource to perform Rebuild. Move to the Virtual Server Details page.
- Virtual Server Details on the page click the Rebuild button.
- During Virtual Server Rebuild, the server status changes to Rebuilding, and when the Rebuild is completed, it returns to the state before the Rebuild.
- Virtual Server status detailed information, please refer to Virtual Server Check Detailed Information.
Virtual Server Cancel
If you terminate an unused Virtual Server, you can reduce operating costs. However, terminating a Virtual Server may cause the running service to stop immediately, so you should consider the impact of service interruption thoroughly before proceeding with the termination.
Caution
Please note that data cannot be recovered after service termination.
To cancel the Virtual Server, follow the steps below.
- All Services > Compute > Virtual Server Click the menu. Go to the Service Home page of Virtual Server.
- Click the Virtual Server menu on the Service Home page. Navigate to the Virtual Server list page.
- Virtual Server list On the page, select the resource to cancel, and click the Cancel Service button.
- The termination of connected storage depends on the Delete on termination setting, please refer to Termination Constraints.
- When the termination is complete, check on the Virtual Server List page whether the resource has been terminated.
Termination Constraints
Virtual Server termination request cannot be processed, we will guide you with a popup window. Please refer to the cases below.
Cancellation not allowed
- When File Storage is connected: Please disconnect the File Storage first.
- When the LB server group is connected: First disconnect the LB server group pool connection.
- When Lock is set: After changing the Lock setting to disabled, try again.
- When Backup is connected: Please disconnect the Backup connection first.
- If the Auto-Scaling Group attached to the Virtual Server is not in In Service state: After changing the status of the attached Auto-Scaling Group, try again.
Termination of attached storage depends on the Delete on termination setting, please refer to it.
Delete on termination Delete per setting
- Delete on termination The volume deletion also depends on the setting.
- Delete on termination If not set: Even if you terminate the Virtual Server, the volume will not be deleted.
- Delete on termination when set: If the Virtual Server is terminated, the volume will be deleted.
- Volumes that have a Snapshot will not be deleted even if Delete on termination is set.
- Multi attach volume will be deleted only when the server being deleted is the last remaining server attached to the volume.
1.2.1 - Image
The user can enter the required information for the Image service within the Virtual Server service and select detailed options through the Samsung Cloud Platform Console to create the service.
Image generation
You can create and use the Image service while using the Virtual Server service on the Samsung Cloud Platform Console.
To create an Image, follow the steps below.
Click the All Services > Compute > Virtual Server menu. Go to the Virtual Server’s Service Home page.
Click the Image menu on the Service Home page. Go to the Image List page.
Click the Image Create button on the Image List page. It navigates to the Image Create page.
- Service Information Input Enter or select the required information in the area.
Category RequiredDetailed description Image name Required Name of the Image to create - Enter within 255 characters using English letters, numbers, spaces, and special characters (
-,_)
Image file > URL Required Enter URL after uploading Image file to Object Storage - Object Storage Details page allows copying URL
- The Bucket of Object Storage where the Image file is uploaded must be in the same zone as the server to be created
- Image file can only have .qcow2 extension
- Upload a secure Image file to minimize security risks.
OS type Required OS type of the uploaded Image file - Select from Alma Linux, CentOS, Oracle Linux, RHEL, Rocky Linux, Ubuntu
Minimum Disk Required Minimum disk size (GB) for the Image to be created - Enter a value between
0and12,288GB
Minimum RAM Required Minimum RAM capacity (GB) of the image to be created - Enter a value between
0and2,097,151GB
Visibility Required Indicates access permissions for the Image - Private: Can be used only within the Account
- Shared: Can be shared between Accounts
Protected Select Select whether Image deletion is prohibited - Checking Use prevents accidental deletion of the Image
- This setting can be changed after Image creation
Table. Image Service Information Input Items - Enter within 255 characters using English letters, numbers, spaces, and special characters (
- Additional Information Input Enter or select the required information in the area.
Category RequiredDetailed description Tag Select Add Tag - Up to 50 can be added per resource
- After clicking the Add Tag button, enter or select Key, Value values
Table. Image additional information input items
- Service Information Input Enter or select the required information in the area.
Summary Check the detailed information and estimated billing amount generated in the panel, and click the Complete button.
- When creation is complete, check the created resources on the Image List page.
Image Check detailed information
Image service can view and edit the full resource list and detailed information. Image detail page consists of detailed information, tags, operation history tabs.
To view detailed information of the Image service, follow the steps below.
- All Services > Compute > Virtual Server Click the menu. Go to the Service Home page of Virtual Server.
- Click the Image menu on the Service Home page. Go to the Image list page.
- Image List page, click the resource to view detailed information. Image Details page will be opened.
- Image Details page displays status information and additional feature information, and consists of Detail Information, Tag, Work History tabs.
Category Detailed description Image status Status of the Image created by the user - Active: Available
- Queued: When an Image creation request is made, the Image is uploaded and waiting for processing
- Importing: When an Image creation request is made, the Image is uploaded and being processed
Create shared Image Create Image to share with another Account - Can be created only when the Image’s Visibility is private and the Image has snapshot information
Share with another Account Image can be shared with another Account - If the Image’s Visibility is Shared, it can be shared with another Account
- Only displayed for Images created by Create shared Image or by uploading a qcow2 file
Image Delete Button to delete the Image - If the Image is deleted, it cannot be recovered
Table. Image status information and additional functions
- Image Details page displays status information and additional feature information, and consists of Detail Information, Tag, Work History tabs.
Detailed Information
Image list page allows you to view detailed information of the selected resource and edit the information if needed.
| Category | Detailed description |
|---|---|
| Service | Service Name |
| Resource Type | Resource Type |
| SRN | Unique resource ID in Samsung Cloud Platform
|
| Resource Name | Image Name |
| Resource ID | Image’s unique resource ID |
| Creator | User who created the Image |
| Creation time | Image creation time |
| Editor | User who modified the Image information |
| Modification Date | Date/Time when Image information was modified |
| Image name | Image name |
| Minimum Disk | Image’s minimum disk capacity (GB)
|
| Minimum RAM | Minimum RAM capacity of the Image (GB) |
| OS type | Image’s OS type
|
| OS hash algorithm | OS hash algorithm method |
| Visibility | Displays access permissions for the Image
|
| Protected | Select whether image deletion is prohibited
|
| Image size | Image size
|
| Image Type | Classification by Image creation method
|
| Image file URL | Image file URL uploaded to Object Storage when creating an Image
|
| Sharing Status | Status of sharing images with other Accounts
|
Table. Image detailed information tab items
Tag
Image list page, you can view the tag information of the selected resource, and you can add, modify, or delete it.
| Category | Detailed description |
|---|---|
| Tag List | Tag List
|
Table. Image tag tab items
Work History
You can view the operation history of the selected resource on the Image list page.
| Category | Detailed description |
|---|---|
| Work History List | Resource Change History
|
Table. Image work history tab detailed information items
Image Resource Management
Describes the control and management functions of the generated Image.
Create Image for Sharing
Create an Image to share with another Account.
Notice
- Image’s Visibility is private and only when the Image has snapshot information can a shared Image be created.
- Shared Image includes only one OS area disk volume as the imaging target. Additionally, connected data volumes are not included in the Image, so if needed, please copy the data to a separate volume and use the volume migration function.
To create an image for sharing, follow the steps below.
- Log in to the shared Account and click the All Services > Compute > Virtual Server menu. Go to the Virtual Server’s Service Home page.
- Click the Image menu on the Service Home page. Navigate to the Image List page.
- Click the Image to create a shared Image on the Image List page. You will be taken to the Image Details page.
- Create Shared Image Click the button. A popup window notifying the creation of a shared Image will open.
- After checking the notification content, click the Complete button.
Share Image to another Account
Create an image to share with another Account.
Notice
- .qcow2 extension file uploaded to create, or only Images created via Image Details page with Create Shared Image can be shared with other Accounts.
- The Image to be shared must have Visibility set to Shared.
To share the Image with another Account, follow these steps.
Log in to the shared Account and click the All Services > Compute > Virtual Server menu. Navigate to the Virtual Server’s Service Home page.
Click the Image menu on the Service Home page. It navigates to the Image List page.
On the Image List page, click the Image you want to share with another Account. It moves to the Image Details page.
Click the Share to another Account button. A popup window notifying Image sharing opens.
After checking the notification content, click the Confirm button. It moves to the Share Image with another Account page.
Share Image with another Account on the page, enter Share Account ID, and click the Complete button. A popup notifying Image sharing opens.
Category RequiredDetailed description Image name - Name of the Image to share - Input not allowed
Image ID - Image ID to share - Input not allowed
Shared Account ID Required Enter another Account ID to share - Enter within 64 characters using English letters, numbers, and special character
-
Table. Image sharing items to another AccountAfter checking the notification content, click the Confirm button. You can check the information in the sharing status of the Image Details page.
- When first requested, the status is Pending, and when approval is completed by the Account to be shared, it changes to Accepted, and if approval is denied, it changes to Rejected.
Receive shared Image from another Account
To receive an Image shared from another Account, follow the steps below.
Log in to the account to be shared and click the All Services > Compute > Virtual Server menu. Go to the Service Home page of the Virtual Server.
Click the Image menu on the Service Home page. It navigates to the Image List page.
Image List on the page More > Image Share Request List click the button. Image Share Request List popup opens.
Image Sharing Request List In the popup window, click the Approve or Reject button for the Image to be shared.
Category Detailed description Image name shared Image name OS type OS type of shared Image Owner Account ID Owner Account ID of shared Image Creation time Creation time of shared Image Approval Approve the shared Image Reject Reject processing of the shared Image Table. Image sharing request list itemAfter checking the notification content, click the Confirm button. You can check the shared Image in the Image list.
Image Delete
You can delete unused images. However, once an image is deleted it cannot be recovered, so you should fully consider the impact before proceeding with the deletion.
Caution
Please be careful as data cannot be recovered after deleting the service.
To delete Image, follow the steps below.
- All Services > Compute > Virtual Server Click the menu. Navigate to the Service Home page of Virtual Server.
- Click the Image menu on the Service Home page. Go to the Image list page.
- Image list 페이지에서 삭제할 자원을 선택하고, Delete 버튼을 클릭하세요.
- Image list page, select multiple Image check boxes, and click the Delete button at the top of the resource list.
- When deletion is complete, check on the Image List page whether the resource has been deleted.
1.2.2 - Keypair
The user can create the service by entering the required information of the Keypair in the Virtual Server service through the Samsung Cloud Platform Console and selecting detailed options.
Create Keypair
You can use the Virtual Server service while using the Samsung Cloud Platform Console and create and use the Keypair service.
To create a key pair, follow these steps.
- Click All Services > Compute > Virtual Server menu. It moves to the Service Home page of Virtual Server.
- Service Home page, click the Keypair menu. It moves to the Keypair list page.
- Keypair list page, click the Create Keypair button. Move to the Create Keypair page.
- Enter Service Information area, please enter the necessary information.
Classification NecessityDetailed Description Keypair name Required Name of the Keypair to be created - Enter within 255 characters using English, numbers, spaces, and special characters (
-,_)
Keypair type mandatory ssh Table. Keypair service information input items - Enter within 255 characters using English, numbers, spaces, and special characters (
- Enter Additional Information Enter or select the required information in the area.
Classification NecessityDetailed Description Tag Selection Add Tag - Up to 50 can be added per resource
- Click the Add Tag button and enter or select Key, Value
Table. Input items for adding Keypair informationCaution- After creation is complete, you can download the Key only once for the first time. Since re-issuance is not possible, please check if it has been downloaded.
- Please store the downloaded Private Key in a safe place.
- Enter Service Information area, please enter the necessary information.
- Check the input information and click the Complete button.
- Once creation is complete, check the created resource on the Keypair list page.
Check Keypair Details
The Keypair service allows you to view and modify the list of all resources and detailed information. The Keypair details page consists of details, tags, and operation history tabs.
To check the Keypair details, follow the following procedure.
- All services > Compute > Virtual Server menu is clicked. It moves to the Service Home page of Virtual Server.
- Service Home page, click the Keypair menu. It moves to the Keypair list page.
- Keypair list page, click on the resource to check the detailed information. Move to the Keypair details page.
- Keypair Details page displays status information and additional feature information, and consists of Details, Tags, Operation History tabs.
Detailed Information
On the Keypair list page, you can check the detailed information of the selected resource and modify the information if necessary.
| Classification | Detailed Description |
|---|---|
| Service | Service Name |
| Resource Type | Resource Type |
| SRN | Unique resource ID in Samsung Cloud Platform
|
| Resource Name | Keypair Name |
| Resource ID | Keypair’s unique resource ID |
| Creator | User who created the Keypair |
| Creation Time | Time when Keypair was created |
| Modifier | User who modified Keypair information |
| Modified Time | Time when Keypair information was modified |
| Keypair name | Keypair name |
| Fingerprint | A unique value to identify the Key |
| User ID | Keypair creation user ID |
| Public Key | Public Key Information |
Table. Keypair detailed information tab items
Tag
On the Keypair List page, you can check the tag information of the selected resource, and add, change, or delete it.
| Classification | Detailed Description |
|---|---|
| Tag List | Tag list
|
Table. Keypair tags tab items
Work History
Keypair list page where you can check the operation history of the selected resource.
| Classification | Detailed Description |
|---|---|
| Work history list | Resource change history
|
Fig. Keypair job history tab detailed information items
Managing Keypair Resources
Describes the control and management functions of the Keypair.
Get Public Key
To import a public key, follow these steps.
Click All services > Compute > Virtual Server menu. It moves to the Service Home page of Virtual Server.
Service Home page, click the Keypair menu. It moves to the Keypair list page.
On the Keypair list page, click the More button at the top and then click the Import Public Key button. This will move to the Import Public Key page.
- Required Information Input Enter or select the necessary information in the required information input area.
Classification NecessityDetailed Description Keypair name Required Name of Keypair to be created Keypair type required ssh Public Key Required Public Key Input - File Upload: File Attach button to attach public key file
- Attached file only allows .pem file extension
- Public Key Input: Paste the copied public key value
- Public key value can be copied from Keypair Details page
Table. Essential Input Items for Public Key Import - File Upload: File Attach button to attach public key file
- Required Information Input Enter or select the necessary information in the required information input area.
Check the entered information and click the Complete button.
- Once creation is complete, check the created resource on the Keypair list page.
Delete Keypair
You can delete unused Keypairs. However, since deleted Keypairs cannot be recovered, please proceed with deletion after reviewing the impact in advance.
Caution
Please be careful after deleting the service, as the data cannot be recovered.
To delete a key pair, follow these steps.
- All services > Compute > Virtual Server menu, click. Move to the Service Home page of Virtual Server.
- On the Service Home page, click the Keypair menu. It moves to the Keypair list page.
- Keypair list page, select the resource to be deleted, and click the Delete button. On the * Keypair list page, select multiple Keypair check boxes and click the Delete button at the top of the resource list.
- After deletion is complete, check the Keypair list page to see if the resource has been deleted.
1.2.3 - Server Group
Users can enter the required information for a Server Group within the Virtual Server service and select detailed options through the Samsung Cloud Platform Console to create the service.
Server Group Create
You can create and use the Server Group service while using the Virtual Server service in the Samsung Cloud Platform Console.
To create a Server Group, follow the steps below.
- Click the All Services > Compute > Virtual Server menu. Go to the Service Home page of Virtual Server.
- Click the Server Group menu on the Server Group page. Go to the Server Group list page.
- Server Group List on the page, click the Server Group Create button. Navigate to the Server Group Create page.
- Service Information Input area, enter or select the required information.
Category RequiredDetailed description Server Group name Required Name of the Server Group to create - Enter within 255 characters using English letters, numbers, spaces, and special characters (
-,_)
Policy Required Set Anti-Affinity (distributed placement), Affinity (proximate placement), Partition (distributed placement of Virtual Server and Block Storage) for Virtual Servers belonging to the same Server Group - Anti-Affinity (distributed placement) and Affinity (proximate placement) policies place Virtual Servers belonging to the same Server Group based on the selected policy in a Best Effort manner, but are not absolutely guaranteed.
- Anti-Affinity (distributed placement): A policy that places servers belonging to a Server Group on different racks and hosts as much as possible
- Affinity (proximate placement): A policy that places servers belonging to a Server Group close together within the same rack and host as much as possible
- Partition (distributed placement of Virtual Server and Block Storage): A policy that places Virtual Servers belonging to a Server Group and the Block Storage connected to those servers in different distribution units (Partitions)
- The Partition (distributed placement of Virtual Server and Block Storage) policy displays the Partition number together so that it is clear which Partition each Virtual Server and its associated Block Storage belong to.
- Partition numbers are assigned based on the Partition Size (up to 3) set for the Server Group.
Table. Server Group Service Information Input Items - Enter within 255 characters using English letters, numbers, spaces, and special characters (
- Add Information Input area, enter or select the required information.
Category RequiredDetailed description Tag Select Add Tag - Up to 50 can be added per resource
- After clicking the Add Tag button, enter or select Key, Value values
Table. Server Group Additional Information Input Items
- Service Information Input area, enter or select the required information.
- Check the input information and click the Complete button.
- When creation is complete, check the created resources on the Server Group List page.
Server Group View detailed information
Server Group service can view and edit the full resource list and detailed information. Server Group Details page consists of Details, Tags, Activity Log tabs.
To view detailed information of the Server Group, follow the steps below.
- Click the All Services > Compute > Virtual Server menu. Go to the Service Home page of Virtual Server.
- Click the Server Group menu on the Service Home page. You will be taken to the Server Group List page.
- Click the resource to view detailed information on the Server Group List page. It navigates to the Server Group Details page.
- Server Group Details page displays status information and additional feature information, and consists of Details, Tags, Activity History tabs.
Detailed Information
On the Server Group List page, you can view detailed information of the selected resource and, if necessary, edit the information.
| Category | Detailed description |
|---|---|
| Service | Service Name |
| Resource Type | Resource Type |
| SRN | Unique resource ID in Samsung Cloud Platform
|
| Resource Name | Server Group Name |
| Resource ID | Unique resource ID of Server Group |
| Creator | User who created the Server Group |
| Creation time | Server Group creation time |
| Server Group name | Server Group name |
| Policy | Anti-Affinity(distributed placement), Affinity(proximal placement), Partition(distributed placement of Virtual Server and Block Storage) |
| Server Group Member | List of Virtual Servers belonging to the Server Group
|
Table. Server Group detailed information tab items
Tag
Server Group List page you can view the tag information of the selected resource, and you can add, modify, or delete it.
| Category | Detailed description |
|---|---|
| Tag List | Tag List
|
Table. Server Group Tag Tab Items
Work History
You can view the operation history of the selected resource on the Server Group List page.
| Category | Detailed description |
|---|---|
| Work History List | Resource Change History
|
Table. Server Group Task History Tab Detailed Information Items
Server Group Delete
You can delete unused Server Groups. However, once a Server Group is deleted it cannot be recovered, so please review the impact thoroughly in advance before proceeding with deletion.
Caution
Please be careful as data cannot be recovered after deleting the service.
To delete a Server Group, follow these steps.
- All Services > Compute > Virtual Server menu, click it. Go to the Virtual Server’s Service Home page.
- On the Service Home page, click the Server Group menu. Navigate to the Server Group List page.
- Server Group list On the page, select the resource to delete, and click the Delete button.
- Server Group list on the page select multiple Server Group check boxes, and click the Delete button at the top of the resource list.
- When deletion is complete, check whether the resource has been deleted on the Server Group list page.
1.2.4 - IP Change
You can change the IP of the Virtual Server and add network ports to the Virtual Server to set the IP.
IP Change
You can change the IP of the Virtual Server.
Caution
- If you proceed with changing the IP, you will no longer be able to communicate with that IP, and you cannot cancel the IP change while it is in progress.
- The server will be rebooted to apply the changed IP.
- If the server is running the Load Balancer service, you must delete the existing IP from the LB server group and directly add the changed IP as a member of the LB server group.
- Servers using Public NAT/Private NAT must disable and reconfigure Public NAT/Private NAT after changing the IP.
- If you are using Public NAT/Private NAT, first disable the use of Public NAT/Private NAT, complete the IP change, and then set it again.
- Whether to use Public NAT/Private NAT can be changed by clicking the Edit button of Public NAT IP/Private NAT IP on the Virtual Server Details page.
To change the IP, follow the steps below.
- All Services > Compute > Virtual Server Click the menu. Navigate to the Service Home page of Virtual Server.
- Click the Virtual Server menu on the Service Home page. Move to the Virtual Server List page.
- Virtual Server List Click the resource to change the IP on the page. Navigate to the Virtual Server Details page.
- Virtual Server Details page, click the Edit button of the IP item to change the IP. The IP Edit popup opens.
- Edit IP In the popup window, after selecting Subnet, set the IP to change.
- Input: Enter the IP to be changed directly.
- Automatic Generation: Automatically generate the IP and apply it.
- When the settings are complete, click the Confirm button.
- When the popup notifying IP modification opens, click the Confirm button.
Setting IP on the server after adding network ports
If you create a Virtual Server with Ubuntu Linux, after adding a network port on Samsung Cloud Platform, additional IP configuration is required on the server.
As the root user of the Virtual Server’s OS, use the ip command to check the assigned network interface name.
Color modeip aip aCode block. ip command - network interface check command - If there is an added interface, the following result is displayed.
Color mode[root@scp-test-vm-01 ~] # ip a 3: ens7: <BROADCAST,MULTICAST> mtu 9000 qdisc noop state DOWN group default qlen 1000 link/ether fa:16:3e:98:b6:64 brd ff:ff:ff:ff:ff:ff altname enp0s7[root@scp-test-vm-01 ~] # ip a 3: ens7: <BROADCAST,MULTICAST> mtu 9000 qdisc noop state DOWN group default qlen 1000 link/ether fa:16:3e:98:b6:64 brd ff:ff:ff:ff:ff:ff altname enp0s7Code block. ip command - Network interface check result Use a text editor (e.g., vim) to open the /etc/netplan/50-cloud-init.yaml file.
Add the following content to the /etc/netplan/50-cloud-init.yaml file and save it.
Color modenetwork: version: 2 ethernets: ens7: match: macaddress: "fa:16:3e:98:b6:64" dhcp4: true set-name: "ens7" mtu: 9000network: version: 2 ethernets: ens7: match: macaddress: "fa:16:3e:98:b6:64" dhcp4: true set-name: "ens7" mtu: 9000Code block. Edit YAML file
Reference
Indentation is important in YAML files that configure netplan. When modifying a YAML file, please refer to the existing settings and be careful.
Set the IP on the added network DEVICE using the netplan command.
Color modenetplan --debug applynetplan --debug applyCode block. netplan applied Use the ip command to verify that the IP is set correctly.
Color mode[root@scp-test-vm-01 ~] # ip a 3: ens7: <BROADCAST,MULTICAST> mtu 9000 qdisc noop state DOWN group default qlen 1000 link/ether fa:16:3e:98:b6:64 brd ff:ff:ff:ff:ff:ff altname enp0s7 inet 10.10.10.10/24 metric 100 brd 10.10.10.255 scope global dynamic ens7 valid_lft 43197sec preferred_lft 43197sec inet6 fe80::f816:3eff:fe0a:96bf/64 scope link valid_lft forever preferred_lft forever[root@scp-test-vm-01 ~] # ip a 3: ens7: <BROADCAST,MULTICAST> mtu 9000 qdisc noop state DOWN group default qlen 1000 link/ether fa:16:3e:98:b6:64 brd ff:ff:ff:ff:ff:ff altname enp0s7 inet 10.10.10.10/24 metric 100 brd 10.10.10.255 scope global dynamic ens7 valid_lft 43197sec preferred_lft 43197sec inet6 fe80::f816:3eff:fe0a:96bf/64 scope link valid_lft forever preferred_lft foreverCode block. Check IP settings
1.2.5 - Linux NTP Setting
If a user creates a Virtual Server with Rocky Linux or Oracle Linux via the Samsung Cloud Platform Console, additional configuration is required for time synchronization (NTP: Network Time Protocol). For other OS standard Linux images (RHEL, Alma Linux, Ubuntu), NTP is already configured, so no additional setup is needed.
Install NTP Daemon
You can install the chrony daemon to configure NTP. To install the chrony daemon, follow the steps below.
Reference
For detailed information about chrony, please refer to the chronyc page.
Check whether the chrony package is installed using the dnf command as the root user of the OS of the Virtual Server.
Color modednf list chronydnf list chronyCode block. dnf command - chrony package installation verification command - chrony If the chrony package is installed, the following result is displayed.
Color mode[root@scp-test-vm-01 ~] # dnf list chrony Last metadata expiration check: 1:47:29 ago on Wed 19 Feb 2025 05:55:57 PM KST. Installed Packages chrony.x86_64 3.5-1.0.1.el8 @anaconda[root@scp-test-vm-01 ~] # dnf list chrony Last metadata expiration check: 1:47:29 ago on Wed 19 Feb 2025 05:55:57 PM KST. Installed Packages chrony.x86_64 3.5-1.0.1.el8 @anacondaCode block. dnf command - chrony package installation verification result If the chrony package is not installed, use the dnf command to install the chrony package.
Color modednf install chrony -ydnf install chrony -yCode block. dnf command - chrony package installation verification command
NTP Daemon Setup
Reference
For detailed information about chrony, refer to the chronyc page.
To set up the chrony daemon, follow these steps.
Load the /etc/chrony.conf file using a text editor (e.g., vim).
Add the following content to the /etc/chrony.conf file and save.
Color modeserver 198.19.0.54 iburstserver 198.19.0.54 iburstCode block. /etc/chrony.conf edit Set it to automatically start the chrony daemon using the systemctl command.
Color modesystemctl enable chronydsystemctl enable chronydCode block. systemctl command - chrony daemon auto start setting Restart the chrony daemon using the systemctl command.
Color modesystemctl restart chronydsystemctl restart chronydCode block. systemctl command - restart chrony daemon Run the chronyc sources command with the “v” option (display detailed information) to check the IP address of the configured NTP server and verify whether synchronization is in progress.
Color modechronyc sources -vchronyc sources -vCode block. chronyc sources command - NTP synchronization check - When you run the chronyc sources command, the following result is displayed.
Color mode[root@scp-test-vm-01 ~] # chronyc sources -v 210 Number of sources = 1 .-- Source mode '^' = server, '=' = peer, '#' = local clock. / .- Source state '*' = current synced, '+' = combined , '-' = not combined, | / '?' = unreachable, 'x' = time may be in error, '~' = time too variable. || .- xxxx [ yyyy ] +/- zzzz || Reachability register (octal) -. | xxxx = adjusted offset, || Log2(Polling interval) --. | | yyyy = measured offset, || \ | | zzzz = estimated error. || | | \ MS Name/IP address Stratum Poll Reach LastRx Last sample ========================================================================= ^* 198.19.0.54 2 6 377 52 -129us[ -128us] +/- 14ms[root@scp-test-vm-01 ~] # chronyc sources -v 210 Number of sources = 1 .-- Source mode '^' = server, '=' = peer, '#' = local clock. / .- Source state '*' = current synced, '+' = combined , '-' = not combined, | / '?' = unreachable, 'x' = time may be in error, '~' = time too variable. || .- xxxx [ yyyy ] +/- zzzz || Reachability register (octal) -. | xxxx = adjusted offset, || Log2(Polling interval) --. | | yyyy = measured offset, || \ | | zzzz = estimated error. || | | \ MS Name/IP address Stratum Poll Reach LastRx Last sample ========================================================================= ^* 198.19.0.54 2 6 377 52 -129us[ -128us] +/- 14msCode block. chronyc sources command - NTP synchronization check Run the chronyc tracking command to check the synchronization metrics.
Color mode[root@scp-test-vm-01 ~] # chronyc tracking Reference ID : A9FEA9FE (198.19.0.54) Stratum : 3 Ref time (UTC) : Wed Feb 19 18:48:41 2025 System time : 0.000000039 seconds fast of NTP time Last offset : -0.000084246 seconds RMS offset : 0.000084246 seconds Frequency : 21.667 ppm slow Residual freq : +4.723 ppm Skew : 0.410 ppm Root delay : 0.000564836 seconds Root dispersion : 0.027399288 seconds Update interval : 2.0 seconds Leap status : Normal[root@scp-test-vm-01 ~] # chronyc tracking Reference ID : A9FEA9FE (198.19.0.54) Stratum : 3 Ref time (UTC) : Wed Feb 19 18:48:41 2025 System time : 0.000000039 seconds fast of NTP time Last offset : -0.000084246 seconds RMS offset : 0.000084246 seconds Frequency : 21.667 ppm slow Residual freq : +4.723 ppm Skew : 0.410 ppm Root delay : 0.000564836 seconds Root dispersion : 0.027399288 seconds Update interval : 2.0 seconds Leap status : NormalCode block. chronyc tracking command - NTP synchronization metric
1.2.6 - Setting up RHEL Repo and WKMS
Notice
- If the user created RHEL and Windows Server prior to August 2025 via the Samsung Cloud Platform Console, they need to modify the RHEL Repository and WKMS (Windows Key Management Service) settings.
- The SCP RHEL Repository is a repository provided by SCP to support user environments such as VPC Private Subnet where external access is restricted.
Since the SCP RHEL Repository synchronizes with each Region Local Repository according to the internal schedule, it is recommended to switch to an external Public Mirror site to quickly apply the latest patches.
RHEL Repository Configuration Guide
In Samsung Cloud Platform, when using RHEL, you can install and download the same packages as the official RHEL Repository by utilizing the RHEL Repository provided by SCP.
SCP provides the latest version of the repository for the given major version by default. To set up the RHEL repository, follow the steps below.
Using the root user of the Virtual Server’s OS, use the cat command to check the
/etc/yum.repos.d/scp.rhel8.repoor/etc/yum.repos.d/scp.rhel9.reposettings.Color modecat /etc/yum.repos.d/scp.rhel8.repocat /etc/yum.repos.d/scp.rhel8.repoCode block. repo configuration check (RHEL8) Color modecat /etc/yum.repos.d/scp.rhel9.repocat /etc/yum.repos.d/scp.rhel9.repoCode block. repo configuration check (RHEL9) - When checking the configuration file, the following result is displayed.Color mode
[rhel-8-baseos] name=rhel-8-baseos gpgcheck=0 enabled=1 baseurl=http://scp-rhel8-ip/rhel/8/baseos [rhel-8-baseos-debug] name=rhel-8-baseos-debug gpgcheck=0 enabled=1 baseurl=http://scp-rhel8-ip/rhel/8/baseos-debug [rhel-8-appstream] name=rhel-8-appstream gpgcheck=0 enabled=1 baseurl=http://scp-rhel8-ip/rhel/8/appstream[rhel-8-baseos] name=rhel-8-baseos gpgcheck=0 enabled=1 baseurl=http://scp-rhel8-ip/rhel/8/baseos [rhel-8-baseos-debug] name=rhel-8-baseos-debug gpgcheck=0 enabled=1 baseurl=http://scp-rhel8-ip/rhel/8/baseos-debug [rhel-8-appstream] name=rhel-8-appstream gpgcheck=0 enabled=1 baseurl=http://scp-rhel8-ip/rhel/8/appstreamCode block. Check repo settings (RHEL8) Color mode[rhel-9-for-x86_64-baseos-rpms] name=rhel-9-for-x86_64-baseos-rpms baseurl=http://scp-rhel9-ip/rhel/$releasever/x86_64/baseos gpgcheck=0 enabled=1 [rhel-9-for-x86_64-appstream-rpms] name=rhel-9-for-x86_64-appstream-rpms baseurl=http://scp-rhel9-ip/rhel/$releasever/x86_64/appstream gpgcheck=0 enabled=1 [codeready-builder-for-rhel-9-x86_64-rpms] name=codeready-builder-for-rhel-9-x86_64-rpms baseurl=http://scp-rhel9-ip/rhel/$releasever/x86_64/codeready-builder gpgcheck=0 enabled=1 [rhel-9-for-x86_64-highavailability-rpms] name=rhel-9-for-x86_64-highavailability-rpms baseurl=http://scp-rhel9-ip/rhel/$releasever/x86_64/ha gpgcheck=0 enabled=1 [rhel-9-for-x86_64-supplementary-rpms] name=rhel-9-for-x86_64-supplementary-rpms baseurl=http://scp-rhel9-ip/rhel/$releasever/x86_64/supplementary gpgcheck=0 enabled=1[rhel-9-for-x86_64-baseos-rpms] name=rhel-9-for-x86_64-baseos-rpms baseurl=http://scp-rhel9-ip/rhel/$releasever/x86_64/baseos gpgcheck=0 enabled=1 [rhel-9-for-x86_64-appstream-rpms] name=rhel-9-for-x86_64-appstream-rpms baseurl=http://scp-rhel9-ip/rhel/$releasever/x86_64/appstream gpgcheck=0 enabled=1 [codeready-builder-for-rhel-9-x86_64-rpms] name=codeready-builder-for-rhel-9-x86_64-rpms baseurl=http://scp-rhel9-ip/rhel/$releasever/x86_64/codeready-builder gpgcheck=0 enabled=1 [rhel-9-for-x86_64-highavailability-rpms] name=rhel-9-for-x86_64-highavailability-rpms baseurl=http://scp-rhel9-ip/rhel/$releasever/x86_64/ha gpgcheck=0 enabled=1 [rhel-9-for-x86_64-supplementary-rpms] name=rhel-9-for-x86_64-supplementary-rpms baseurl=http://scp-rhel9-ip/rhel/$releasever/x86_64/supplementary gpgcheck=0 enabled=1Code block. Check repo settings (RHEL9)
- When checking the configuration file, the following result is displayed.
Use a text editor (e.g., vim) to open the
/etc/hostsfile./etc/hostsModify the file with the content below and save.Color mode198.19.2.13 scp-rhel8-ip scp-rhel9-ip scp-rhel-ip198.19.2.13 scp-rhel8-ip scp-rhel9-ip scp-rhel-ipCode block. /etc/hosts file setting change Verify the RHEL Repository connection configured on the server using the yum command.
Color modeyum repolist –vyum repolist –vCode block. repository connection settings check - If the RHEL Repository is successfully connected, you can check the Repository list.Color mode
Repo-id            : rhel-8-appstream
Repo-name          : rhel-8-appstream
Repo-revision      : 1718903734
Repo-updated       : Fri 21 Jun 2024 02:15:34 AM KST
Repo-pkgs          : 38,260
Repo-available-pkgs: 25,799
Repo-size          : 122 G
Repo-baseurl       : http://scp-rhel8-ip/rhel/8/appstream
Repo-expire        : 172,800 second(s) (last: Thu 08 Aug 2024 07:27:57 AM KST)
Repo-filename      : /etc/yum.repos.d/scp.rhel8.repo

Repo-id            : rhel-8-baseos
Repo-name          : rhel-8-baseos
Repo-revision      : 1718029433
Repo-updated       : Mon 10 Jun 2024 11:23:52 PM KST
Repo-pkgs          : 17,487
Repo-available-pkgs: 17,487
Repo-size          : 32 G
Repo-baseurl       : http://scp-rhel8-ip/rhel/8/baseos
Repo-expire        : 172,800 second(s) (last: Thu 08 Aug 2024 07:27:57 AM KST)
Repo-filename      : /etc/yum.repos.d/scp.rhel8.repo

Repo-id            : rhel-8-baseos-debug
Repo-name          : rhel-8-baseos-debug
Repo-revision      : 1717662461
Repo-updated       : Thu 06 Jun 2024 05:27:41 PM KST
Repo-pkgs          : 17,078
Repo-available-pkgs: 17,078
Repo-size          : 100 G
Repo-baseurl       : http://scp-rhel8-ip/rhel/8/baseos-debug
Repo-expire        : 172,800 second(s) (last: Thu 08 Aug 2024 07:27:57 AM KST)
Repo-filename      : /etc/yum.repos.d/scp.rhel8.repo
Repo-id : rhel-8-appstream Repo-name : rhel-8-appstream Repo-revision : 1718903734 Repo-updated : Fri 21 Jun 2024 02:15:34 AM KST Repo-pkgs : 38,260 Repo-available-pkgs: 25,799 Repo-size : 122 G Repo-baseurl : http://scp-rhel8-ip/rhel/8/appstream Repo-expire : 172,800 second(s) (last: Thu 08 Aug 2024 07:27:57 AM KST) Repo-filename : /etc/yum.repos.d/scp.rhel8.repo Repo-id : rhel-8-baseos Repo-name : rhel-8-baseos Repo-revision : 1718029433 Repo-updated : Mon 10 Jun 2024 11:23:52 PM KST Repo-pkgs : 17,487 Repo-available-pkgs: 17,487 Repo-size : 32 G Repo-baseurl : http://scp-rhel8-ip/rhel/8/baseos Repo-expire : 172,800 second(s) (last: Thu 08 Aug 2024 07:27:57 AM KST) Repo-filename : /etc/yum.repos.d/scp.rhel8.repo Repo-id : rhel-8-baseos-debug Repo-name : rhel-8-baseos-debug Repo-revision : 1717662461 Repo-updated : Thu 06 Jun 2024 05:27:41 PM KST Repo-pkgs : 17,078 Repo-available-pkgs: 17,078 Repo-size : 100 G Repo-baseurl : http://scp-rhel8-ip/rhel/8/baseos-debug Repo-expire : 172,800 second(s) (last: Thu 08 Aug 2024 07:27:57 AM KST) Repo-filename : /etc/yum.repos.d/scp.rhel8.repoCode block. Repository list check
- If the RHEL Repository is successfully connected, you can check the Repository list.
Windows Key Management Service Configuration Guide
In Samsung Cloud Platform, when using Windows Server, you can authenticate genuine products by using the Key Management Service provided by SCP. Follow the steps below.
After right-clicking the Windows Start icon, please run cmd from Windows PowerShell (Administrator) or the Windows Run menu.
Windows PowerShell (administrator) or in cmd, please run the command below to register the KMS Server.
Color modeslmgr /skms 198.19.2.23:1688slmgr /skms 198.19.2.23:1688Code block. WKMS Settings After executing the KMS Server registration command, check the notification popup indicating successful registration, then click OK.
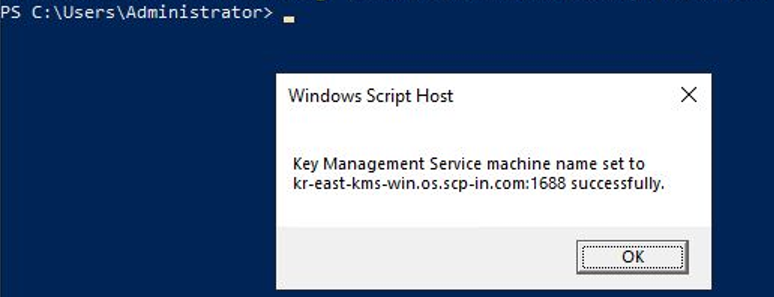
Figure. WKMS setting check Windows PowerShell (Administrator) or in cmd, please execute the command below to perform product activation.
Color modeslmgr /atoslmgr /atoCode block. Windows Server activation settings After confirming the notification popup that the product activation was successful, click OK.
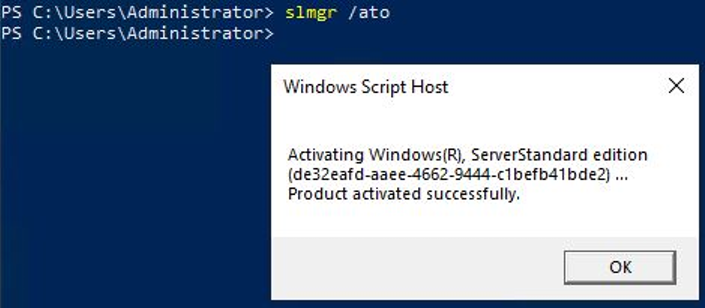
Figure. Windows Server genuine activation verification Windows PowerShell (Administrator) or cmd, run the command below to check if it has been activated.
Color modeslmgr /dlvslmgr /dlvCode block. Windows Server genuine activation verification After confirming the notification popup that the product activation was successfully performed, click OK.
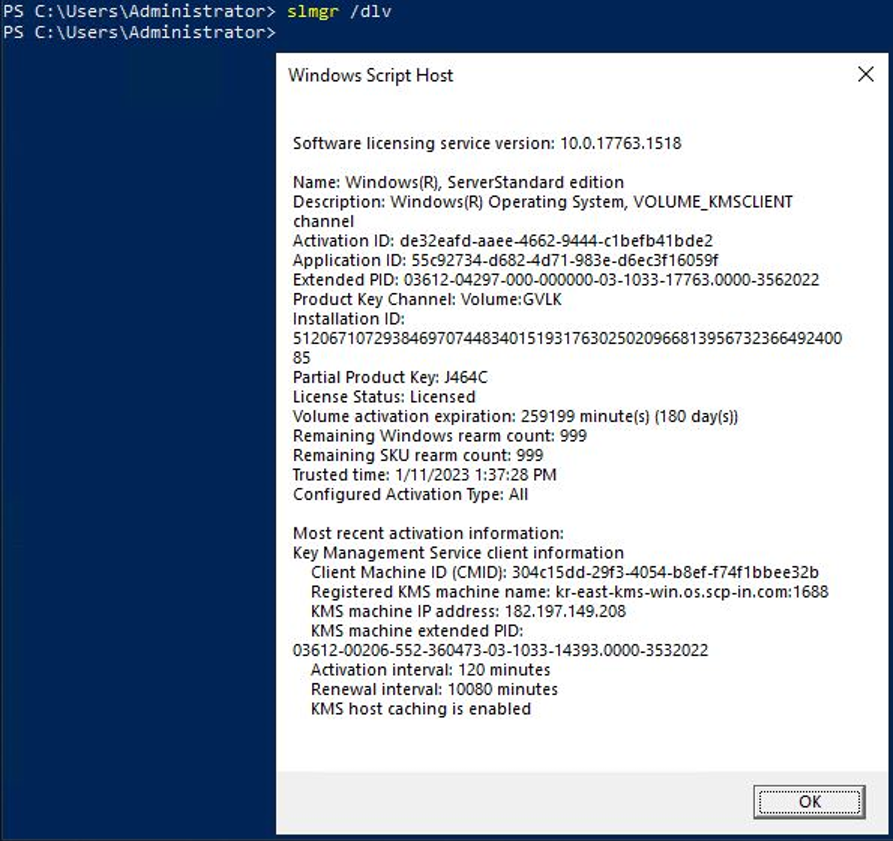
Figure. Windows Server genuine activation verification
1.2.7 - ServiceWatch Agent Installation
Users can install the ServiceWatch Agent on a Virtual Server to collect custom metrics and logs.
Reference
Collecting custom metrics/logs via the ServiceWatch Agent is currently only available on Samsung Cloud Platform For Enterprise. It will be offered in other offerings in the future.
Caution
Metric collection via ServiceWatch Agent is classified as custom metrics and, unlike the metrics collected by default from each service, incurs charges, so it is recommended to remove or disable unnecessary metric collection settings.
ServiceWatch Agent
The agents that need to be installed on the Virtual Server for collecting ServiceWatch’s custom metrics and logs can be divided into two main types. It is Prometheus Exporter and Open Telemetry Collector.
| Category | Detailed Description | |
|---|---|---|
| Prometheus Exporter | Provides metrics of a specific application or service in a format that Prometheus can scrape
| |
| Open Telemetry Collector | Collects telemetry data such as metrics and logs from distributed systems, processes (filtering, sampling, etc.) them, and serves as a centralized collector that exports to various backends (e.g., Prometheus, Jaeger, Elasticsearch, etc.)
|
Table. Explanation of Prometheus Exporter and Open Telemetry Collector
Installation of Prometheus Exporter for Virtual Server (for Linux)
Install the Prometheus Exporter according to the steps below for use on a Linux server.
Node Exporter Installation
Install Node Exporter according to the following steps.
Node Exporter User Creation
Create a dedicated user to safely isolate the Node Exporter process.
Color mode
sudo useradd --no-create-home --shell /bin/false node_exportersudo useradd --no-create-home --shell /bin/false node_exporterNode Exporter Settings
- Download to install Node Exporter.
This guide provides the version below.
- Download path: /tmp
- Installation version: 1.7.0Color mode
cd /tmp
wget https://github.com/prometheus/node_exporter/releases/download/v1.7.0/node_exporter-1.7.0.linux-amd64.tar.gz
cd /tmp wget https://github.com/prometheus/node_exporter/releases/download/v1.7.0/node_exporter-1.7.0.linux-amd64.tar.gzCode block. Node Exporter download command
Reference
The latest version of Node Exporter can be found at Node Exporter > Releases > Lastest, and a specific version of Node Exporter can be found at Node Exporter > Releases.
Install the downloaded Node Exporter and grant permission to the executable file.
Color modecd /tmp sudo tar -xvf node_exporter-1.7.0.linux-amd64.tar.gz -C /usr/local/bin --strip-components=1 node_exporter-1.7.0.linux-amd64/node_exportercd /tmp sudo tar -xvf node_exporter-1.7.0.linux-amd64.tar.gz -C /usr/local/bin --strip-components=1 node_exporter-1.7.0.linux-amd64/node_exporterCode block. Node Exporter installation command Color modesudo chown node_exporter:node_exporter /usr/local/bin/node_exportersudo chown node_exporter:node_exporter /usr/local/bin/node_exporterCode block. Node Exporter permission setting command Service file creation Set Node Exporter to collect memory metrics (meminfo) or block storage metrics (filesystem).
Color modesudo vi /etc/systemd/system/node_exporter.servicesudo vi /etc/systemd/system/node_exporter.serviceCode block. Node Exporter service file opening command Color mode[Unit] Description=Prometheus Node Exporter (meminfo only) Wants=network-online.target After=network-online.target [Service] User=node_exporter Group=node_exporter Type=simple ExecStart=/usr/local/bin/node_exporter \ --collector.disable-defaults \ # Disable default metrics --collector.meminfo \ # Enable memory metrics --collector.filesystem # Block Storage Enable filesystem metrics Restart=on-failure [Install] WantedBy=multi-user.target[Unit] Description=Prometheus Node Exporter (meminfo only) Wants=network-online.target After=network-online.target [Service] User=node_exporter Group=node_exporter Type=simple ExecStart=/usr/local/bin/node_exporter \ --collector.disable-defaults \ # Disable default metrics --collector.meminfo \ # Enable memory metrics --collector.filesystem # Block Storage Enable filesystem metrics Restart=on-failure [Install] WantedBy=multi-user.targetCode block. Node Exporter service file open result
Reference
collector can be enabled/disabled using flags.
–collector.{name}: Used to enable a specific metric.–no-collector.{name}: You can disable specific metrics.- To disable all default metrics and enable only specific collectors, you can use
–collector.disable-defaults –collector.{name} ….
Below is the description of the main collector.
| Collector | Description | Label |
|---|---|---|
| meminfo | Provides memory statistics | - |
| filesystem | Provides file system statistics such as used disk space |
|
Table. Node Exporter Main Collector Description
- Node Exporter Metrics you can check the main metrics provided by Node Exporter and how to configure the Node Exporter Collector.
Reference
- Detailed information about collectable metrics and how to configure them can be found at Node Exporter > Collector.
- The available metrics may vary depending on the version of Node Exporter you are using. Refer to Node Exporter.
Caution
Since metric collection via ServiceWatch Agent is classified as custom metrics and incurs charges unlike the default collected metrics, unnecessary metric collection must be removed or disabled to avoid excessive charges.
- Service activation and start
Register the Node Exporter service and check the registered service and configured metrics.Color mode
sudo systemctl daemon-reload
sudo systemctl enable --now node_exporter
sudo systemctl daemon-reload sudo systemctl enable --now node_exporterCode block. Node Exporter service activation and start command Color modesudo systemctl status node_exportersudo systemctl status node_exporterCode block. Node Exporter service check command Color modecurl http://localhost:9100/metrics | grep node_memorycurl http://localhost:9100/metrics | grep node_memoryCode block. Node Exporter metric information check command
Notice
If you have completed the Node Exporter setup, you need to install the Open Telemetry Collector provided by ServiceWatch to complete the ServiceWatch Agent configuration.
For more details, see ServiceWatch > Using ServiceWatch Agent.
For more details, see ServiceWatch > Using ServiceWatch Agent.
Installation of Prometheus Exporter for Virtual Server (for Windows)
Install according to the steps below to use Prometheus Exporter on a Windows server.
Windows Exporter Installation
Install the Windows Exporter according to the steps below.
Windows Exporter Settings
- Download the installation file to install Windows Exporter.
- Download path: C:\Temp
- Test version: 0.31.3Color mode
$ mkdir /Temp
$ Invoke-WebRequest -Uri "https://github.com/prometheus-community/windows_exporter/releases/download/v0.31.3/windows_exporter-0.31.3-amd64.exe" -OutFile "C:\Temp\windows_exporter-0.31.3-amd64.exe"
$ mkdir /Temp $ Invoke-WebRequest -Uri "https://github.com/prometheus-community/windows_exporter/releases/download/v0.31.3/windows_exporter-0.31.3-amd64.exe" -OutFile "C:\Temp\windows_exporter-0.31.3-amd64.exe"Code block. Windows Exporter download
Reference
You can check the Windows Exporter version and installation files at Windows Exporter > Releases.
- Windows Exporter execution test
Windows Exporter enables all collectors by default, but to collect only the metrics you want, you need to enable the following collectors. Below is an example of enabling user-specified collectors.- Memory Metric: memory
- Block Storage Metric: local_disk
- Host name: osColor mode
$ cd C:\Temp
$ .\windows_exporter-0.31.3-amd64.exe --collectors.enabled memory,logical_disk,os
$ cd C:\Temp $ .\windows_exporter-0.31.3-amd64.exe --collectors.enabled memory,logical_disk,osCode block. Windows Exporter execution test
Reference
collector can be enabled using a flag.
–collectors.enabled “[defaults]"metrics provided by default–collector.enabled {name},{name},{name}…: Used to enable specific metrics.
Below is the description of the main collector.
| Collector | Description | Label |
|---|---|---|
| memory | Memory Statistics Provided | |
| logical_disk | Collect performance and health metrics of logical disks (e.g., C:, D: drives) on the local system |
|
Table. Windows Exporter Main Collector Description
- Windows Exporter Metrics you can check the main metrics provided by Windows Exporter and how to configure the Windows Exporter Collector.
Reference
For detailed information on collectable metrics and how to configure them, see Windows Exporter > Collector.
The metrics that can be provided may differ depending on the version of the Windows Exporter you are using. Please refer to the Windows Exporter.
Caution
Since metric collection via ServiceWatch Agent is classified as custom metrics and incurs charges unlike the default collected metrics, unnecessary metric collection must be removed or disabled to avoid excessive charges.
Service Registration and Confirmation Register the Windows Exporter service and check the configured metrics.
Color mode$ sc.exe create windows_exporter binPath= "C:\Temp\windows_exporter-0.31.3-amd64.exe --collectors.enabled memory,logical_disk,os" DisplayName= "Prometheus Windows Exporter" start= auto $ Start-Service windows_exporter$ sc.exe create windows_exporter binPath= "C:\Temp\windows_exporter-0.31.3-amd64.exe --collectors.enabled memory,logical_disk,os" DisplayName= "Prometheus Windows Exporter" start= auto $ Start-Service windows_exporterCode block. Windows Exporter service registration Color mode# Service Check $ Get-Service windows_exporter # Metric Check $ Invoke-WebRequest -Uri "http://localhost:9182/metrics" | Select-String memory# Service Check $ Get-Service windows_exporter # Metric Check $ Invoke-WebRequest -Uri "http://localhost:9182/metrics" | Select-String memoryCode block. Windows Exporter service check Configuration File Settings
- You can set it to use a YAML configuration file using the
–config.fileoption.Color mode$ .\windows_exporter.exe --config.file=config.yml $ .\windows_exporter.exe --config.file="C:\Program Files\windows_exporter\config.yml" # If you use an absolute path, you must enclose the path in quotes.$ .\windows_exporter.exe --config.file=config.yml $ .\windows_exporter.exe --config.file="C:\Program Files\windows_exporter\config.yml" # If you use an absolute path, you must enclose the path in quotes.Code block. Windows Exporter configuration file settings Color modecollectors: enabled: cpu,net,service collector: service: include: windows_exporter log: level: warncollectors: enabled: cpu,net,service collector: service: include: windows_exporter log: level: warnCode block. Windows Exporter configuration file example snippet
- You can set it to use a YAML configuration file using the
- Windows Exporter > official example configuration file please refer.Color mode
---
# Note this is not an exhaustive list of all configuration values
collectors:
  enabled: cpu,logical_disk,net,os,service,system
collector:
  service:
    include: "windows_exporter"
  scheduled_task:
    include: /Microsoft/.+
log:
  level: debug
scrape:
  timeout-margin: 0.5
telemetry:
  path: /metrics
web:
  listen-address: ":9182"
--- # Note this is not an exhaustive list of all configuration values collectors: enabled: cpu,logical_disk,net,os,service,system collector: service: include: "windows_exporter" scheduled_task: include: /Microsoft/.+ log: level: debug scrape: timeout-margin: 0.5 telemetry: path: /metrics web: listen-address: ":9182"Code block. Windows Exporter configuration file example - Refer to the below to register a service using a configuration file.Color mode
$ sc.exe create windows_exporter binPath= "C:\Temp\windows_exporter-0.31.3-amd64.exe --config.file=C:\Temp\config.yml" DisplayName= "Prometheus Windows Exporter" start= auto
$ Start-Service windows_exporter
$ sc.exe create windows_exporter binPath= "C:\Temp\windows_exporter-0.31.3-amd64.exe --config.file=C:\Temp\config.yml" DisplayName= "Prometheus Windows Exporter" start= auto $ Start-Service windows_exporterCode block. Service registration using Windows Exporter configuration file
- Refer to the below to register a service using a configuration file.
Reference
When using configuration files and command-line options together, the values included in the command-line options take precedence. Therefore, command-line options override the configuration file settings.
Notice
If you have completed the Node Exporter setup, you need to install the Open Telemetry Collector provided by ServiceWatch to complete the ServiceWatch Agent configuration.
For more details, see ServiceWatch > Using ServiceWatch Agent.
For more details, see ServiceWatch > Using ServiceWatch Agent.
Node Exporter metrics
Node Exporter Main Metrics
Below is the collector and metric information that can be checked through Node Exporter. You can set it as a Collector, or you can enable only specific metrics.
| Category | Collector | Metric | Description |
|---|---|---|---|
| Memory | meminfo | node_memory_MemTotal_bytes | Total memory |
| Memory | meminfo | node_memory_MemAvailable_bytes | Available memory (used to determine memory shortage) |
| Memory | meminfo | node_memory_MemFree_bytes | Free memory (empty memory) |
| Memory | meminfo | node_memory_Buffers_bytes | IO buffer |
| Memory | meminfo | node_memory_Cached_bytes | page cache |
| Memory | meminfo | node_memory_SwapTotal_bytes | total swap |
| Memory | meminfo | node_memory_SwapFree_bytes | Remaining swap |
| Filesystem | filesystem | node_filesystem_size_bytes | total filesystem size |
| Filesystem | filesystem | node_filesystem_free_bytes | total free space |
| Filesystem | filesystem | node_filesystem_avail_bytes | Space actually available to the user (available space for unprivileged users) |
Table. Node Exporter Key Metrics
Node Exporter Collector and metric collection settings
Node Exporter enables most collectors by default, but you can enable/disable only the collectors you want.
Activate only specific Collector
- When you only want to use the memory and file system collectors:Color mode
./node_exporter
  --collector.meminfo            # Memory Collector activation
  --collector.filesystem         # File system Collector activation
./node_exporter --collector.meminfo # Memory Collector activation --collector.filesystem # File system Collector activationCode block. Enable specific Collector of Node Exporter - When you want to disable all Default settings and use only the memory and file system Collectors:Color mode
./node_exporter
  --collector.disable-defaults    # Disable default metrics
  --collector.meminfo             # Memory Collector activation
  --collector.filesystem          # File system Collector activation
./node_exporter --collector.disable-defaults # Disable default metrics --collector.meminfo # Memory Collector activation --collector.filesystem # File system Collector activationCode block. Enable specific Collector of Node Exporter - Enable file system Collector for a specific mount pointColor mode
./node_exporter
  --collector.disable-defaults    # disable default metrics
  --collector.filesystem.mount-points-include="/|/data"          # Activate file system Collector for /(Root) and /data mount points
./node_exporter --collector.disable-defaults # disable default metrics --collector.filesystem.mount-points-include="/|/data" # Activate file system Collector for /(Root) and /data mount pointsCode block. Enable specific Collector of Node Exporter - Enable file system Collector excluding specific mount pointsColor mode
./node_exporter
  --collector.disable-defaults    # disable default metrics
  --collector.filesystem.mount-points-exclude="/boot|/var/log"    # Enable file system Collector for /boot and /var/log mount points
./node_exporter --collector.disable-defaults # disable default metrics --collector.filesystem.mount-points-exclude="/boot|/var/log" # Enable file system Collector for /boot and /var/log mount pointsCode block. Enable specific Collector of Node Exporter
Disable specific Collector (no-collector)
When you don’t want to use the file system collector:
Color mode
./node_exporter --no-collector.filesystem./node_exporter --no-collector.filesystemConfigure Collector with Systemd service (recommended)
Color mode
[Unit]
Description=Node Exporter
After=network-online.target

[Service]
User=nodeexp
ExecStart=/usr/local/bin/node_exporter
  --collector.disable-defaults # Disable all default metric collectors
  --collector.meminfo
  --collector.filesystem

[Install]
WantedBy=multi-user.target
[Unit]
Description=Node Exporter
After=network-online.target
[Service]
User=nodeexp
ExecStart=/usr/local/bin/node_exporter
--collector.disable-defaults # Disable all default metric collectors
--collector.meminfo
--collector.filesystem
[Install]
WantedBy=multi-user.targetHow to filter only specific metrics
Through the Open Telemetry Collector configuration, you can set it to collect only the necessary metrics gathered from the Node Exporter. When you want to collect only specific metrics among those provided by a particular collector of Node Exporter, you can refer to Preconfiguration of Open Telemetry Collector for ServiceWatch.
Caution
Metric collection via ServiceWatch Agent is classified as custom metrics, and unlike the metrics collected by default from each service, it incurs charges, so it is recommended to configure only the metrics that are absolutely necessary.
Windows Exporter Metrics
Windows Exporter Main Metrics
Below is the collector and metric information that can be checked through Windows Exporter. You can set it as a Collector, or you can enable only specific metrics.
| Category | Collector | Metric Name | Description |
|---|---|---|---|
| Memory | memory | windows_memory_available_bytes | Available Memory |
| Memory | memory | windows_memory_cache_bytes | Cache Memory |
| Memory | memory | windows_memory_committed_bytes | Committed memory |
| Memory | memory | windows_memory_commit_limit | Commit limit |
| Memory | memory | windows_memory_pool_paged_bytes | paged pool |
| Memory | memory | windows_memory_pool_nonpaged_bytes | non-paged pool |
| Disk Information | logical_disk | windows_logical_disk_free_bytes | Remaining Capacity |
| Disk Information | logical_disk | windows_logical_disk_size_bytes | Total Capacity |
| Disk Information | logical_disk | windows_logical_disk_read_bytes_total | Read Bytes |
| Disk Information | logical_disk | windows_logical_disk_write_bytes_total | Write Bytes Count |
| Disk Information | logical_disk | windows_logical_disk_read_seconds_total | Read latency |
| Disk Information | logical_disk | windows_logical_disk_write_seconds_total | Write latency |
| Disk Information | logical_disk | windows_logical_disk_idle_seconds_total | idle time |
Table. Windows Exporter Key Metrics
Windows Exporter Collector and metric collection settings
Windows Exporter enables most collectors by default, but you can configure only the collectors you want.
Activate only specific Collector
CPU, memory, when you want to use only logical disks:
Color mode
# --collector.enabled option disables the default and activates only the specified Collector
.\windows_exporter.exe --collectors.enabled="memory,logical_disk"
# --collector.enabled option disables the default and activates only the specified Collector
.\windows_exporter.exe --collectors.enabled="memory,logical_disk"Reference
Even without disabling unused collectors, Windows Exporter will collect only the collectors specified in the option when using
–collector.enabled.Configure Collector as a service (recommended)
Color mode
# Register windows_exporter as a service
sc.exe create windows_exporter binPath= "C:\Temp\windows_exporter-0.31.3-amd64.exe --config.file=C:\Temp\config.yml" DisplayName= "Prometheus Windows Exporter" start= auto
# Service Start
Start-Service windows_exporter
# Register windows_exporter as a service
sc.exe create windows_exporter binPath= "C:\Temp\windows_exporter-0.31.3-amd64.exe --config.file=C:\Temp\config.yml" DisplayName= "Prometheus Windows Exporter" start= auto
# Service Start
Start-Service windows_exporterColor mode
# Note this is not an exhaustive list of all configuration values
collectors:
  enabled: logical_disk,memory # collector settings to enable
collector:
  service:
    include: "windows_exporter"
  scheduled_task:
    include: /Microsoft/.+
log:
  level: debug
scrape:
  timeout-margin: 0.5
telemetry:
  path: /metrics
web:
  listen-address: ":9182"
# Note this is not an exhaustive list of all configuration values
collectors:
enabled: logical_disk,memory # collector settings to enable
collector:
service:
include: "windows_exporter"
scheduled_task:
include: /Microsoft/.+
log:
level: debug
scrape:
timeout-margin: 0.5
telemetry:
path: /metrics
web:
listen-address: ":9182"How to filter only specific metrics
Through the Open Telemetry Collector configuration, you can set it to collect only the necessary metrics collected from the Windows Exporter. When you want to collect only specific metrics among those provided by a particular collector of the Windows Exporter, you can refer to the Open Telemetry Collector pre‑configuration for ServiceWatch.
Caution
Metric collection via ServiceWatch Agent is classified as custom metrics, and unlike the metrics collected by default from each service, charges apply, so it is recommended to configure only the metrics that are absolutely necessary.
1.3 - API Reference
API Reference
1.4 - CLI Reference
CLI Reference
1.5 - Release Note
Virtual Server
2025.12.16
FEATURE
Virtual Server Feature Added- OS Image additional provision
- Standard Image has been added. (Alma Linux 9.6, Oracle Linux 9.6, RHEL 9.6, Rocky Linux 9.6)
- Server Group Add new policy
- Partition(Virtual Server and Block Storage distributed deployment) policy has been added.
- Virtual Server ServiceWatch Agent can be installed to collect custom metrics and logs.
2025.10.23
FEATURE
Add server name change feature and provide ServiceWatch service integration- You can change the server name on the Virtual Server detail page of the Samsung Cloud Platform Console.
- When changing the server name, the OS’s Hostname does not change, and only the information within the Samsung Cloud Platform Console is changed.
- ServiceWatch service integration provision
- You can monitor data through the ServiceWatch service.
2025.07.01
FEATURE
Virtual Server feature addition and Image sharing method change- Virtual Server feature addition
- IP, Public NAT IP, Private NAT IP setting feature has been added.
- LLM Endpoint is provided for using LLM.
- When creating a Virtual Server, you can select an OS Image subscribed from the Marketplace.
- 2nd generation server type has been added.
- Intel 4th generation (Sapphire Rapids) Processor based 2nd generation (s2) server type added. For more details, refer to Virtual Server server type
- Image sharing method between accounts has been changed.
- qcow2 Image or shared Image can be newly created and shared.
2025.02.27
FEATURE
NAT configuration feature and OS Image, server type addition- Add Virtual Server feature
- The NAT configuration feature has been added to Virtual Server.
- OS Image additional provision
- Standard Image has been added. (Alma Linux 8.10, Alma Linux 9.4, Oracle Linux 8.10, Oracle Linux 9.4, RHEL 8.10, RHEL 9.4, Rocky Linux 8.10, Rocky Linux 9.4, Ubuntu 24.04)
- Kubernetes Image has been added. You can create a Kubernetes Engine using the Kubernetes Image.
- Add 2nd generation server type
- Intel 4th generation (Sapphire Rapids) Processor-based 2nd generation (h2) server type added. For more details, see Virtual Server server type
- Samsung Cloud Platform Common Feature Change
- Account, IAM and Service Home, reflected common CX changes such as tags.
2024.10.01
NEW
Virtual Server Service Official Version Release- Virtual Server service officially launched.
- We have launched a virtualized server that can be freely allocated and used as needed at the required time without the need to purchase infrastructure resources individually.
2024.07.02
NEW
Beta version release- We have launched a virtualized server that can be freely allocated and used as needed at the required time without the need to purchase infrastructure resources individually.
2 - Virtual Server Auto-Scaling
2.1 - Overview
Service Overview
Virtual Server Auto-Scaling is a service that automatically scales resources up or down according to demand. You can add or terminate the number of servers running the application according to predefined conditions or schedule.
Auto-Scaling Group uses a pre-created Launch Configuration as a pre-configuration template to create servers, and can adjust and manage the number of servers. It adjusts so that the number does not fall below the specified minimum number of servers or exceed the maximum number of servers.
If you register a schedule with Auto-Scaling Group, you can set the number of servers according to the predetermined schedule. If you register a policy, you can increase or decrease the number of servers based on predefined conditions.
Features
Easy and convenient computing environment configuration: Through the web-based Console, users can easily configure the required computing environment themselves via Self Service, from creating Launch Configurations to creating/modifying/deleting Auto-Scaling Groups.
Elastic Resource Usage: You can elastically use computing resources according to the service’s load and usage. Users can schedule resource usage for predictable specific time periods, and can adjust resource usage to prepare for temporary connections from an unspecified large number of users.
Availability Improvement: Virtual Server Auto-Scaling adjusts resources to match variable demand so that the traffic required by the user can always be processed. Through this, users can achieve improved application performance and availability.
Maximizing Cost Reduction Effect: By using resources only as needed according to demand fluctuations, unnecessary costs can be reduced. Through flexible resource usage according to traffic increases or decreases at specific times such as night, weekends, and month-end, the cost reduction effect can be maximized.
Service Architecture Diagram
Provided Features
Virtual Server Auto-Scaling provides the following features.
- Launch Configuration: It is a configuration template used to create a Virtual Server in an Auto-Scaling Group. When creating a Launch Configuration, you set information about the Virtual Server such as image, server type, key pair, block storage, etc.
- Server Count Adjustment: Provides several ways to adjust the number of servers. Using policies, you can add a Virtual Server when the load exceeds a threshold and release the Virtual Server when demand is low, maintaining application availability and reducing costs. You can add and release Virtual Servers according to a schedule, and you can also manually adjust the number of servers in an Auto-Scaling Group as needed.
- Load Balancer integration: You can use a Load Balancer to evenly distribute application traffic to Virtual Server. Whenever a Virtual Server is added or removed, it is automatically registered and deregistered with the Load Balancer.
- Network Connection: You can connect the general subnet of the Auto-Scaling Group, automatic IP allocation, and a Public NAT IP. It provides a local subnet connection for inter-server communication.
- Security Group applied: Security Group is a virtual logical firewall that controls inbound/outbound traffic generated on a Virtual Server. Inbound rules control incoming traffic to the Virtual Server, and Outbound rules control outgoing traffic from the Virtual Server.
- Monitoring: You can view monitoring information such as CPU, Memory, Disk of Virtual Servers created in the Auto-Scaling Group through the Cloud Monitoring service. Based on the monitoring information, you can use Auto-Scaling policies to set thresholds for load, and when the threshold is exceeded, you can add or remove servers.
Components
Virtual Server Auto-Scaling creates an Auto-Scaling Group through Launch Configuration and checks and manages the server.
Launch Configuration
This is a Configuration template used to create a Virtual Server in an Auto-Scaling Group. The main features are as follows.
- Image: Provides OS standard images and user-created custom images. Users can select and use them according to the service they want to configure.
- Keypair: Provides the Keypair method for a secure OS access method.
- Init script: The user can define a script to be executed when the Virtual Server starts.
- For more details, please refer to Launch Configuration Creating.
Reference
For images and server types selectable in Launch Configuration, refer to Virtual Server OS Image Provision Version and Virtual Server Server Type.
Auto-Scaling Group
Use Launch Configuration as a pre-configuration template for server creation. You can create an Auto-Scaling Group to adjust and manage the number of servers. The main features are as follows.
- Launch Configuration: It is a configuration template used to create a Virtual Server in an Auto-Scaling Group.
- Server Count Settings: Virtual Server Auto-Scaling provides several ways to adjust the number of servers in an Auto-Scaling Group.
- Fixed Server Count Method: When creating an Auto-Scaling Group, this method keeps the default settings by maintaining the configured number of servers without any added schedules or policies. Refer to Create Auto-Scaling Group and set the Min, Desired, Max server counts.
- Manual Server Count Adjustment Method: In an Auto-Scaling Group, this method increases or decreases the number of servers by modifying the server count to the desired amount. You can choose whether to manually set the desired number of servers. Refer to Modify Server Count.
- Schedule Reservation Method: You can schedule daily, weekly, monthly, or one-time, and set the desired number of servers at a specified time. This is useful when you can predict when to reduce or increase the number of servers. If you use the schedule method, refer to Manage Schedule to add and manage schedules.
- Policy Method: You can use a policy as a way to dynamically adjust servers. When the set threshold based on monitoring metrics is exceeded, it adjusts the number of servers. At this time, you can choose one of three ways to adjust the server count. Increase or decrease the number of servers by a specified number, increase or decrease by a specified ratio, or fix the number of servers to an entered value. When servers start and terminate due to the policy, the monitoring metric CPU usage may temporarily exceed the threshold registered in the policy. However, because this is a temporary moment, a cooldown period is set to avoid judging it as an abnormal situation. If you want to use the policy method, refer to Manage Policies.
- Load Balancer: Whenever a Virtual Server is added or terminated, it automatically connects to and disconnects from the Load Balancer registered in the Auto-Scaling Group.
- Auto-Scaling Group’s Load Balancer related detailed information, please refer to Check Auto-Scaling Group detailed information.
Reference
Auo-Scaling Group’s Load Balancer operates in conjunction with Load Balancer from February 2025.
Constraints
The constraints of Virtual Server Auto-Scaling are as follows.
| Category | Description |
|---|---|
| Number of Virtual Servers per Auto-Scaling Group | 50 or less |
| Number of policies per Auto-Scaling Group | 12 or fewer |
| Number of schedules per Auto-Scaling Group | 20 or fewer |
| Number of LB server groups and ports per Auto-Scaling Group | 3 or less |
Table. Virtual Server Auto-Scaling Group Constraints
Caution
- If the Image you are using is a discontinued standard Image, Scale-out will not work.
If the Image you are using is a Custom Image, Scale out will continue to work properly even after the version is no longer provided. - Before the end of support for the Image you are using, we recommend replacing the Launch Configuration with the latest version of the Image or a Custom Image.
- For detailed information about the OS Image provided by Virtual Server, see OS Image Provided Versions.
Preliminary Service
This is a list of services that must be pre-configured before creating the service. Please refer to the guide provided for each service for details and prepare in advance.
| Service Category | Service | Detailed Description |
|---|---|---|
| Networking | VPC | A service that provides an independent virtual network in a cloud environment |
| Networking | Security Group | Virtual firewall that controls server traffic |
Table. Virtual Server Auto-Scaling Preliminary Service
2.1.1 - Monitoring Metrics
Virtual Server Auto-Scaling is a service provided for Virtual Server targets, providing individual Virtual Server monitoring metrics and monitoring metrics provided by Cloud Monitoring-based policies.
Virtual Server monitoring metrics
The following table shows the monitoring metrics of Virtual Server that can be checked through Cloud Monitoring. For detailed usage of Cloud Monitoring, please refer to the Cloud Monitoring guide.
For Windows OS, memory-related metrics are not provided.
| Performance Item | Detailed Description | Unit |
|---|---|---|
| Memory Total [Basic] | Available memory bytes | bytes |
| Memory Used [Basic] | Currently used memory bytes | bytes |
| Memory Swap In [Basic] | Replaced memory bytes | bytes |
| Memory Swap Out [Basic] | Replaced memory bytes | bytes |
| Memory Free [Basic] | Unused memory bytes | bytes |
| Disk Read Bytes [Basic] | Read bytes | bytes |
| Disk Read Requests [Basic] | Number of Read Requests | cnt |
| Disk Write Bytes [Basic] | Write bytes | bytes |
| Disk Write Requests [Basic] | Write Request Count | cnt |
| CPU Usage [Basic] | 1-minute average system CPU usage rate | % |
| Instance State [Basic] | Instance Status | state |
| Network In Bytes [Basic] | Received bytes | bytes |
| Network In Dropped [Basic] | Received Packet Drop | cnt |
| Network In Packets [Basic] | Received Packet Count | cnt |
| Network Out Bytes [Basic] | Transmission bytes | bytes |
| Network Out Dropped [Basic] | Transmission Packet Drop | cnt |
| Network Out Packets [Basic] | Transmission Packet Count | cnt |
Fig. Virtual Server Monitoring Metrics (Default Provided)
Monitoring metrics provided by Cloud Monitoring-based policies
The following table shows the monitoring metrics provided by the policy of Cloud Monitoring-based Auto-Scaling Group. For more information on policy settings, see Managing Policies.
| Performance Item | Detailed Description | Unit |
|---|---|---|
| CPU Usage [Basic] | 1-minute average system CPU usage rate | % |
| Memory Used [Basic] | Currently used memory bytes | bytes |
| Network In Bytes [Basic] | Received bytes | bytes |
| Network In Packets [Basic] | Number of Received Packets | cnt |
| Network Out Bytes [Basic] | Transmission bytes | bytes |
| Network Out Packets [Basic] | Transmission Packet Count | cnt |
Fig. Monitoring metrics provided by Cloud Monitoring-based policies
2.2 - How-to guides
Users can create an Auto-Scaling Group service by entering the required information and selecting detailed options through the Samsung Cloud Platform Console.
Creating an Auto-Scaling Group
You can create an Auto-Scaling Group service through the Samsung Cloud Platform Console.
Note
To create an Auto-Scaling Group, you need to create a Launch Configuration in advance.
Please refer to Creating a Launch Configuration.
To create an Auto-Scaling Group, follow these steps:
Click All Services > Compute > Virtual Server menu. It will move to the Virtual Server’s Service Home page.
Click the Auto-Scaling Group menu. It will move to the Auto-Scaling Group list page.
On the Auto-Scaling Group list page, click the Create Auto-Scaling Group button. It will move to the Create Auto-Scaling Group page.
On the Create Auto-Scaling Group page, enter the information required to create the service.
- In the Launch Configuration section, select a Launch Configuration.
- You can create a new Launch Configuration by clicking the Create Launch Configuration button.
- In the Service Information Input section, enter or select the required information.
Category RequiredDetailed Description Auto-Scaling Group Name Required Auto-Scaling Group name - Manage servers of the same type and purpose as a group
Server Name Required Server name within the Auto-Scaling Group - An identifier to distinguish servers created within the Auto-Scaling Group, automatically assigned based on the input server name and sequence
Number of Servers Required Number of servers to create in the Auto-Scaling Group - Enter a value between 0 and 20 (Min≤Desired≤Max)
- Min: Set the minimum number of servers for the Auto-Scaling Group to maintain
- Desired: Set the target number of servers within the Auto-Scaling Group, also meaning the initial number of servers created when the Auto-Scaling Group is created
- Max: Set the maximum number of servers that the Auto-Scaling Group can maintain
- After creating the Auto-Scaling Group, you can modify the settings using the Modify button. For more information, refer to Modifying the Number of Servers
Manual Desired Server Count Setting Optional Choose whether to manually change the Desired server count - After creating the Auto-Scaling Group, you can modify the settings using the Modify button. For more information, refer to Modifying Manual Desired Server Count Setting
Network Settings > Network Settings Required Network settings for the Auto-Scaling Group - Select the desired VPC and general Subnet
- IP can only be automatically generated
- If you select a local Subnet, you can choose the desired local Subnet, and IP can only be automatically generated
Network Settings > Security Group Optional Set a Security Group to allow necessary access - If you don’t set a Security Group, it will follow the default rule (Any/Deny) and block all inbound and outbound traffic
- For Linux servers, allow SSH traffic
- For Windows servers, allow RDP traffic
- After creating the Auto-Scaling Group, you can modify the settings using the Modify button. For more information, refer to Setting Security Group
Load Balancer Optional Connect the Auto-Scaling Group to a Load Balancer - Register the servers in the Auto-Scaling Group as members of the LB server group
- LB server group: Select an existing LB server group in the chosen VPC
- Port: Enter a value between 1 and 65,534
- Click the + button to add an LB server group (up to 3 LB server groups and ports can be added)
- Weighted Round Robin or Weighted Least Connection load balancing LB server groups cannot be selected
- Draining Timeout value: If Draining Timeout is checked as used, set the Draining Timeout value
- Draining Timeout: The time to wait before disconnecting the server from the Load Balancer
- This allows for safe session cleanup, as sessions connected to the server may still exist
- If Load Balancer is not used, Draining Timeout setting is not available
- The default value is 300 seconds, and you can enter a value between 1 second and 3,600 seconds
- Draining Timeout: The time to wait before disconnecting the server from the Load Balancer
- After creating the Auto-Scaling Group, you can modify the settings, and for more information, refer to Using Load Balancer in Auto-Scaling Group
Table. Auto-Scaling Group Service Information Input Items - In the Scaling Policy Settings section, set the scaling policy.
- For more information on policy settings, refer to Adding a Policy.
Category RequiredDetailed Description Set Now Optional Set the scaling policy now - Click the Add Policy button to display the policy information input items
Set Later Optional Set the policy after creating the Auto-Scaling Group, on the detailed information page Table. Auto-Scaling Group Scaling Policy Settings Items
- For more information on policy settings, refer to Adding a Policy.
- In the Notification Settings section, set the notification recipient and method.
- For more information on notification settings, refer to Adding a Notification.
Category RequiredDetailed Description Set Now Optional Set the notification recipient and method now - Click the Add Notification button to open the Add Notification popup window
- For more information on notification settings, refer to the detailed information
- Click the Modify button in the notification recipient list to change the notification information
Set Later Optional Set the notification recipient and method after creating the Auto-Scaling Group, on the detailed information page Table. Auto-Scaling Group Notification Settings Items
- For more information on notification settings, refer to Adding a Notification.
- In the Additional Information Input section, enter or select the required information.
Category RequiredDetailed Description Tag Optional Add a tag - Up to 50 tags can be added per resource
- Click the Add Tag button, then enter or select the Key and Value
Table. Auto-Scaling Group Additional Information Input Items
- In the Launch Configuration section, select a Launch Configuration.
In the Summary panel, review the created details and estimated billing amount, then click the Complete button.
- After creation is complete, you can find the created Auto-Scaling Group on the Auto-Scaling Group list page.
Checking Auto-Scaling Group Details
The Auto-Scaling Group service allows you to view and modify the overall resource list and detailed information. The Auto-Scaling Group details page consists of Details, Policy, Schedule, Virtual Server, Load Balancer, Tag, and Work History tabs.
To check the Auto-Scaling Group details, follow these steps:
- Click All Services > Compute > Virtual Server menu. It will move to the Virtual Server’s Service Home page.
- Click the Auto-Scaling Group menu. It will move to the Auto-Scaling Group list page.
- On the Auto-Scaling Group list page, click the resource you want to check the details for. It will move to the Auto-Scaling Group details page.
- The Auto-Scaling Group details page displays status information and additional feature information, and consists of Details, Policy, Schedule, Virtual Server, Load Balancer, Tag, and Work History tabs.
Category Detailed Description Auto-Scaling Group Status The status of the Auto-Scaling Group created by the user - Creating: Auto-Scaling Group creation in progress
- In Service: Serviceable state
- Scale In: Scale In in progress
- Scale Out: Scale Out in progress
- Cool Down: Cool-down wait in progress
- Terminating: Auto-Scaling Group deletion in progress
- Attach to LB: Connecting to Load Balancer in progress
- Detach from LB: Detaching from Load Balancer in progress
Auto-Scaling Group Deletion Button to delete the Auto-Scaling Group Table. Auto-Scaling Group Status Information and Additional Features
- The Auto-Scaling Group details page displays status information and additional feature information, and consists of Details, Policy, Schedule, Virtual Server, Load Balancer, Tag, and Work History tabs.
Details
… (rest of the content remains the same) Auto-Scaling Group Details page where you can check the detailed information of the selected resource and modify the information if necessary.
| Category | Detailed Description |
|---|---|
| Service | Service name |
| Resource Type | Resource type |
| SRN | Unique resource ID in Samsung Cloud Platform
|
| Resource Name | Resource name
|
| Resource ID | Unique resource ID in the service |
| Creator | User who created the service |
| Creation Time | Time when the service was created |
| Modifier | User who modified the service information |
| Modification Time | Time when the service information was modified |
| Auto-Scaling Group Name | Auto-Scaling Group name |
| Launch Configuration Name | Launch Configuration name selected when creating the Auto-Scaling Group
|
| Number of Servers | Current number of servers in the Auto-Scaling Group and set Min, Desired, Max server numbers
|
| Manual Setting of Desired Server Number | Use or do not use manual setting of Desired server number
|
| VPC | VPC information of the Auto-Scaling Group |
| General Subnet | General Subnet and NAT IP usage information of the Auto-Scaling Group |
| Local Subnet | Local Subnet information of the Auto-Scaling Group |
| Security Group | Security Group information of the Auto-Scaling Group
|
Table. Auto-Scaling Group Details - Details Tab Items
Policy
On the Auto-Scaling Group List page, you can check the policy list of the selected resource and add or manage policies if necessary.
| Category | Detailed Description |
|---|---|
| Category | Policy category
|
| Policy Name | Policy name |
| Execution Condition | Condition for executing the policy
|
| Execution Unit | Method of executing the policy
|
| Cool-down | Waiting time (in seconds) after the policy starts or stops a server
|
| More > Modify | Modify the policy information
|
| More > Activate | Activate the policy
|
| More > Deactivate | Deactivate the policy
|
Table. Auto-Scaling Group Details - Policy Tab Items
For more information on policy management and policy examples, see Policy Management.
Schedule
On the Auto-Scaling Group List page, you can check the schedule list of the selected resource and add or manage schedules if necessary.
| Category | Detailed Description |
|---|---|
| Name | Schedule name |
| Min | Minimum server number set in the schedule |
| Desired | Target server number set in the schedule |
| Max | Maximum server number set in the schedule |
| Period | Schedule execution period
|
| Date/Day of the Week | Schedule execution date or day of the week
|
| Execution Time | Schedule execution time |
| Time Zone | Schedule execution time zone |
| Status | Schedule status |
| More > Modify | Modify the schedule information
|
| More > Activate | Activate the schedule
|
| More > Deactivate | Deactivate the schedule
|
Table. Auto-Scaling Group Details - Schedule Tab Items
For more information on schedule management, see Adding Schedule and Deleting Schedule.
Virtual Server
On the Auto-Scaling Group List page, you can check the Virtual Server list of the selected resource.
| Category | Detailed Description |
|---|---|
| Server Name | Name of the server created in the Auto-Scaling Group
|
| IP | IP assigned to the server |
| Creation Time | Date and time when the server was created |
| Status | Server status
|
| Load Balancer Connection Status | Load Balancer connection status
|
Table. Auto-Scaling Group Details - Virtual Server Tab Items
Load Balancer
On the Auto-Scaling Group List page, you can check the Load Balancer list of the selected resource and add or manage Load Balancers if necessary.
| Category | Detailed Description |
|---|---|
| Draining Timeout | Draining Timeout usage
|
| Load Balancer | Load Balancer usage
|
| Load Balancer > Load Balancer Name | Load Balancer name to connect to the Auto-Scaling Group |
| Load Balancer > LB Server Group | Load Balancer’s LB server group
|
| Load Balancer > Port | Port registered as a member of the LB server group |
Table. Auto-Scaling Group Details - Load Balancer Tab Items
Note
- The LB server group member information set in the Auto-Scaling Group can also be checked in the Connected Resources of the LB Server Group.
- If manual connection/disconnection between the server and Load Balancer is required, refer to Adding an LB Server Group Member.
Notification
You can check the notification recipient information and notification method for the selected resource on the Auto-Scaling Group List page.
| Category | Detailed Description |
|---|---|
| Notification Recipient | Name of the notification recipient |
| Email of the notification recipient | |
| Server Creation | Whether to send a notification when a server creation-related notification occurs
|
| Server Termination | Whether to send a notification when a server termination-related notification occurs
|
| Policy Execution Condition | Whether to send a notification when the policy execution condition is met |
| Status | Notification activation status
|
| More > Edit | Edit the notification information |
| More > Activate | Activate the notification information
|
| More > Deactivate | Deactivate the notification information
|
Table. Auto-Scaling Group Details - Notification Tab Items
For more information on notification settings, refer to Managing Notifications.
Tag
You can check the tag information of the selected resource on the Auto-Scaling Group List page and add, modify, or delete tags.
| Category | Detailed Description |
|---|---|
| Tag List | Tag list
|
Table. Auto-Scaling Group Details - Tag Tab Items
Work History
You can check the work history of the selected resource on the Auto-Scaling Group List page.
| Category | Detailed Description |
|---|---|
| Work History List | Resource change history
|
Table. Auto-Scaling Group Details - Work History Tab Items
Managing Auto-Scaling Group Resources
If you need to manage the created Auto-Scaling Group, you can perform tasks on the Auto-Scaling Group Details page.
Modifying Launch Configuration
You can modify the Launch Configuration of the Auto-Scaling Group.
Note
Modifying the Launch Configuration does not apply to existing servers in the Auto-Scaling Group. It only applies to newly created servers. If you want to apply the modified Launch Configuration to all servers in the Auto-Scaling Group, adjust the server count (Desired) to 0 to delete all existing servers, and then modify the server count (Desired) to the desired quantity.
To modify the Launch Configuration of the Auto-Scaling Group, follow these steps:
Click All Services > Compute > Virtual Server. The Virtual Server Service Home page opens.
Click Auto-Scaling Group. The Auto-Scaling Group List page opens.
On the Auto-Scaling Group List page, click the resource for which you want to modify the Launch Configuration. The Auto-Scaling Group Details page opens.
Click the Modify button next to the Launch Configuration name. The Modify Launch Configuration popup window opens, where you can view the list of available Launch Configurations.
CategoryDetailed Description Launch Configuration Name Launch Configuration name Image Launch Configuration OS image Server Type Launch Configuration server type Block Storage Launch Configuration Block Storage settings Auto-Scaling Group Count Number of Auto-Scaling Groups to which the Launch Configuration is applied Detailed View Button to view detailed Launch Configuration information Table. Launch Configuration List ItemsIn the Modify Launch Configuration popup window, select the Launch Configuration you want to modify and click OK. The Launch Configuration Modification Notification popup window opens. Check the message and click OK.
Modifying Server Count
You can modify the server count of the Auto-Scaling Group.
Note
The maximum number of servers that can be set is 50. However, if a Load Balancer is present, the number of servers not connected to the Load Balancer is excluded.
To modify the server count of the Auto-Scaling Group, follow these steps:
- Click All Services > Compute > Virtual Server. The Virtual Server Service Home page opens.
- Click Auto-Scaling Group. The Auto-Scaling Group List page opens.
- On the Auto-Scaling Group List page, click the resource for which you want to modify the server count. The Auto-Scaling Group Details page opens.
- Click the Edit Server Count button. The Edit Server Count popup window opens.
- In the Edit Server Count popup window, enter the required items and click the Confirm button.
Classification RequiredDetailed Description Server Count > Min Required Modify the minimum number of servers - Set the minimum number of servers that the Auto-Scaling Group will maintain
Server Count > Desired Required Modify the target server count - Set the target server count in the Auto-Scaling Group
- If Desired Server Count Manual Setting is Not Used, you cannot modify the Desired server count. To modify the Desired server count, refer to Modifying Desired Server Count Manual Setting
Server Count > Max Required Modify the maximum server count - Set the maximum number of servers that the Auto-Scaling Group can maintain
Table. Auto-Scaling Group Server Count Modification Items
Canceling a Virtual Server Created in an Auto-Scaling Group
A Virtual Server created in an Auto-Scaling Group can be canceled by reducing the desired number of servers.
To cancel a Virtual Server created in an Auto-Scaling Group, follow these steps:
- Click All Services > Compute > Virtual Server. You will be taken to the Virtual Server’s Service Home page.
- Click Auto-Scaling Group. You will be taken to the Auto-Scaling Group List page.
- On the Auto-Scaling Group List page, click the resource you want to cancel. You will be taken to the Auto-Scaling Group Details page.
- Click the Edit button in the Server Count section. The Edit Server Count popup window will open.
- In the Edit Server Count popup window, reduce the Desired count and click the Confirm button. The Desired server count will be adjusted, and the Virtual Server will be canceled.
Notice
If Manual Setting of Desired Server Count is set to Not Used, you will not be able to modify the Desired server count. To modify the Desired server count, refer to Modifying Manual Setting of Desired Server Count.
Modifying Desired Server Count Manual Setting
You can change the Desired server count manual setting of the Auto-Scaling Group.
Note
If you do not select Use for the Desired server count manual setting, you cannot modify the Desired server count in the detailed information server count modification.
To modify the Desired server count manual setting of the Auto-Scaling Group, follow these steps:
- Click the All Services > Compute > Virtual Server menu. The Virtual Server Service Home page opens.
- Click the Auto-Scaling Group menu. The Auto-Scaling Group List page opens.
- On the Auto-Scaling Group List page, click the resource for which you want to change the Desired server count manual setting. The Auto-Scaling Group Details page opens.
- Click the Edit button for the server count. The Desired Server Count Manual Setting popup window opens.
- In the Desired Server Count Manual Setting popup window, select whether to use it and click the Confirm button.
Setting Security Group
You can set the Security Group for the Auto-Scaling Group.
Note
If you modify the Security Group, it will not be applied to the existing servers in the Auto-Scaling Group, but only to new servers created afterwards. If you want to apply the modified Security Group to all servers in the Auto-Scaling Group, adjust the server count (Desired) to 0 to delete all existing servers, and then modify the server count (Desired) to the desired number.
To set the Security Group for the Auto-Scaling Group, follow these steps:
Click the All Services > Compute > Virtual Server menu. The Virtual Server Service Home page opens.
Click the Auto-Scaling Group menu. The Auto-Scaling Group List page opens.
On the Auto-Scaling Group List page, click the resource for which you want to set the Security Group. The Auto-Scaling Group Details page opens.
Click the Edit button for the Security Group. The Security Group Modification popup window opens, where you can view the list of available Security Groups.
Classification Detailed Description Security Group Name Security Group name Table. Security Group List ItemsIn the Security Group Modification popup window, select the Security Group and click the Confirm button. The Security Group Modification Notification popup window opens. Check the message in the notification popup window and click the Confirm button.
Managing Additional Auto-Scaling Group Information
You can set the Load Balancer to use and select the LB server group for the Auto-Scaling Group. For an Auto-Scaling Group that is using a Load Balancer, you can change it to not use it.
Modifying Load Balancer Draining Timeout
You can set the Load Balancer Draining Timeout for the Auto-Scaling Group.
Note
Draining Timeout is the time to wait before disconnecting the server from the Load Balancer.
- You can set the Draining Timeout to safely clean up sessions, as there may be remaining sessions connected to the server.
- If the Load Balancer is Not Used, the Draining Timeout cannot be set.
- The default value is 300 seconds, and you can set it to a minimum of 1 second and a maximum of 3,600 seconds.
To set the Load Balancer Draining Timeout for the Auto-Scaling Group, follow these steps:
- Click the All Services > Compute > Virtual Server menu. The Virtual Server Service Home page opens.
- Click the Auto-Scaling Group menu. The Auto-Scaling Group List page opens.
- On the Auto-Scaling Group List page, click the resource for which you want to set the Load Balancer Draining Timeout. The Auto-Scaling Group Details page opens.
- Click the Load Balancer tab. The Load Balancer list page opens.
- Click the Edit button for the Draining Timeout. The Draining Timeout Modification popup window opens.
- In the Draining Timeout Modification popup window, select whether to use the Draining Timeout and enter the Draining Timeout time (in seconds).
- In the Draining Timeout Modification popup window, check the input values and click the Confirm button. The Draining Timeout Modification Notification popup window opens. Check the message in the notification popup window and click the Confirm button.
Using Load Balancer
You can modify the Load Balancer for the Auto-Scaling Group. To set the Load Balancer for the Auto-Scaling Group, follow these steps:
Note
- When the Auto-Scaling Group’s server is created, it is automatically connected to the selected Load Balancer’s LB server group as a member, and when the server is terminated, it is disconnected from the LB server group.
- If the Draining Timeout is Used, the server is disconnected from the LB server group after waiting for the Draining Timeout (in seconds).
- For Load Balancer modification, the member is detached from the LB server group and waits in the Detach from LB state. For Scale In, the member is disconnected from the LB server group and waits in the Scale In state.
- Click the All Services > Compute > Virtual Server menu. The Virtual Server Service Home page opens.
- Click the Auto-Scaling Group menu. The Auto-Scaling Group List page opens.
- On the Auto-Scaling Group List page, click the resource for which you want to set the Load Balancer. The Auto-Scaling Group Details page opens.
- Click the Load Balancer tab. The Load Balancer list page opens.
- Click the Edit button for the Load Balancer. The Load Balancer Modification popup window opens.
- In the Load Balancer Modification popup window, select whether to use it. If you select Use, you can select the Load Balancer.
Classification Detailed Description LB Server Group LB server group name - Select the LB server group created in the selected VPC
- LB server groups using Weighted Round Robin or Weighted Least Connection load balancing cannot be selected
Port LB server group port information - Enter the port information required for registering the LB server group member
- Enter a value between 1 and 65,534
Table. Load Balancer List Items- You can add an LB server group by clicking the + button. Up to 3 can be added. You can remove the added Load Balancer by clicking the X button.
- Check the Load Balancer list and click the Confirm button. The Load Balancer Modification Notification popup window opens. Check the message in the notification popup window and click the Confirm button.Caution
- Be cautious when detaching/attaching servers from Load Balancer, as it may affect the service.
- If Draining Timeout is in use, setting Load Balancer to not in use or removing some connected Load Balancers using the X button will not immediately detach the server. The server will be detached from Load Balancer after waiting for the Draining Timeout (seconds). At this time, Auto-Scaling Group will be in Detach from LB state.
Note
- The LB server group member information set in Auto-Scaling Group can also be checked in LB server group connected resources.
- If manual connection/disconnection between server and Load Balancer is required, refer to Registering LB server group members.
Not using Load Balancer
You can modify the Load Balancer of Auto-Scaling Group to not in use. To set Load Balancer to not in use in Auto-Scaling Group, follow the procedure below.
Caution
- Be cautious when detaching/attaching servers from Load Balancer, as it may affect the service.
- If Draining Timeout is in use, setting Load Balancer to not in use or removing some connected Load Balancers using the X button will not immediately detach the server. The server will be detached from Load Balancer after waiting for the Draining Timeout (seconds). At this time, Auto-Scaling Group will be in Detach from LB state.
- Click All Services > Compute > Virtual Server menu. Move to the Service Home page of Virtual Server.
- Click Auto-Scaling Group menu. Move to the Auto-Scaling Group list page.
- Click the resource to set Load Balancer in the Auto-Scaling Group list page. Move to the Auto-Scaling Group details page.
- Click the Load Balancer tab. Move to the Load Balancer list page.
- Click the Modify button of Load Balancer. The Load Balancer modification popup window opens.
- Select whether to use Load Balancer in the Load Balancer modification popup window. If you deselect Use, Load Balancer will not be used.
- Confirm the deselection of Use and click the OK button. The Load Balancer modification notification popup window opens. Check the message in the notification popup window and click the OK button.
Deleting Auto-Scaling Group
Deleting unused Auto-Scaling Groups can reduce operating costs. However, deleting an Auto-Scaling Group may immediately stop the service in operation, so you must consider the impact of service termination before proceeding with the deletion.
Caution
Be cautious, as data cannot be recovered after deletion.
To delete an Auto-Scaling Group, follow the procedure below.
- Click All Services > Compute > Virtual Server menu. Move to the Service Home page of Virtual Server.
- Click Auto-Scaling Group menu. Move to the Auto-Scaling Group list page.
- Click the resource to delete in the Auto-Scaling Group list page. Move to the Auto-Scaling Group details page.
- Click the Delete Auto-Scaling Group button.
- After deletion is complete, check if the resource has been deleted in the Auto-Scaling Group list page.
2.2.1 - Launch Configuration
To create an Auto-Scaling Group, you need to create a Launch Configuration in advance.
Creating a Launch Configuration
You can create a Launch Configuration service on the Samsung Cloud Platform Console and use it.
To create a Launch Configuration, follow these steps:
Click All Services > Compute > Virtual Server menu. It moves to the Service Home page of Virtual Server.
Click the Launch Configuration menu. It moves to the Launch Configuration list page.
Click the Create Launch Configuration button on the Launch Configuration list page. It moves to the Create Launch Configuration page.
Select the required information in the Image and Version Selection section of the Create Launch Configuration page and click the Next button.
NoteThe images that can be selected in the Launch Configuration are as follows: Virtual Server OS Image Provided Version.Enter the required information in the Service Information Input section of the Create Launch Configuration page.
Category RequiredDescription Launch Configuration Name Required The name of the Launch Configuration - A name to distinguish the Launch Configuration
Service Type > Server Type Required The server type of the Launch Configuration - Standard: Standard specifications commonly used
- High Capacity: Server specifications with higher capacity than Standard
- Refer to Virtual Server Server Type for the available server types
Block Storage Required Block Storage settings according to the purpose of the Launch Configuration - Basic OS: The area where the OS is installed and used
- The capacity is entered in Units, and the minimum capacity varies depending on the OS image type
- Alma Linux: Enter a value between 2 and 1,536
- Oracle Linux: Enter a value between 5 and 1,536
- RHEL: Enter a value between 2 and 1,536
- Rocky Linux: Enter a value between 2 and 1,536
- Ubuntu: Enter a value between 1 and 1,536
- Windows: Enter a value between 4 and 1,536
- SSD: High-performance general volume
- HDD: General volume
- SSD/HDD_KMS: Additional encrypted volume using Samsung Cloud Platform KMS (Key Management System) encryption key
- Encryption can only be applied when created, and cannot be changed after creation
- Using the SSD_KMS disk type may cause performance degradation
- The capacity is entered in Units, and the minimum capacity varies depending on the OS image type
- Add: Additional user space outside the OS area
- Select Use and enter the storage type and capacity
- Click the + button to add storage, and click the x button to delete (up to 25 can be added)
- Capacity is entered in Units, and enter a value between 1 and 1,536
- 1 Unit is 8GB, so 8 to 12,288GB is created
- SSD: High-performance general volume
- HDD: General volume
- SSD/HDD_KMS: Additional encrypted volume using Samsung Cloud Platform KMS (Key Management System) encryption key
- Encryption can only be applied when created, and cannot be changed after creation
- Using the SSD_KMS disk type may cause performance degradation
- SSD_MultiAttach: Volume that can be connected to two or more servers
- For more information on Block Storage types, refer to Creating Block Storage
Keypair Required Select the authentication method for the Launch Configuration - Server authentication information to access the server created by creating an Auto-Scaling Group with the Launch Configuration
- Create New: Create a new Keypair if needed
- Refer to Creating a Keypair for how to create a new Keypair
- Default access account list by OS
- Alma Linux: almalinux
- RHEL: cloud-user
- Rocky Linux: rocky
- Ubuntu: ubuntu
- Windows: sysadmin
Table. Launch Configuration Service Information Input ItemsEnter the information in the Additional Information Input section of the Create Launch Configuration page and click the Next button.
Category RequiredDescription Init Script Optional Script that runs when the server starts using the Launch Configuration - Enter within 45,000 bytes
- The Init Script must be a batch script for Windows or a shell script or cloud-init for Linux, depending on the selected image.
Tag Optional Add a tag - Up to 50 tags can be added per resource
- Click the Add Tag button, enter the Key and Value, or select them
Table. Launch Configuration Additional Information Input ItemsCheck the input information and estimated cost on the Create Information Confirmation page, and click the Complete button.
- After creation is complete, check the created Launch Configuration on the Launch Configuration list page.
Checking Launch Configuration Details
The Launch Configuration service allows you to check the overall resource list and detailed information, and modify it. The Launch Configuration details page consists of Details, Tags, and Work History tabs.
To check the Launch Configuration details, follow these steps:
- Click All Services > Compute > Virtual Server menu. It moves to the Service Home page of Virtual Server.
- Click the Launch Configuration menu. It moves to the Launch Configuration list page.
- Click the resource to check the details on the Launch Configuration list page. It moves to the Launch Configuration details page.
- The top of the Launch Configuration details page displays status information and additional feature information, and consists of Details, Tags, and Work History tabs.
| Category | Description |
|---|---|
| Launch Configuration Status | The status of the Launch Configuration created by the user
|
| Launch Configuration Deletion | Button to delete the Launch Configuration |
Table. Launch Configuration Status Information and Additional Features
Details
You can check and modify the detailed information of the selected resource on the Launch Configuration list page.
| Category | Description |
|---|---|
| Service | Service category |
| Resource Type | Service name |
| SRN | Unique resource ID in Samsung Cloud Platform
|
| Resource Name | Resource name
|
| Resource ID | Unique resource ID in the service |
| Creator | The user who created the service |
| Creation Time | The time when the service was created |
| Modifier | The user who modified the service information |
| Modification Time | The time when the service information was modified |
| Launch Configuration Name | Launch Configuration name |
| Image | The image name selected when creating the Launch Configuration
|
| Number of Auto-Scaling Groups | The number of Auto-Scaling Groups using the Launch Configuration |
| Server Type | The server type set in the Launch Configuration |
| Block Storage | Block Storage information set in the Launch Configuration
|
| Keypair | Server authentication information set in the Launch Configuration
|
| Init Script | Init Script set in the Launch Configuration
|
Table. Launch Configuration Details Tab Items
Tags
You can check the tag information of the selected resource on the Launch Configuration list page, and add, change, or delete it.
| Category | Description |
|---|---|
| Tag List | Tag list
|
Table. Launch Configuration Tags Tab Items
Work History
You can check the work history of the selected resource on the Launch Configuration list page.
| Category | Description |
|---|---|
| Work History List | Resource change history
|
Table. Launch Configuration Work History Tab Detailed Information Items
Deleting a Launch Configuration
You can reduce operating costs by deleting unused Launch Configurations. However, deleting a Launch Configuration may immediately stop the operating service, so you should consider the impact of stopping the service before proceeding with the deletion.
Caution
Data cannot be recovered after deletion, so proceed with caution.
To delete a Launch Configuration, follow these steps:
- Click All Services > Compute > Virtual Server menu. It moves to the Service Home page of Virtual Server.
- Click the Launch Configuration menu. It moves to the Launch Configuration list page.
- Click the resource to delete on the Launch Configuration list page. It moves to the Launch Configuration details page.
- Click the Delete Launch Configuration button.
- After deletion is complete, check that the resource has been deleted on the Launch Configuration list page.
Caution
A Launch Configuration applied to an Auto-Scaling Group cannot be deleted.
Delete the Auto-Scaling Group first, and then delete the Launch Configuration.
2.2.2 - Managing Policies
The number of servers in an Auto-Scaling Group can be dynamically adjusted based on monitoring metrics. When the set threshold is exceeded based on the monitoring metrics, the number of servers is adjusted. At this time, you can choose one of three ways to adjust the number of servers: increase or decrease the number of servers by a specified number, increase or decrease the number of servers by a specified ratio, or fix the number of servers to a specified value. When a server is started or terminated due to a policy, the monitoring metric, such as CPU usage, may temporarily exceed the threshold set in the policy. However, since this is a temporary moment, a cooldown time is set so that it is not judged as an abnormal situation. You can add and manage policies for an Auto-Scaling Group created in the Samsung Cloud Platform Console.
Adding a Policy
You can add a policy to an Auto-Scaling Group. To add a policy to an Auto-Scaling Group, follow these steps:
All Services > Compute > Virtual Server menu, click. Move to the Service Home page of Virtual Server.
Click the Auto-Scaling Group menu. Move to the Auto-Scaling Group List page.
On the Auto-Scaling Group List page, click the resource to view detailed information. Move to the Auto-Scaling Group Details page.
Click the Policy Tab. Move to the Policy Tab page.
Click the Add Policy button. The Add Policy popup window opens.
Classification RequiredDetailed Description Classification Required Policy classification - Scale In: Server reduction
- Scale Out: Server increase
Policy Name Required Policy name for distinction Execution Condition Required Condition for executing the policy - Statistic: Method of calculating the metric type
- Average: Average of servers in the Auto-Scaling Group
- Min: Minimum value among servers in the Auto-Scaling Group
- Max: Maximum value among servers in the Auto-Scaling Group
- Metric Type: CPU Usage, Memory Usage, Network In(bytes), Network Out(bytes), Network In(Packets), Network Out(Packets)
- Note: Memory usage policy is not available for Windows servers
- Operator:
>=><=<
- Threshold: Threshold for the metric type
- Period: Continuous time to trigger the execution condition (N minutes)
Execution Unit Required Method of executing the policy - Policy Type: Select the type of policy to execute.
- Increase or decrease the number of servers by a specified number: Increase or decrease the target value
- Increase or decrease the number of servers by a specified ratio: Increase or decrease the target value ratio
- Fix the number of servers to a specified value: Fix the target value
- Target Value: Number or ratio to execute the selected Policy Type
Cooldown Required Time to wait (in seconds) when a server is started or terminated due to a policy - Default value is 300 seconds, and it can be set between 60 seconds and 3,600 seconds.
Table. Add Policy Popup ItemsNotePolicy > Cooldown Setting
- When a server is started or terminated due to a policy, wait for the cooldown time set. The monitoring metric, such as CPU usage, may temporarily exceed the threshold set in the policy. However, since this is a temporary moment and not a condition for adjusting the number of servers, the cooldown time is set to wait.
GuidePolicy execution operates within the set minimum and maximum number of servers.
- Even if the number of servers is increased or decreased, or fixed, beyond the minimum and maximum number of servers, it operates within the set minimum and maximum number of servers.
- Example: If the minimum number of servers is 3, even if the number of servers is fixed to 1, the number of servers will not decrease to 1, but will be maintained at the minimum number of servers, which is 3.
In the Add Policy popup window, enter the required values and click the Confirm button. The added policy can be checked in the Policy List.
Policy Creation Example
The following is an explanation of the policy example. Refer to it when creating a policy.
Policy Example Explanation 1
| Classification | Execution Condition | Execution Unit | Cooldown |
|---|---|---|---|
| Scale Out | Average CPU Usage >= 60% for 1 minute | Increase the number of servers by a specified number, 1 server | 300 seconds |
Table. Auto-Scaling Group Policy Example 1
- If the average CPU usage of the servers in the Auto-Scaling Group is 60% or higher for 1 minute, 1 server is added.
- When a server is added, the cooldown time is 300 seconds. During the cooldown time, no additional servers are added or terminated due to the policy.
- After the cooldown time ends, the policy execution condition is checked again.
Policy Example Explanation 2
| Classification | Execution Condition | Execution Unit | Cooldown |
|---|---|---|---|
| Scale In | Min CPU Usage <= 5% for 1 minute | Decrease the number of servers by a specified ratio, 50% | 300 seconds |
Table. Auto-Scaling Group Policy Example 2
- If the minimum CPU usage of the servers in the Auto-Scaling Group is 5% or lower for 1 minute, 50% of the current number of servers are terminated.
- When a server is terminated, the cooldown time is 300 seconds. During the cooldown time, no additional servers are added or terminated due to the policy.
- After the cooldown time ends, the policy execution condition is checked again.
Policy Example Explanation 3
| Classification | Execution Condition | Execution Unit | Cooldown |
|---|---|---|---|
| Scale Out | Max CPU Usage >= 90% for 1 minute | Fix the number of servers to a specified value, 5 servers | 300 seconds |
Table. Auto-Scaling Group Policy Example 3
- If the maximum CPU usage of the servers in the Auto-Scaling Group is 90% or higher for 1 minute, the number of servers is fixed to 5.
- During the server creation, the cooldown time is 300 seconds. During the cooldown time, no additional servers are added or terminated due to the policy.
- After the cooldown time ends, the policy execution condition is checked again.
Modifying a Policy
You can modify a policy of an Auto-Scaling Group. To modify a policy of an Auto-Scaling Group, follow these steps:
All Services > Compute > Virtual Server menu, click. Move to the Service Home page of Virtual Server.
Auto-Scaling Group menu should be clicked. It moves to the Auto-Scaling Group list page.
In the Auto-Scaling Group list page, click on the resource to check the detailed information. It moves to the Auto-Scaling Group details page.
Click on the Policy tab. It moves to the Policy tab page.
Click on the More > Edit button of the policy to be modified. The Policy modification popup opens.
Classification RequiredDetailed Description Classification Required Policy classification - Scale In: Server count return
- Scale Out: Server count increase
Policy Name Required Policy name for distinction Execution Condition Required Condition for executing the policy - Statistic: Method of calculating Metric Type
- Average: Average of servers in Auto-Scaling Group
- Min: Minimum value among servers in Auto-Scaling Group
- Max: Maximum value among servers in Auto-Scaling Group
- Metric Type: CPU Usage, Memory Usage, Network In(bytes), Network Out(bytes), Network In(Packets), Network Out(Packets)
- Note: Memory usage policy cannot be set for Windows servers
- Operator:
>=><=<
- Threshold: Threshold corresponding to Metric Type
- Period: Continuous time (N minutes) to trigger the execution condition
Execution Unit Required Method of executing the policy - Policy Type: Select the type of policy to be executed.
- Increase or decrease the server count by a specified number: Increase or decrease the server count by the target value
- Increase or decrease the server count by a specified ratio: Increase or decrease the server count by the target value ratio
- Fix the server count to the input value: Fix the server count to the target value
- Target Value: The number or ratio of the selected Policy Type to be executed
Cooldown Required Waiting time (in seconds) when a server is started or terminated due to a policy - Default value is 300 seconds, and it can be set from 1 second to a maximum of 3,600 seconds
Table. Policy modification popup itemsClick the Confirm button after entering the required values in the Policy modification popup window.
Policy Addition and Modification Restrictions
There are restrictions when adding or modifying policies, depending on the policy classification, execution condition, and execution condition range. Refer to the examples of restrictions below and add or modify policies accordingly.
Example 1 - Check for duplicate registration of policy classification and execution condition
Duplicate registration is not allowed when the policy classification (Scale Out or Scale In) and execution condition (Metric type) are the same.
| Policy Classification | Policy Name | Execution Condition (Statistic) | Execution Condition (Metric Type) | Execution Condition Range |
|---|---|---|---|---|
Scale Out | ScaleOutPolicy | Average | CPU Usage | >= 60% |
Table. Policy restriction example 1 - Pre-registered policy
If a policy is already registered as shown above, it is not possible to add or modify a policy with the same classification (Scale Out) and execution condition (Metric type = CPU Usage).
Example 2 - Check the execution condition range for the same execution condition (Metric type) and execution condition (Statistic)
When the policy distinction (Scale Out or Scale In) is different, the execution condition range (Comparison operator + Threshold) cannot be duplicated for the same execution condition (Metric type) and execution condition (Statistic).
| Policy Distinction | Policy Name | Execution Condition (Statistic) | Execution Condition (Metric type) | Execution Condition Range |
|---|---|---|---|---|
Scale Out | ScaleOutPolicy | Average | CPU Usage | >= 60% |
Table. Policy Constraint Example 2 - Pre-registered Policy
In the case where a policy is registered as above, it is not possible to add a policy or modify it as follows: If the CPU Usage is 60% or higher on average, since the Scale Out policy is already registered, it is not possible to register a Scale In policy for CPU Usage average of 60% or lower, as the 60% case would be a duplicate of the same execution condition.
| Policy Distinction | Policy Name | Execution Condition (Statistic) | Execution Condition (Metric type) | Execution Condition Range |
|---|---|---|---|---|
Scale In | AddUpdatePolicy | Average | CPU Usage | <= 60% |
Table. Policy Constraint Example 2 - Policy that cannot be added
If a policy is already registered as shown above, it is not possible to add or modify a policy with the same execution condition (Metric type = CPU Usage) and execution condition (Statistic = Average), and an execution condition range that overlaps with the existing policy.
Example 3 - Check the execution condition range for the same execution condition (Metric type) and execution condition (Statistic)
When the policy distinction (Scale Out or Scale In) is different, the execution condition range (Comparison operator + Threshold) cannot be duplicated for the same execution condition (Metric type) and execution condition (Statistic).
| Policy Distinction | Policy Name | Execution Condition (Statistic) | Execution Condition (Metric type) | Execution Condition Range |
|---|---|---|---|---|
Scale In | ScaleInPolicy | Average | CPU Usage | <= 10% |
Table. Policy Constraint Example 3 - Pre-registered Policy
In the case where a policy is registered as above, it is not possible to add or modify a policy as follows: Since the Scale In policy is already registered when the CPU usage is 10% or less on average, it is not possible to register a Scale Out policy when the CPU usage is less than 60%, less than or equal to 60%, greater than 10%, or greater than 9%.
| Policy Distinction | Policy Name | Execution Condition (Statistic) | Execution Condition (Metric type) | Execution Condition Range |
|---|---|---|---|---|
Scale Out | AddUpdatePolicy1 | Average | CPU Usage | < 60% |
Scale Out | AddUpdatePolicy2 | Average | CPU Usage | <= 60% |
Scale Out | AddUpdatePolicy3 | Average | CPU Usage | >= 10% |
Scale Out | AddUpdatePolicy4 | Average | CPU Usage | > 9% |
Table. Policy Constraint Example 3 - Policies that cannot be added
Example 4 - Registration is possible when the execution condition range does not overlap
When the policy distinction (Scale Out or Scale In) is different, it is possible to register even if the execution condition (Statistic) is different or the execution condition range (Comparison operator + Threshold) does not overlap for the same execution condition (Metric type).
| Policy Distinction | Policy Name | Execution Condition (Statistic) | Execution Condition (Metric type) | Execution Condition Range |
|---|---|---|---|---|
Scale Out | ScaleOutPolicy | Average | CPU Usage | >= 60% |
Table. Policy constraint example 4 - Pre-registered policy
In the case where a policy is registered as above, it is possible to add or modify a policy as follows. If the execution condition range does not overlap or the execution condition (Statistic) is different, registration is possible.
| Policy Distinction | Policy Name | Execution Condition (Statistic) | Execution Condition (Metric type) | Execution Condition Range |
|---|---|---|---|---|
Scale In | AddUpdatePolicy1 | Average | CPU Usage | <= 10% |
Scale In | AddUpdatePolicy2 | Min | CPU Usage | <= 60% |
Table. Policy constraint example 4 - Policies that can be added
Deleting a Policy
It is possible to delete a policy from an Auto-Scaling Group. To delete a policy, follow the procedure below.
- All Services > Compute > Virtual Server menu, click. Move to the Service Home page of Virtual Server.
- Auto-Scaling Group menu, click. Move to the Auto-Scaling Group List page.
- On the Auto-Scaling Group List page, click the resource to check the detailed information. Move to the Auto-Scaling Group Details page.
- Click the Policy Tab. Move to the Policy Tab page.
- Select the policy to delete and click the Delete button. The Policy Delete Confirmation popup window opens.
- Confirm the Policy Delete Confirmation popup window and click the Confirm button.
2.2.3 - Managing Schedules
You can schedule daily, weekly, monthly, or one-time, and set the desired number of servers at a fixed time. This is useful when it is possible to predict when to reduce or increase the number of servers.
Add schedule
You can add a schedule to the Auto-Scaling Group. To add a schedule to the Auto-Scaling Group, follow these steps.
- Click All Services > Compute > Virtual Server menu. It moves to the Service Home page of Virtual Server.
- Auto-Scaling Group menu is clicked. It moves to the Auto-Scaling Group list page.
- Auto-Scaling Group list page, click the resource to check the detailed information. It moves to the Auto-Scaling Group details page.
- Click the Schedule Tab. It moves to the Schedule Tab page.
- Click the Add Schedule button. The Add Schedule popup window opens.
Classification RequiredDetailed Description Schedule Name Required Schedule-specific distinguishing name Server count selection Required When performing a schedule, select the number of servers to adjust - Min: The minimum number of servers that the Auto-Scailg Group will maintain
- Desired: The target number of servers within the Auto-Scailg Group
- Max: The maximum number of servers that the Auto-Scailg Group can maintain
Enter the number of servers Required Enter the value of the selected server number - Min value: Please enter a value between 0 and 50. (Min≤Desired≤Max)
- Desired value: Please enter a value between 0 and 50. (Min≤Desired≤Max)
- Max value: Please enter a value between 0 and 50. (Min≤Desired≤Max)
Period Required Schedule execution period - Daily: You can set the start date and end date, and permanent settings for daily schedule execution. You can also set time and time zone
- Weekly: You can set start date and end date, permanent settings, and time and time zone settings. You can also select the day of the week for weekly schedule execution
- Monthly: You can set start date and end date, permanent settings, and time and time zone settings. You can also enter the date for monthly schedule execution
- Once: You can set time and time zone settings. You can also set the date for one-time schedule execution
Start Date Select Set schedule start date - Cannot be set to a date prior to the current date. The default is the current date.
End Date Select Set schedule end date - Cannot be set to a date prior to the current date. The default is the current date + 7.
Permanent Select If permanent is set, the schedule end date is set to 9999-12-31 Time Required Schedule execution time setting - Can be set in 30-minute units. Time faster than the current date and time cannot be set
Time Zone Required Time zone corresponding to the schedule execution time (e.g., Asia/Seoul (GMT +09:00)) Day of the week Required If you select cycle as every week, select the day of the week to perform the schedule Date Essential - Cycle is selected as every month, enter the Date to perform the schedule
- Please enter one or more between -31 and 31, excluding 0. (Example: 3,4,5)
- Cycle is selected as once, set the Date to perform the schedule
- It cannot be set before the current date. The default value is the current date.
Table. Schedule Add Popup Item - In the Add Schedule popup window, enter the required values and click the OK button.
- Check the message in the Add Schedule Confirmation popup window, then click the Confirm button.
Reference
If you select monthly for the schedule cycle, you must enter the schedule execution date, which is Date. Please refer to the following contents to register the schedule.
- If you enter a number greater than 0, it means the date of the month.
- Example: If you enter 1, it will be August 1, September 1, …, December 1
- If you enter a number less than 0, it will be calculated from the last day of the month.
- Entering -1 means the last day of the month.
- Example: August 31, September 30, …, December 31
- If -2 is entered, it means the day before the last day of the month.
- Example: August 30, September 29, …, December 30
- Since the last day of each month is different, such as 31st, 30th, 29th, 28th, to handle cases where a schedule should be executed on the last day of each month, negative numbers are used to calculate from the last day, as shown above.
Notice
- When the schedule is executed, if the minimum number of servers set in the schedule is greater than the desired number of servers, or the maximum number of servers is less than the desired number of servers, the desired number of servers is also modified.
- If there are schedules with overlapping execution times, they may not run normally. Please try to avoid overlapping execution times if possible.
Modify Schedule
You can modify the schedule of the Auto-Scaling Group. To modify the schedule of the Auto-Scaling Group, follow these steps.
Click All services > Compute > Virtual Server menu. It moves to the Service Home page of Virtual Server.
Auto-Scaling Group menu is clicked. It moves to the Auto-Scaling Group list page.
Auto-Scaling Group list page, click the resource to check the detailed information. Move to the Auto-Scaling Group details page.
Click the Schedule Tab. It moves to the Schedule Tab page.
Click the More > Edit button of the schedule you want to modify. The Edit Schedule popup window will open.
Classification RequiredDetailed Description Schedule Name Required Schedule name to distinguish by schedule Number of servers to select Required When performing a schedule, select the number of servers to adjust - Min: The minimum number of servers that the Auto-Scailg Group will maintain
- Desired: The target number of servers within the Auto-Scailg Group
- Max: The maximum number of servers that the Auto-Scailg Group can maintain
Enter the number of servers Required Enter the value of the selected server number - Min value: Please enter a value between 0 and 50. (Min≤Desired≤Max)
- Desired value: Please enter a value between 0 and 50. (Min≤Desired≤Max)
- Max value: Please enter a value between 0 and 50. (Min≤Desired≤Max)
Period Required Schedule execution period - Daily: You can set the start date and end date, and permanent settings for daily schedule execution. You can also set time and time zone
- Weekly: You can set start date and end date, permanent settings, and time and time zone. You can also select the day of the week for weekly schedule execution
- Monthly: You can set start date and end date, permanent settings, and time and time zone. You can also enter the date for monthly schedule execution
- Once: You can set time and time zone. You can also set the date for one-time schedule execution
Start Date Select Set schedule start date - Cannot be set to a date prior to the current date. The default is the current date.
End Date Select Set schedule end date - Cannot be set to a date prior to the current date. The default is the current date + 7.
Permanent Select If permanent is set, the schedule end date is set to 9999-12-31 Time Required Schedule execution time setting - Can be set in 30-minute units. Time faster than the current date and time cannot be set
Time Zone Required Time zone corresponding to the schedule execution time (e.g. Asia/Seoul (GMT +09:00)) Day Required If you select Weekly as the Cycle, select the day of the week to perform the schedule Date Essential - Cycle를 Every Month selected, enter the Date to perform the schedule
- Please enter one or more from -31 to 31 excluding 0. (Example: 3,4,5)
- Cycle를 Once selected, set the Date to perform the schedule
- Cannot be set before the current date. The default value is the current date.
Fig. Schedule modification popup itemIn the Modify Schedule popup window, enter the required values and click the Confirm button.
Schedule Modification Confirmation Check the message in the popup window and click the Confirm button.
Delete Schedule
You can delete the schedule of the Auto-Scaling Group. To delete the schedule of the Auto-Scaling Group, follow the next procedure.
- Click All Services > Compute > Virtual Server menu. It moves to the Service Home page of Virtual Server.
- Auto-Scaling Group menu is clicked. It moves to the Auto-Scaling Group list page.
- Auto-Scaling Group list page, click the resource to check the detailed information. Move to the Auto-Scaling Group details page.
- Click the Schedule Tab. It moves to the Schedule Tab page.
- Select the schedule to be deleted and click the Delete button. The Schedule Deletion Confirmation popup window will open.
- Schedule deletion confirmation popup window, confirm and click the Confirm button.
2.2.4 - Managing Notifications
You can specify the notification recipient to send a notification message via E-mail or SMS for a specific situation.
Reference
- Notification method (E-mail or SMS) can be set by selecting Notification target as Service > Virtual Server Auto-Scaling on the Notification settings page.
- For more information about modifying alert settings, see Modifying Alert Settings.
Add Alert
You can add notifications to the Auto-Scaling Group. To add notifications to the Auto-Scaling Group, follow these steps.
- All services > Compute > Virtual Server menu, click. It moves to the Service Home page of Virtual Server.
- Auto-Scaling Group menu is clicked. It moves to the Auto-Scaling Group list page.
- Click the resource to add notification information on the Auto-Scaling Group list page. It moves to the Auto-Scaling Group details page.
- Notification Tab을 클릭하세요. Notification Tab 페이지로 이동합니다.
- Click the Add Notification button. The Add Notification popup window opens.
- In the Add Notification popup window, enter the required values and click the Confirm button.
Division Detailed Description Notification Point Notification point when Auto-Scaling Group alert occurs - Server creation, Server termination, Server creation failure, Server termination failure, When policy execution conditions are met
- Multiple selections are possible
Notification Recipient User to receive notification when notification occurs - Add Notification Recipient button to select user
- Only Samsung Cloud Platform users can be selected as recipients
Table. Notification Items
Caution
When adding a notification recipient, check if there is an email address and add it. Only users with a login history (users who have registered their email or mobile phone number) can receive notifications.
- Check the message in the Add Alert Confirmation popup window, then click the Confirm button.
Modify Alert
You can modify the notification information of the Auto-Scaling Group. To modify the notification information of the Auto-Scaling Group, follow the procedure below.
- Click All Services > Compute > Virtual Server menu. It moves to the Service Home page of Virtual Server.
- Auto-Scaling Group menu will be clicked. It moves to the Auto-Scaling Group list page.
- Click the resource to modify the notification information on the Auto-Scaling Group list page. It moves to the Auto-Scaling Group details page.
- Click the Notification Tab. It moves to the Notification Tab page.
- Click the More > Edit button for the notification information you want to modify in the notification list. The Edit Notification popup window opens.
- Modify Notification In the notification modification popup window, modify the notification information and click the Confirm button.
Classification Detailed Description Notification Point Notification point when Auto-Scaling Group alert occurs - Server creation, Server termination, Server creation failure, Server termination failure, When policy execution conditions are met
- Multiple selections are possible
Table. Notification Modification Items - Check the message in the Notification Modification Confirmation popup window, then click the Confirm button.
Delete Notification
You can delete the notification of Auto-Scaling Group. To delete the notification of Auto-Scaling Group, follow the procedure below.
- 모든 서비스 > Compute > Virtual Server menu should be clicked. It moves to the Service Home page of Virtual Server.
- Auto-Scaling Group menu is clicked. It moves to the Auto-Scaling Group list page.
- Auto-Scaling Group list page, click the resource to modify the notification information. Move to the Auto-Scaling Group details page.
- Click the Notification Tab. It moves to the Notification Tab page.
- Select the notification to be deleted from the notification list, then click the Delete button. The Delete Notification Confirmation popup window will open.
- Notification deletion confirmation popup window, confirm and click the Confirm button.
2.3 - API Reference
API Reference
2.4 - CLI Reference
CLI Reference
2.5 - Release Note
Virtual Server Auto-Scaling
2025.07.01
FEATURE
New feature added- Added notification feature to Virtual Server Auto-Scaling.
- You can add notification settings in the Auto-Scaling Group creation or detail screen.
- You can set the scaling policy when creating an Auto-Scaling Group.
- Added Metric Type of Auto-Scaling Group policy.
- Added: Memory Usage, Network In(bytes), Network Out(bytes), Network In(Packets), Network Out(Packets)
- You can set the Draining Timeout when connecting to the Load Balancer.
- In an Auto-Scaling Group, a Virtual Server can be connected to up to 50 instances, and an LB server group and port can be connected up to 3 instances.
2025.02.27
FEATURE
Virtual Server Auto Scaling-Load Balancer service linkage release and NAT setting feature addition- Virtual Server Auto-Scaling feature change
- It will be released in conjunction with the Load Balancer service to be released in February 2025.
- NAT setting feature has been added to Auto-Scaling Group.
- Samsung Cloud Platform common feature changes
- Account, IAM and Service Home, tags, etc. reflected common CX changes.
2024.11.19
NEW
Virtual Server Auto Scaling Service Official Version Release- Virtual Server Auto-Scaling creates and manages Auto-Scaling Group through Launch Configuration and checks and manages the server.
- It provides a schedule method that can set the desired number of servers at a fixed time and a policy method that adjusts the number of servers based on CPU usage rate.
3 - GPU Server
3.1 -
3.1.1 - Server Type
GPU Server Server Type
GPU Server is classified according to the GPU Type provided, and the GPU used in the GPU Server is determined by the server type selected when creating the GPU Server. Please select the server type according to the specifications of the application you want to run on the GPU Server.
The server types supported by the GPU Server are as follows.
GPU-H100-2 g2v12h1
Category | Example | Detailed description |
|---|---|---|
| Server Type | GPU-H100-2 | Provided server type classification
|
| Server specifications | g2 | Provided server type classification and generation
|
| Server specifications | v12 | Number of vCores
|
| Server specifications | h1 | GPU type and quantity
|
Table. GPU Server server type format
g1 server type
The g1 server type is a GPU Server that uses NVIDIA A100 Tensor Core GPU, suitable for high-performance applications.
- Provides up to 8 NVIDIA A100 Tensor Core GPUs
- Equipped with 6,912 CUDA cores and 432 Tensor cores per GPU
- Supports up to 128 vCPUs and 1,920 GB of memory
- Maximum 40 Gbps networking speed
- 600GB/s GPU and NVIDIA NVSwitch P2P communication
| Category | Server Type | GPU | CPU | Memory | GPU Memory | Network Bandwidth |
|---|---|---|---|---|---|---|
| GPU-A100-1 | g1v16a1 | 1 | 16 vCore | 234 GB | 80 GB | up to 20 Gbps |
| GPU-A100-1 | g1v32a2 | 2 | 32 vCore | 468 GB | 160 GB | up to 20 Gbps |
| GPU-A100-1 | g1v64a4 | 4 | 64 vCore | 936 GB | 320 GB | up to 40 Gbps |
| GPU-A100-1 | g1v128a8 | 8 | 128 vCore | 1872 GB | 640 GB | Maximum 40 Gbps |
Table. GPU Server server type > GPU-A100-1 server type
g2 server type
The g2 server type is a GPU Server that uses NVIDIA H100 Tensor Core GPU, suitable for high-performance applications.
- Up to 8 NVIDIA H100 Tensor Core GPUs provided
- Equipped with 16,896 CUDA cores and 528 Tensor cores per GPU
- Supports up to 96 vCPUs and 1,920 GB of memory
- Maximum networking speed of 40Gbps
- 900GB/s GPU and NVIDIA NVSwitch P2P communication
| Category | Server Type | GPU | CPU | Memory | GPU Memory | Network Bandwidth |
|---|---|---|---|---|---|---|
| GPU-H100-2 | g2v12h1 | 1 | 12 vCore | 234 GB | 80 GB | up to 20 Gbps |
| GPU-H100-2 | g2v24h2 | 2 | 24 vCore | 468 GB | 160 GB | up to 20 Gbps |
| GPU-H100-2 | g2v48h4 | 4 | 48 vCore | 936 GB | 320 GB | Maximum 40 Gbps |
| GPU-H100-2 | g2v96h8 | 8 | 96 vCore | 1872 GB | 640 GB | up to 40 Gbps |
Table. GPU Server server type > GPU-H100-2 server type
3.1.2 - Monitoring Metrics
GPU Server Monitoring Metrics
The following table shows the monitoring metrics of the GPU Server that can be checked through Cloud Monitoring.
Even without installing an Agent, basic monitoring metrics are provided. Please check the Table. GPU Server Monitoring Metrics (Basic) below. Additionally, metrics that can be retrieved by installing an Agent are referenced in the Table. GPU Server Additional Monitoring Metrics (Agent Installation Required) below.
For detailed Cloud Monitoring usage, please refer to the Cloud Monitoring guide.
| Performance Item Name | Description | Unit |
|---|---|---|
| Memory Total [Basic] | Total available memory in bytes | bytes |
| Memory Used [Basic] | Currently used memory in bytes | bytes |
| Memory Swap In [Basic] | Swapped memory in bytes | bytes |
| Memory Swap Out [Basic] | Swapped memory in bytes | bytes |
| Memory Free [Basic] | Unused memory in bytes | bytes |
| Disk Read Bytes [Basic] | Read bytes | bytes |
| Disk Read Requests [Basic] | Number of read requests | cnt |
| Disk Write Bytes [Basic] | Written bytes | bytes |
| Disk Write Requests [Basic] | Number of write requests | cnt |
| CPU Usage [Basic] | Average system CPU usage over 1 minute | % |
| Instance State [Basic] | Instance state | state |
| Network In Bytes [Basic] | Received bytes | bytes |
| Network In Dropped [Basic] | Dropped received packets | cnt |
| Network In Packets [Basic] | Received packets | cnt |
| Network Out Bytes [Basic] | Sent bytes | bytes |
| Network Out Dropped [Basic] | Dropped sent packets | cnt |
| Network Out Packets [Basic] | Sent packets | cnt |
Table. GPU Server Basic Monitoring Metrics (Basic)
| Performance Item Name | Description | Unit |
|---|---|---|
| GPU Count | Number of GPUs | cnt |
| GPU Memory Usage | GPU memory usage rate | % |
| GPU Memory Used | Used GPU memory | MB |
| GPU Temperature | GPU temperature | ℃ |
| GPU Usage | GPU utilization | % |
| GPU Usage [Avg] | Average GPU usage rate | % |
| GPU Power Cap | Maximum power capacity of the GPU | W |
| GPU Power Usage | Current power usage of the GPU | W |
| GPU Memory Usage [Avg] | Average GPU memory usage rate | % |
| GPU Count in use | Number of GPUs in use by jobs on the node | cnt |
| Execution Status for nvidia-smi | Execution result of the nvidia-smi command | status |
| Core Usage [IO Wait] | CPU time spent in IO wait state | % |
| Core Usage [System] | CPU time spent in system space | % |
| Core Usage [User] | CPU time spent in user space | % |
| CPU Cores | Number of CPU cores on the host | cnt |
| CPU Usage [Active] | CPU time used, excluding idle and IO wait states | % |
| CPU Usage [Idle] | CPU time spent in idle state | % |
| CPU Usage [IO Wait] | CPU time spent in IO wait state | % |
| CPU Usage [System] | CPU time used by the kernel | % |
| CPU Usage [User] | CPU time used by user space | % |
| CPU Usage/Core [Active] | CPU time used per core, excluding idle and IO wait states | % |
| CPU Usage/Core [Idle] | CPU time spent in idle state per core | % |
| CPU Usage/Core [IO Wait] | CPU time spent in IO wait state per core | % |
| CPU Usage/Core [System] | CPU time used by the kernel per core | % |
| CPU Usage/Core [User] | CPU time used by user space per core | % |
| Disk CPU Usage [IO Request] | CPU time spent on IO requests | % |
| Disk Queue Size [Avg] | Average queue length of requests | num |
| Disk Read Bytes | Bytes read from the device per second | bytes |
| Disk Read Bytes [Delta Avg] | Average delta of bytes read from the device | bytes |
| Disk Read Bytes [Delta Max] | Maximum delta of bytes read from the device | bytes |
| Disk Read Bytes [Delta Min] | Minimum delta of bytes read from the device | bytes |
| Disk Read Bytes [Delta Sum] | Sum of delta of bytes read from the device | bytes |
| Disk Read Bytes [Delta] | Delta of bytes read from the device | bytes |
| Disk Read Bytes [Success] | Total bytes successfully read | bytes |
| Disk Read Requests | Number of read requests to the device per second | cnt |
| Disk Read Requests [Delta Avg] | Average delta of read requests to the device | cnt |
| Disk Read Requests [Delta Max] | Maximum delta of read requests to the device | cnt |
| Disk Read Requests [Delta Min] | Minimum delta of read requests to the device | cnt |
| Disk Read Requests [Delta Sum] | Sum of delta of read requests to the device | cnt |
| Disk Read Requests [Success Delta] | Delta of successful read requests to the device | cnt |
| Disk Read Requests [Success] | Total successful read requests | cnt |
| Disk Request Size [Avg] | Average size of requests to the device | num |
| Disk Service Time [Avg] | Average service time of requests to the device | ms |
| Disk Wait Time [Avg] | Average wait time of requests to the device | ms |
| Disk Wait Time [Read] | Average read wait time of the device | ms |
| Disk Wait Time [Write] | Average write wait time of the device | ms |
| Disk Write Bytes [Delta Avg] | Average delta of bytes written to the device | bytes |
| Disk Write Bytes [Delta Max] | Maximum delta of bytes written to the device | bytes |
| Disk Write Bytes [Delta Min] | Minimum delta of bytes written to the device | bytes |
| Disk Write Bytes [Delta Sum] | Sum of delta of bytes written to the device | bytes |
| Disk Write Bytes [Delta] | Delta of bytes written to the device | bytes |
| Disk Write Bytes [Success] | Total bytes successfully written | bytes |
| Disk Write Requests | Number of write requests to the device per second | cnt |
| Disk Write Requests [Delta Avg] | Average delta of write requests to the device | cnt |
| Disk Write Requests [Delta Max] | Maximum delta of write requests to the device | cnt |
| Disk Write Requests [Delta Min] | Minimum delta of write requests to the device | cnt |
| Disk Write Requests [Delta Sum] | Sum of delta of write requests to the device | cnt |
| Disk Write Requests [Success Delta] | Delta of successful write requests to the device | cnt |
| Disk Write Requests [Success] | Total successful write requests | cnt |
| Disk Writes Bytes | Bytes written to the device per second | bytes |
| Filesystem Hang Check | Filesystem hang check (normal: 1, abnormal: 0) | status |
| Filesystem Nodes | Total number of filesystem nodes | cnt |
| Filesystem Nodes [Free] | Total number of available filesystem nodes | cnt |
| Filesystem Size [Available] | Available disk space in bytes | bytes |
| Filesystem Size [Free] | Free disk space in bytes | bytes |
| Filesystem Size [Total] | Total disk space in bytes | bytes |
| Filesystem Usage | Disk space usage rate | % |
| Filesystem Usage [Avg] | Average disk space usage rate | % |
| Filesystem Usage [Inode] | Inode usage rate | % |
| Filesystem Usage [Max] | Maximum disk space usage rate | % |
| Filesystem Usage [Min] | Minimum disk space usage rate | % |
| Filesystem Usage [Total] | Total disk space usage rate | % |
| Filesystem Used | Used disk space in bytes | bytes |
| Filesystem Used [Inode] | Used inode space in bytes | bytes |
| Memory Free | Total available memory in bytes | bytes |
| Memory Free [Actual] | Actual available memory in bytes | bytes |
| Memory Free [Swap] | Available swap memory in bytes | bytes |
| Memory Total | Total memory in bytes | bytes |
| Memory Total [Swap] | Total swap memory in bytes | bytes |
| Memory Usage | Memory usage rate | % |
| Memory Usage [Actual] | Actual memory usage rate | % |
| Memory Usage [Cache Swap] | Cache swap usage rate | % |
| Memory Usage [Swap] | Swap memory usage rate | % |
| Memory Used | Used memory in bytes | bytes |
| Memory Used [Actual] | Actual used memory in bytes | bytes |
| Memory Used [Swap] | Used swap memory in bytes | bytes |
| Collisions | Network collisions | cnt |
| Network In Bytes | Received bytes | bytes |
| Network In Bytes [Delta Avg] | Average delta of received bytes | bytes |
| Network In Bytes [Delta Max] | Maximum delta of received bytes | bytes |
| Network In Bytes [Delta Min] | Minimum delta of received bytes | bytes |
| Network In Bytes [Delta Sum] | Sum of delta of received bytes | bytes |
| Network In Bytes [Delta] | Delta of received bytes | bytes |
| Network In Dropped | Dropped received packets | cnt |
| Network In Errors | Received errors | cnt |
| Network In Packets | Received packets | cnt |
| Network In Packets [Delta Avg] | Average delta of received packets | cnt |
| Network In Packets [Delta Max] | Maximum delta of received packets | cnt |
| Network In Packets [Delta Min] | Minimum delta of received packets | cnt |
| Network In Packets [Delta Sum] | Sum of delta of received packets | cnt |
| Network In Packets [Delta] | Delta of received packets | cnt |
| Network Out Bytes | Sent bytes | bytes |
| Network Out Bytes [Delta Avg] | Average delta of sent bytes | bytes |
| Network Out Bytes [Delta Max] | Maximum delta of sent bytes | bytes |
| Network Out Bytes [Delta Min] | Minimum delta of sent bytes | bytes |
| Network Out Bytes [Delta Sum] | Sum of delta of sent bytes | bytes |
| Network Out Bytes [Delta] | Delta of sent bytes | bytes |
| Network Out Dropped | Dropped sent packets | cnt |
| Network Out Errors | Sent errors | cnt |
| Network Out Packets | Sent packets | cnt |
| Network Out Packets [Delta Avg] | Average delta of sent packets | cnt |
| Network Out Packets [Delta Max] | Maximum delta of sent packets | cnt |
| Network Out Packets [Delta Min] | Minimum delta of sent packets | cnt |
| Network Out Packets [Delta Sum] | Sum of delta of sent packets | cnt |
| Network Out Packets [Delta] | Delta of sent packets | cnt |
| Open Connections [TCP] | Open TCP connections | cnt |
| Open Connections [UDP] | Open UDP connections | cnt |
| Port Usage | Port usage rate | % |
| SYN Sent Sockets | Number of sockets in SYN_SENT state | cnt |
| Kernel PID Max | Maximum PID value | cnt |
| Kernel Thread Max | Maximum thread value | cnt |
| Process CPU Usage | CPU time used by the process | % |
| Process CPU Usage/Core | CPU time used by the process per core | % |
| Process Memory Usage | Resident Set size | % |
| Process Memory Used | Used memory by the process | bytes |
| Process PID | Process ID | PID |
| Process PPID | Parent process ID | PID |
| Processes [Dead] | Number of dead processes | cnt |
| Processes [Idle] | Number of idle processes | cnt |
| Processes [Running] | Number of running processes | cnt |
| Processes [Sleeping] | Number of sleeping processes | cnt |
| Processes [Stopped] | Number of stopped processes | cnt |
| Processes [Total] | Total number of processes | cnt |
| Processes [Unknown] | Number of unknown processes | cnt |
| Processes [Zombie] | Number of zombie processes | cnt |
| Running Process Usage | Process usage rate | % |
| Running Processes | Number of running processes | cnt |
| Running Thread Usage | Thread usage rate | % |
| Running Threads | Number of running threads | cnt |
| Context Switches | Context switches per second | cnt |
| Load/Core [1 min] | Load per core over 1 minute | cnt |
| Load/Core [15 min] | Load per core over 15 minutes | cnt |
| Load/Core [5 min] | Load per core over 5 minutes | cnt |
| Multipaths [Active] | Number of active multipath connections | cnt |
| Multipaths [Failed] | Number of failed multipath connections | cnt |
| Multipaths [Faulty] | Number of faulty multipath connections | cnt |
| NTP Offset | Measured offset from the NTP server | num |
| Run Queue Length | Run queue length | num |
| Uptime | System uptime in milliseconds | ms |
| Context Switchies | Context switches per second | cnt |
| Disk Read Bytes [Sec] | Bytes read from the device per second | cnt |
| Disk Read Time [Avg] | Average read time from the device | sec |
| Disk Transfer Time [Avg] | Average disk transfer time | sec |
| Disk Usage | Disk usage rate | % |
| Disk Write Bytes [Sec] | Bytes written to the device per second | cnt |
| Disk Write Time [Avg] | Average write time to the device | sec |
| Pagingfile Usage | Paging file usage rate | % |
| Pool Used [Non Paged] | Non-paged pool usage | bytes |
| Pool Used [Paged] | Paged pool usage | bytes |
| Process [Running] | Number of running processes | cnt |
| Threads [Running] | Number of running threads | cnt |
| Threads [Waiting] | Number of waiting threads | cnt |
Table. GPU Server Additional Monitoring Metrics (Agent Installation Required)
3.1.3 - ServiceWatch Metrics
GPU Server sends metrics to ServiceWatch. The metrics provided by default monitoring are data collected at 5‑minute intervals. If detailed monitoring is enabled, you can view data collected at 1‑minute intervals.
Information
- The basic monitoring and detailed monitoring of the GPU Server are provided with the same metrics as the Virtual Server, and the namespace is also provided as Virtual Server.
- GPU related metrics are provided through ServiceWatch Agent, and for how to collect metrics using ServiceWatch Agent, refer to the ServiceWatch Agent guide.
Reference
To check metrics in ServiceWatch, refer to the ServiceWatch guide.
How to enable detailed monitoring of GPU Server, please refer to How-to guides > ServiceWatch Enable Detailed Monitoring.
Basic Indicators
The following are the basic metrics for the Virtual Server namespace.
| Performance Item | Detailed Description | Unit | Meaningful Statistics |
|---|---|---|---|
| Instance State | Instance State Display | - | - |
| CPU Usage | CPU Usage | % |
|
| Disk Read Bytes | Capacity read from block device (bytes) | Bytes |
|
| Disk Read Requests | Number of read requests on block device | Count |
|
| Disk Write Bytes | Write capacity on block device (bytes) | Bytes |
|
| Disk Write Requests | Number of write requests on block device | Count |
|
| Network In Bytes | Capacity received from network interface (bytes) | Bytes |
|
| Network In Dropped | Number of packet drops received on network interface | Count |
|
| Network In Packets | Number of packets received on the network interface | Count |
|
| Network Out Bytes | Data transmitted from the network interface (bytes) | Bytes |
|
| Network Out Dropped | Number of packet drops transmitted from the network interface | Count |
|
| Network Out Packets | Number of packets transmitted from the network interface | Count |
|
Table. Virtual Server Basic Metrics
3.2 - How-to guides
The user can enter the required information of the GPU Server through the Samsung Cloud Platform Console, select detailed options, and create the service.
Create GPU Server
You can create and use GPU Server services from the Samsung Cloud Platform Console.
If you want to create a GPU Server, follow the steps below.
- All Services > Compute > GPU Server Please click the menu. Navigate to the GPU Server’s Service Home page.
- Service Home on the page, click the Create GPU Server button. Navigate to the Create GPU Server page.
- GPU Server creation On the page, enter the information required to create the service, and select detailed options.
- Image and version selection Select the required information in the area.
Category Required or notDetailed description Image Required Select provided image type - Ubuntu
Image version Required Select version of the chosen image - Provides a list of server image versions offered
Table. GPU Server image and version selection input items - Service Information Input Enter or select the required information in the area.
Category Required or notDetailed description Server count Required Number of GPU Server servers to create simultaneously - Only numbers can be entered, and input a value between 1 and 100
Service Type > Server Type Required GPU Server Server Type - Indicates the server specifications of GPU type, select a server that includes 1, 2, 4, or 8 GPUs
- For detailed information about the server types provided by GPU Server, refer to GPU Server Server Type
Service Type > Planned Compute Select Resource status with Planned Compute set - In Use: Number of resources with Planned Compute set that are currently in use
- Configured: Number of resources with Planned Compute set
- Coverage Preview: Amount applied per resource by Planned Compute
- Planned Compute Service Application: Go to the Planned Compute service application page
- For more details, refer to Apply for Planned Compute
Block Storage Required Set the Block Storage used by the GPU Server according to its purpose - Basic: Area where the OS is installed and used
- Capacity can be entered in Units (minimum capacity varies depending on the OS image type)
- RHEL: values between 3 and 1,536 can be entered
- Ubuntu: values between 3 and 1,536 can be entered
- SSD: high-performance general volume
- HDD: general volume
- SSD/HDD_KMS: additional encrypted volume using Samsung Cloud Platform KMS (Key Management System) encryption key
- Encryption can only be applied at initial creation (cannot be changed after creation)
- Performance degradation occurs when using SSD_KMS disk type
- Capacity can be entered in Units (minimum capacity varies depending on the OS image type)
- Additional: Used when additional user space is needed outside the OS area
- After selecting Use, enter the storage type and capacity
- To add storage, click the + button (up to 25 can be added); to delete, click the x button
- Capacity can be entered in Units, values between 1 and 1,536
- Since 1 Unit equals 8 GB, 8 to 12,288 GB can be created
- SSD: high-performance general volume
- HDD: general volume
- SSD/HDD_KMS: additional encrypted volume using Samsung Cloud Platform KMS (Key Management System) encryption key
- Encryption can only be applied at initial creation (cannot be changed after creation)
- Performance degradation may occur when using SSD_KMS disk type
- For detailed information on each Block Storage type, refer to Create Block Storage
- Delete on termination: If Delete on Termination is set to Enabled, the volume will be terminated together when the server is terminated
- Volumes with snapshots are not deleted even if Delete on termination is set to Enabled
- A multi-attach volume is deleted only when the server being terminated is the last remaining server attached to the volume
Table. GPU Server Service Configuration Items - Required Information Input Please enter or select the required information in the area.
Category RequiredDetailed description Server Name Required Enter a name to distinguish the server when the selected server count is 1 - Set hostname with the entered server name
- Use English letters, numbers, spaces, and special characters (
-_) within 63 characters
Server name Prefix Required Enter Prefix to distinguish each server generated when the selected number of servers is 2 or more - Automatically generated as user input value (prefix) + ‘
-#’ format
- Enter within 59 characters using English letters, numbers, spaces, and special characters (
-,_)
Network Settings > Create New Network Port Required Set the network where the GPU Server will be installed - Select a pre-created VPC.
- General Subnet: Select a pre-created General Subnet
- IP can be set to auto-generate or user input; if input is selected, the user can directly enter the IP
- NAT: Can be used only if there is one server and the VPC has an Internet Gateway attached. Use checked allows selection of NAT IP
- NAT IP: Select NAT IP
- If there is no NAT IP to select, click the Create New button to generate a Public IP
- Refresh button click to view and select the created Public IP
- Creating a Public IP incurs charges according to the Public IP pricing policy
- Local Subnet (Optional): Select Local Subnet Use
- Not a required element for creating the service
- A pre-created Local Subnet must be selected
- IP can be set to auto-generate or user input; input selected allows user to directly enter IP
- Security Group: Settings required to access the server
- Select: Choose a pre-created Security Group
- Create New: If there is no applicable Security Group, it can be created separately in the Security Group service
- Up to 5 can be selected
- If no Security Group is set, all access is blocked by default
- A Security Group must be set to allow required access
Network Settings > Existing Network Port Specification Required Set the network where the GPU Server will be installed - Select a pre-created VPC
- General Subnet: Select a pre-created General Subnet and Port
- NAT: Can be used only if there is one server and the VPC has an Internet Gateway attached; checking use allows selection of a NAT IP.
- NAT IP: Select NAT IP
- If there is no NAT IP to select, click the New Creation button to generate a Public IP
- Click the Refresh button to view and select the created Public IP
- Local Subnet (Optional): Select Use of Local Subnet
- Select a pre-created Local Subnet and Port
Keypair Required User authentication method to use when connecting to the server - New Creation: If a new Keypair is needed, create a new one
- Refer to Create Keypair for how to create a new Keypair
- List of default login accounts by OS
- RHEL: cloud-user
- Ubuntu: ubuntu
Table. GPU Server required information input items - Additional Information Input Enter or select the required information in the area.
Category RequiredDetailed description Lock Select Set whether to use Lock - Using Lock prevents actions such as server termination, start, stop from being executed, preventing malfunctions caused by mistakes
Init script Select Script executed when the server starts - The Init script must be written as a Batch script for Windows, a Shell script or cloud‑init for Linux, depending on the image type.
- Up to 45,000 bytes can be entered
Tag Select Add Tag - Up to 50 can be added per resource
- After clicking the Add Tag button, enter or select Key, Value values
Table. GPU Server Additional Information Input Items
- Image and version selection Select the required information in the area.
- Summary Check the detailed information and estimated billing amount generated in the panel, and click the Complete button.
- When creation is complete, check the created resources on the GPU Server list page.
GPU Server Check detailed information
GPU Server service can view and edit the full resource list and detailed information. GPU Server Detail page consists of Detail Information, Tags, Job History tabs.
To view detailed information about the GPU Server service, follow the steps below.
- All Services > Compute > GPU Server Click the menu. Go to the GPU Server’s Service Home page.
- Click the GPU Server menu on the Service Home page. Navigate to the GPU Server list page.
- GPU Server List Click the resource to view detailed information on the page. GPU Server Details You will be taken to the page.
- GPU Server Details page displays status information and additional feature information, and consists of Details, Tags, Job History tabs.
- GPU Server add-on features for detailed information, refer to GPU Server management add-on features.
Category Detailed description GPU Server status Status of GPU Server created by the user - Build: State where Build command has been delivered
- Building: Build in progress
- Networking: Server creation in‑progress process
- Scheduling: Server creation in‑progress process
- Block_Device_Mapping: Connecting Block Storage during server creation
- Spawning: State where server creation process is ongoing
- Active: Usable state
- Powering_off: State when stop request is made
- Deleting: Server deletion in progress
- Reboot_Started: Reboot in progress state
- Error: Error state
- Migrating: State where server is migrating to another host
- Reboot: State where Reboot command has been delivered
- Rebooting: Restart in progress
- Rebuild: State where Rebuild command has been delivered
- Rebuilding: State when Rebuild is requested
- Rebuild_Spawning: State where Rebuild process is ongoing
- Resize: State where Resize command has been delivered
- Resizing: Resize in progress
- Resize_Prep: State when server type modification is requested
- Resize_Migrating: State where server is moving to another host while Resize is in progress
- Resize_Migrated: State where server has completed moving to another host while Resize is in progress
- Resize_Finish: Resize completed
- Revert_Resize: Resize or migration of the server failed for some reason. The target server is cleaned up and the original server restarts
- Shutoff: State when Powering off is completed
- Verity_Resize: After Resize_Prep due to server type modification request, state where server type is confirmed / can choose to revert server type
- Resize_Reverting: State when server type revert is requested
- Resize_Confirming: State where server’s Resize request is being confirmed
Server Control Button to change server status - Start: Start a stopped server
- Stop: Stop a running server
- Restart: Restart a running server
Image Generation Create user custom image using the current server’s image Console Log View current server’s console log - You can check the console log output from the current server. For more details, refer to Check Console Log.
Dump creation Create a dump of the current server - The dump file is created inside the GPU Server
- For detailed dump creation method, refer to Create Dump
Rebuild All data and settings of the existing server are deleted, and a new server is set up - For details, refer to Perform Rebuild.
Service Cancellation Button to cancel the service Table. GPU Server status information and additional features
Detailed Information
GPU Server list page, you can view the detailed information of the selected resource and, if necessary, edit the information.
| Category | Detailed description |
|---|---|
| service | service name |
| Resource Type | Resource Type |
| SRN | Unique resource ID in Samsung Cloud Platform
|
| Resource Name | Resource Name
|
| Resource ID | Unique resource ID in the service |
| Creator | User who created the service |
| Creation time | Service creation time |
| Editor | User who edited the service information |
| Modification Date | Date Service Information Was Modified |
| Server name | Server name |
| Server Type | vCPU, Memory, GPU Information Display
|
| Image Name | Service OS Image and Version |
| Lock | Display Lock usage status
|
| Server Group | Server group name the server belongs to |
| Keypair name | Server authentication information set by the user |
| Planned Compute | Resource status with Planned Compute set
|
| Network | Network information of GPU Server
|
| Local Subnet | GPU Server’s Local Subnet Information
|
| Block Storage | Information of Block Storage connected to the server
|
Table. GPU Server detailed information tab items
tag
On the GPU Server List page, you can view the tag information of the selected resource, and you can add, modify, or delete it.
| Category | Detailed description |
|---|---|
| Tag List | Tag List
|
Table. GPU Server Tag Tab Items
Work History
You can view the job history of the selected resource on the GPU Server List page.
| Category | Detailed description |
|---|---|
| Work History List | Resource Change History
|
Table. Work History Tab Detailed Information Items
GPU Server Operation Control
If you need to control the operation of the generated GPU Server resources, you can perform the task on the GPU Server List or GPU Server Details page. You can start, stop, and restart a running server.
GPU Server Start
You can start a shutoff GPU Server. To start the GPU Server, follow the steps below.
- All Services > Compute > GPU Server Please click the menu. Navigate to the GPU Server’s Service Home page.
- Click the GPU Server menu on the Service Home page. Go to the GPU Server List page.
- GPU Server List page, click the resource to start among the shutoff servers, and go to the GPU Server Details page.
- GPU Server list page, you can start each resource via the right more button.
- After selecting multiple servers with the check box, you can control multiple servers simultaneously through the Start button at the top.
- GPU Server Details On the page, click the Start button at the top to start the server. Check the changed server status in the Status Display item.
- When the GPU Server start is completed, the server status changes from Shutoff to Active.
- For detailed information about the GPU Server status, please refer to Check GPU Server detailed information.
GPU Server Stop
You can stop a GPU Server that is active. To stop the GPU Server, follow the steps below.
- All Services > Compute > GPU Server Click the menu. Go to the Service Home page of GPU Server.
- Service Home page, click the GPU Server menu. Navigate to the GPU Server List page.
- GPU Server List page, click the resource to stop among the servers that are active (Active), and go to the GPU Server Details page.
- GPU Server List on the page, you can stop each resource via the right More button.
- After selecting multiple servers with the checkbox, you can control multiple servers simultaneously through the Stop button at the top.
- GPU Server Details page, click the top Stop button to start the server. Check the changed server status in the Status Display item.
- When GPU Server shutdown is completed, the server status changes from Active to Shutoff.
- For detailed information about the GPU Server status, please refer to Check GPU Server detailed information.
GPU Server Restart
You can restart the generated GPU Server. To restart the GPU Server, follow the steps below.
- All Services > Compute > GPU Server Please click the menu. Navigate to the GPU Server’s Service Home page.
- Click the GPU Server menu on the Service Home page. It navigates to the GPU Server List page.
- GPU Server List page, click the resource to restart, and navigate to the GPU Server Details page.
- GPU Server List page, you can restart each resource by using the right More button.
- After selecting multiple servers with the checkbox, you can control multiple servers simultaneously through the Restart button at the top.
- GPU Server Details on the page, click the Restart button at the top to start the server. Check the changed server status in the Status Display item.
- GPU Server during restart, the server status goes through Rebooting and finally changes to Active.
- For detailed information about the GPU Server status, please refer to Check GPU Server detailed information.
GPU Server Resource Management
If you need server control and management functions for the generated GPU Server resources, you can perform the work on the GPU Server Resource List or GPU Server Details page.
Image Create
You can create an image of a running GPU server.
Reference
This content provides instructions on how to create a user custom image using the image of a running GPU server.
- GPU Server list or GPU Server details page, click the Create Image button to create a user Custom Image.
To create an Image of the GPU Server, follow the steps below.
All Services > Compute > GPU Server Click the menu. Navigate to the GPU Server’s Service Home page.
Service Home page, click the GPU Server menu. Go to the GPU Server list page.
Click the resource to create an Image on the GPU Server List page. It navigates to the GPU Server Details page.
GPU Server Details on the page, click the Image Generation button. Navigate to the Image Generation page.
- Service Information Input area, please enter the required information.
Category RequiredDetailed description Image Name Required Image name to be generated - Enter within 200 characters using English letters, numbers, spaces, and special characters (
-_)
Table. Image Service Information Input Items - Enter within 200 characters using English letters, numbers, spaces, and special characters (
- Service Information Input area, please enter the required information.
Check the input information and click the Complete button.
- When creation is complete, check the created resources on the All Services > Compute > GPU Server > Image List page.
Notice
- If you create an Image, the generated Image is stored in the Object Storage used as internal storage. Therefore, Object Storage usage fees are charged.
- Active state GPU Server-generated image’s file system cannot guarantee integrity, so image creation after server shutdown is recommended.
ServiceWatch Enable Detailed Monitoring
Basically, the GPU Server is linked with the basic monitoring of ServiceWatch and the Virtual Server namespace. You can enable detailed monitoring as needed to more quickly identify and address operational issues. For more information about ServiceWatch, see the ServiceWatch Overview (/userguide/management/service_watch/overview/).
Reference
GPU Server provides basic and detailed monitoring in the same namespace as Virtual Server.
GPU Server’s GPU metrics are scheduled to be provided by ServiceWatch Agent. (Scheduled for Dec 2025)
Caution
Basic monitoring is provided for free, but activating detailed monitoring incurs additional charges. Please be aware when using.
To enable detailed monitoring of ServiceWatch on the GPU Server, follow these steps.
- All Services > Compute > GPU Server Please click the menu. Navigate to the GPU Server’s Service Home page.
- Click the GPU Server menu on the Service Home page. Navigate to the GPU Server list page.
- On the GPU Server List page, click the resource to enable ServiceWatch detailed monitoring. You will be taken to the GPU Server Details page.
- GPU Server Details page, click the ServiceWatch detailed monitoring Edit button. You will be taken to the ServiceWatch Detailed Monitoring Edit popup.
- ServiceWatch Detailed Monitoring Modification In the popup window, after selecting Enable, check the guidance text and click the Confirm button.
- GPU Server Details page, check the ServiceWatch detailed monitoring items.
ServiceWatch Disable detailed monitoring
Caution
Disabling detailed monitoring is required for cost efficiency. Keep detailed monitoring enabled only when absolutely necessary, and disable detailed monitoring for the rest.
To disable the detailed monitoring of ServiceWatch on the GPU Server, follow the steps below.
- All Services > Compute > GPU Server Please click the menu. Navigate to the GPU Server’s Service Home page.
- Service Home page, click the GPU Server menu. Navigate to the GPU Server list page.
- Click the resource to disable ServiceWatch detailed monitoring on the GPU Server List page. It navigates to the GPU Server Details page.
- GPU Server Details page, click the ServiceWatch detailed monitoring Edit button. It moves to the ServiceWatch Detailed Monitoring Edit popup.
- ServiceWatch Detailed Monitoring Edit in the popup window, after deselecting Enable, check the guide text and click the Confirm button.
- GPU Server Details page, check the ServiceWatch detailed monitoring items.
GPU Server Management Additional Features
For GPU Server management, you can view Console logs, generate Dump, and Rebuild. To view Console logs, generate Dump, and Rebuild the GPU Server, follow the steps below.
Check console log
You can view the current console log of the GPU Server.
To check the console logs of the GPU Server, follow the steps below.
- All Services > Compute > GPU Server Please click the menu. Navigate to the GPU Server’s Service Home page.
- Click the GPU Server menu on the Service Home page. Navigate to the GPU Server List page.
- On the GPU Server List page, click the resource to view the console log. Navigate to the GPU Server Details page.
- GPU Server Details on the page, click the Console Log button. It will move to the Console Log popup window.
- Console Log Check the console log displayed in the popup window.
Create Dump
To create a Dump file of the GPU Server, follow the steps below.
- All Services > Compute > GPU Server Click the menu. Navigate to the GPU Server’s Service Home page.
- Click the GPU Server menu on the Service Home page. Navigate to the GPU Server List page.
- GPU Server List Click the resource to view detailed information on the page. GPU Server Details Navigate to the page.
- GPU Server Details on the page Create Dump Click the button.
- The dump file is created inside the GPU Server.
Rebuild perform
You can delete all data and settings of the existing GPU Server and rebuild it on a new server.
To perform the Rebuild of the GPU Server, follow the steps below.
- All Services > Compute > GPU Server Click the menu. Navigate to the Service Home page of GPU Server.
- Click the GPU Server menu on the Service Home page. It navigates to the GPU Server List page.
- GPU Server List page, click the resource to perform Rebuild. GPU Server Details page will be opened.
- GPU Server Details on the page click the Rebuild button.
- During GPU Server Rebuild, the server status changes to Rebuilding, and when the Rebuild is completed, it returns to the state before the Rebuild.
- For detailed information about the GPU Server status, please refer to Check GPU Server detailed information.
GPU Server Cancel
If you cancel an unused GPU Server, you can reduce operating costs. However, if you cancel a GPU Server, the service currently running may be stopped immediately, so you should proceed with the cancellation after fully considering the impact that may occur when the service is interrupted.
Caution
Please note that data cannot be recovered after service termination.
To cancel the GPU Server, follow the steps below.
- All Services > Compute > GPU Server Click the menu. Navigate to the GPU Server’s Service Home page.
- Click the GPU Server menu on the Service Home page. Navigate to the GPU Server List page.
- GPU Server List on the page, select the resource to cancel, and click the Cancel Service button.
- The termination of connected storage depends on the Delete on termination setting, so please refer to Termination Constraints.
- When termination is completed, check on the GPU Server List page whether the resource has been terminated.
Termination Constraints
If the termination request for GPU Server cannot be processed, we will guide you with a popup window. Please refer to the cases below.
Cancellation not allowed
- If File Storage is connected, please disconnect the File Storage connection first.
- If LB Pool is connected please disconnect the LB Pool connection first.
- When Lock is set please change the Lock setting to unused and try again.
The termination of attached storage depends on the Delete on termination setting.
Delete on termination Delete per setting
- Delete on termination Whether the volume deletion also varies depending on the setting.
- Delete on termination If not set: Even if you terminate the GPU Server, the volume will not be deleted.
- Delete on termination when set: If you terminate the GPU Server, the volume will be deleted.
- Volumes with a Snapshot will not be deleted even if Delete on termination is set.
- Multi attach volume is deleted only when the server you are trying to delete is the last remaining server attached to the volume.
3.2.1 - Image Management
Users can enter the required information for the Image service within the GPU Server service and select detailed options through the Samsung Cloud Platform Console to create the respective service.
Image Generation
You can create an image of a running GPU Server. To create an image of a GPU Server, please refer to Create Image.
Image Check detailed information
Image service allows you to view and edit the full resource list and detailed information. Image detail page consists of detail information, tags, operation history tabs.
To view detailed information of the Image service, follow the steps below.
- All Services > Compute > GPU Server Click the menu. Navigate to the Service Home page of GPU Server.
- Click the Image menu on the Service Home page. Go to the Image List page.
- Image List page, click the resource to view detailed information. You will be taken to the Image Detail page.
- Image Details page displays status information and additional feature information, and consists of Detail Information, Tag, Work History tabs.
Category Detailed description Image Status User-generated Image’s status - Active: Available state
- Queued: When creating Image, Image is uploaded and waiting for processing
- Importing: When creating Image, Image is uploaded and being processed
Share to another Account Image can be shared to another Account - Image’s Visibility must be in Shared state to be able to share to another Account
Delete Image Button to delete the Image - If the Image is deleted, it cannot be recovered
Table. GPU Server Image status information and additional features
- Image Details page displays status information and additional feature information, and consists of Detail Information, Tag, Work History tabs.
Detailed Information
Image list page allows you to view detailed information of the selected resource and edit the information if necessary.
| Category | Detailed description |
|---|---|
| Service | Service Name |
| Resource Type | Resource Type |
| SRN | Unique resource ID in Samsung Cloud Platform
|
| Resource Name | Image Name |
| Resource ID | Image ID |
| Creator | User who created the Image |
| Creation date/time | Date/time when the image was created |
| Editor | User who edited the Image |
| Edit date/time | Date and time the image was edited |
| Image name | Image name |
| Minimum Disk | Image’s minimum disk capacity (GB)
|
| Minimum RAM | Image’s minimum RAM capacity (GB) |
| OS type | Image’s OS type |
| OS hash algorithm | OS hash algorithm method |
| Visibility | Displays access permissions for images
|
| Protected | Select whether image deletion is prohibited
|
| Image File URL | Image file URL uploaded when generating image
|
| Sharing Status | Status of sharing images with other Accounts
|
Table. Image detailed information tab items
Tag
On the Image list page, you can view the tag information of the selected resource, and you can add, modify, or delete it.
| Category | Detailed description |
|---|---|
| Tag List | Tag List
|
Table. Image tag tab items
Work History
You can view the operation history of the selected resource on the Image list page.
| Category | Detailed description |
|---|---|
| Work History List | Resource Change History
|
Table. GPU Server Image Job History Tab Detailed Information Items
Image Resource Management
Describes the control and management functions of the generated image.
Share to another account
To share the Image with another Account, follow the steps below.
- Log in to the shared Account and click the All Services > Compute > GPU Server menu. Navigate to the GPU Server’s Service Home page.
- Click the Image menu on the Service Home page. Go to the Image list page.
- Click the Image to control on the Image List page. It moves to the Image Detail page.
- Click the Share to another Account button. It navigates to the Share image to another Account page.
- Share to another Account feature allows you to share the Image with another Account. To share the Image with another Account, the Image’s Visibility must be Shared.
- Share images to another Account On the page, enter the required information and click the Complete button.
Category Required or notDetailed description Image Name - Name of the image to share - Input not allowed
Image ID - Image ID to share - Input not allowed
Shared Account ID Required Enter another Account ID to share - Enter within 64 characters using English letters, numbers, special characters
-
Table. Required input items for sharing images to another Account - Image Details page’s sharing status can be checked for information.
- At the initial request, the status is Pending, and when approval is completed in the account to be shared, it changes to Accepted.
Notice
Only the Image created by the current user’s Image file upload can be shared with another Account. If a Custom Image is created from the Image of a running GPU Server, it cannot be shared with another Account, and this feature is planned to be provided, so please note.
Receive sharing from another account
To receive an Image shared from another Account, follow the steps below.
- Log in to the account to be shared and click the 모든 서비스 > Compute > GPU Server menu. Navigate to the Service Home page of the GPU Server.
- Click the Image menu on the Service Home page. Go to the Image list page.
- Image List on the page click the Get Image Share button. Go to the Get Image Share popup window.
- Receive Image Share In the popup window, enter the resource ID of the Image you want to receive, and click the Confirm button.
- When image sharing is completed, you can check the shared Image in the Image list.
Image Delete
You can delete unused Images. However, once an Image is deleted it cannot be recovered, so you should fully consider the impact before proceeding with the deletion.
Caution
Please be careful because data cannot be recovered after deleting the service.
To delete the image, follow the steps below.
- All Services > Compute > GPU Server Click the menu. Navigate to the GPU Server’s Service Home page.
- Click the Image menu on the Service Home page. Go to the Image List page.
- On the Image list page, select the resource to delete and click the Delete button.
- Image list page, select multiple Image check boxes, and click the Delete button at the top of the resource list.
- When deletion is complete, check on the Image List page whether the resource has been deleted.
3.2.2 - Using Multi-instance GPU in GPU Server
After creating a GPU Server, you can enable the MIG (Multi-instance GPU) feature on the GPU Server’s VM (Guest OS) and create an instance to use it.
Multi-instance GPU (NVIDIA A100) Overview
NVIDIA A100 is a Multi-instance GPU (MIG) based on the NVIDIA Ampere architecture, which can be securely divided into up to 7 independent GPU instances to operate CUDA (Compute Unified Device Architecture) applications. The NVIDIA A100 provides independent GPU resources to multiple users by allocating computing resources in a way optimized for GPU usage while utilizing high-bandwidth memory (HBM) and cache. Users can maximize GPU utilization by utilizing workloads that have not reached the maximum computing capacity of the GPU through parallel execution of each workload.
Using Multi-instance GPU Feature
To use the multi-instance GPU feature, you must create a GPU Server service on the Samsung Cloud Platform and then create a VM Instance (GuestOS) with an A100 GPU assigned. After completing the GPU Server creation, you can follow the MIG application order and MIG release order below to apply it.
MIG Application Order
MIG activation → GPU Instance creation → Compute Instance creation → MIG usage
MIG Removal Order
Compute Instance deletion → GPU Instance deletion → MIG feature deactivation(disabling)
Reference
- The system requirements for using the MIG feature are as follows (refer to NVIDIA - Supported GPUs).
- CUDA toolkit 11, NVIDIA driver 450.80.02 or later version
- Linux distribution operating system supporting CUDA toolkit 11
- When operating a container or Kubernetes service, the requirements for using the MIG feature are as follows.
- NVIDIA Container Toolkit(nvidia-docker2) v 2.5.0 or later version
- NVIDIA K8s Device Plugin v 0.7.0 or later version
- NVIDIA gpu-feature-discovery v 0.2.0 or later version
MIG Application and Usage
To activate MIG and create an instance to assign a task, follow these steps.
MIG Application Order
MIG activation → GPU Instance creation → Compute Instance creation → MIG usage
MIG Activation
Check the GPU status on the VM Instance (GuestOS) before applying MIG.
- MIG mode is Disabled status, please check.Color mode
$ nvidia-smi
Mon Sep 27 08:37:08 2021
+-----------------------------------------------------------------------------+
| NVIDIA-SMI 470.57.02    Driver Version: 470.57.02    CUDA Version: 11.4     |
|-------------------------------+----------------------+----------------------|
| GPU  Name        Persistence-M| Bus-Id        Disp.A | Volatile Uncorr. ECC |
| Fan  Temp  Perf  Pwr:Usage/Cap|         Memory-Usage | GPU-Util  Compute M. |
|                               |                      |               MIG M. |
|===============================+======================+======================|
|   0  NVDIA A100-SXM...  Off   | 00000000:05:00.0 Off |                    0 |
| N/A   32C   P0    59W / 400W  |      0MiB / 81251MiB |      0%      Default |
|                               |                      |             Disabled |
+-------------------------------+----------------------+----------------------+

+-----------------------------------------------------------------------------+
| Processes:                                                                  |
|  GPU   GI   CI       PID   Type   Process name                   GPU Memory |
|        ID   ID                                                   Usage      |
|=============================================================================|
| No running processes found                                                  |
+-----------------------------------------------------------------------------+
$ nvidia-smi Mon Sep 27 08:37:08 2021 +-----------------------------------------------------------------------------+ | NVIDIA-SMI 470.57.02 Driver Version: 470.57.02 CUDA Version: 11.4 | |-------------------------------+----------------------+----------------------| | GPU Name Persistence-M| Bus-Id Disp.A | Volatile Uncorr. ECC | | Fan Temp Perf Pwr:Usage/Cap| Memory-Usage | GPU-Util Compute M. | | | | MIG M. | |===============================+======================+======================| | 0 NVDIA A100-SXM... Off | 00000000:05:00.0 Off | 0 | | N/A 32C P0 59W / 400W | 0MiB / 81251MiB | 0% Default | | | | Disabled | +-------------------------------+----------------------+----------------------+ +-----------------------------------------------------------------------------+ | Processes: | | GPU GI CI PID Type Process name GPU Memory | | ID ID Usage | |=============================================================================| | No running processes found | +-----------------------------------------------------------------------------+Code block. nvidia-smi command - Check GPU inactive state (1) Color mode$ nvidia-smi –L GPU 0: NVIDIA A100-SXM-80GB (UUID: GPU-c956838f-494a-92b2-6818-56eb28fe25e0)$ nvidia-smi –L GPU 0: NVIDIA A100-SXM-80GB (UUID: GPU-c956838f-494a-92b2-6818-56eb28fe25e0)Code block. nvidia-smi command - Check GPU inactive state (2)
- MIG mode is Disabled status, please check.
In the VM Instance(GuestOS), enable MIG for each GPU and reboot the VM Instance.
Color mode$ nvidia-smi –I 0 –mig 1 Enabled MIG mode for GPU 00000000:05:00.0 All done. # reboot$ nvidia-smi –I 0 –mig 1 Enabled MIG mode for GPU 00000000:05:00.0 All done. # rebootCode Block. nvidia-smi Command - MIG Activation
Note
If the GPU monitoring agent displays the following warning message, stop the nvsm and dcgm services before enabling MIG.
Warning: MIG mode is in pending enable state for GPU 00000000:05:00.0: In use by another client. 00000000:05:00.0 is currently being used by one or more other processes (e.g. CUDA application or a monitoring application such as another instance of nvidia-smi).

# systemctl stop nvsm
# systemctl stop dcgm
- After completing the MIG work, restart the nvsm and dcgm services.
- Check the GPU status after applying MIG in the VM Instance(GuestOS).
- MIG mode must be in Enabled state.Color mode
$ nvidia-smi
Mon Sep 27 09:44:33 2021
+-----------------------------------------------------------------------------+
| NVIDIA-SMI 470.57.02    Driver Version: 470.57.02    CUDA Version: 11.4     |
|-------------------------------+----------------------+----------------------|
| GPU  Name        Persistence-M| Bus-Id        Disp.A | Volatile Uncorr. ECC |
| Fan  Temp  Perf  Pwr:Usage/Cap|         Memory-Usage | GPU-Util  Compute M. |
|                               |                      |               MIG M. |
|===============================+======================+======================|
|   0  NVDIA A100-SXM...  Off   | 00000000:05:00.0 Off |                   On |
| N/A   32C   P0    59W / 400W  |      0MiB / 81251MiB |      0%      Default |
|                               |                      |              Enabled |
+-------------------------------+----------------------+----------------------+
+-----------------------------------------------------------------------------+
| MIG devices:                                                                |
+-----------------------------------------------------------------------------+
|  GPU  GI  CI  MIG |        Memory-Usage |        Vol|        Shared         |
|       ID  ID  Dev |          BAR1-Usage | SM     Unc| CE  ENC  DEC  OFA  JPG|
|                   |                     |        ECC|                       |
|=============================================================================|
| No MIG devices found                                                        |
+-----------------------------------------------------------------------------+
+-----------------------------------------------------------------------------+
| Processes:                                                                  |
|  GPU   GI   CI       PID   Type   Process name                   GPU Memory |
|        ID   ID                                                   Usage      |
|=============================================================================|
| No running processes found                                                  |
+-----------------------------------------------------------------------------+
$ nvidia-smi Mon Sep 27 09:44:33 2021 +-----------------------------------------------------------------------------+ | NVIDIA-SMI 470.57.02 Driver Version: 470.57.02 CUDA Version: 11.4 | |-------------------------------+----------------------+----------------------| | GPU Name Persistence-M| Bus-Id Disp.A | Volatile Uncorr. ECC | | Fan Temp Perf Pwr:Usage/Cap| Memory-Usage | GPU-Util Compute M. | | | | MIG M. | |===============================+======================+======================| | 0 NVDIA A100-SXM... Off | 00000000:05:00.0 Off | On | | N/A 32C P0 59W / 400W | 0MiB / 81251MiB | 0% Default | | | | Enabled | +-------------------------------+----------------------+----------------------+ +-----------------------------------------------------------------------------+ | MIG devices: | +-----------------------------------------------------------------------------+ | GPU GI CI MIG | Memory-Usage | Vol| Shared | | ID ID Dev | BAR1-Usage | SM Unc| CE ENC DEC OFA JPG| | | | ECC| | |=============================================================================| | No MIG devices found | +-----------------------------------------------------------------------------+ +-----------------------------------------------------------------------------+ | Processes: | | GPU GI CI PID Type Process name GPU Memory | | ID ID Usage | |=============================================================================| | No running processes found | +-----------------------------------------------------------------------------+Code block. nvidia-smi command - Check GPU activation status (1) Color mode$ nvidia-smi –L GPU 0: NVIDIA A100-SXM-80GB (UUID: GPU-c956838f-494a-92b2-6818-56eb28fe25e0)$ nvidia-smi –L GPU 0: NVIDIA A100-SXM-80GB (UUID: GPU-c956838f-494a-92b2-6818-56eb28fe25e0)Code block. nvidia-smi command - Check GPU activation status (2)
- MIG mode must be in Enabled state.
GPU Instance Creation
After activating MIG and checking the status, you can create a GPU Instance.
Check the list of MIG GPU instance profiles that can be created.
Color mode$ nvidia-smi mig -i [GPU ID] -lgip$ nvidia-smi mig -i [GPU ID] -lgipCode block. nvidia-smi command - MIG GPU Instance profile list check Color mode$ nvidia-smi mig -i 0 -lgip +-----------------------------------------------------------------------------+ | GPU instance profiles: | | GPU Name ID Instances Memory P2P SM DEC ENC | | Free/Total GiB CE JPEG OFA | |=============================================================================| | 0 MIG 1g.10gb 19 7/7 9.50 No 14 0 0 | | 1 0 0 | +-----------------------------------------------------------------------------+ | 0 MIG 1g.10gb+me 20 1/1 9.50 No 14 0 0 | | 1 1 1 | +-----------------------------------------------------------------------------+ | 0 MIG 2g.20gb 14 3/3 19.50 No 28 1 0 | | 2 0 0 | +-----------------------------------------------------------------------------+ | 0 MIG 3g.40gb 9 2/2 39.50 No 42 2 0 | | 3 0 0 | +-----------------------------------------------------------------------------+ | 0 MIG 4g.40gb 5 1/1 39.50 No 56 2 0 | | 4 0 0 | +-----------------------------------------------------------------------------+ | 0 MIG 7g.80gb 0 1/1 79.25 No 98 0 0 | | 7 1 1 | +-----------------------------------------------------------------------------+$ nvidia-smi mig -i 0 -lgip +-----------------------------------------------------------------------------+ | GPU instance profiles: | | GPU Name ID Instances Memory P2P SM DEC ENC | | Free/Total GiB CE JPEG OFA | |=============================================================================| | 0 MIG 1g.10gb 19 7/7 9.50 No 14 0 0 | | 1 0 0 | +-----------------------------------------------------------------------------+ | 0 MIG 1g.10gb+me 20 1/1 9.50 No 14 0 0 | | 1 1 1 | +-----------------------------------------------------------------------------+ | 0 MIG 2g.20gb 14 3/3 19.50 No 28 1 0 | | 2 0 0 | +-----------------------------------------------------------------------------+ | 0 MIG 3g.40gb 9 2/2 39.50 No 42 2 0 | | 3 0 0 | +-----------------------------------------------------------------------------+ | 0 MIG 4g.40gb 5 1/1 39.50 No 56 2 0 | | 4 0 0 | +-----------------------------------------------------------------------------+ | 0 MIG 7g.80gb 0 1/1 79.25 No 98 0 0 | | 7 1 1 | +-----------------------------------------------------------------------------+Code Block. MIG GPU Instance Profile List
Note
A100 GPU Instance profile refers to the example of NVIDIA A100 MIG Profile.

| Profile Name | Fraction of Memory | Fraction of SMs | Hardware Units | L2 Cache Size | Number of Instances Available |
|---|---|---|---|---|---|
| MIG 1g.10gb | 1/8 | 1/7 | 0 NVDECs /0 JPEG /0 OFA | 1/8 | 7 |
| MIG 1g.10gb+me | 1/8 | 1/7 | 1 NVDEC /1 JPEG /1 OFA | 1/8 | 1 (A single 1g profile can include media extensions) |
| MIG 2g.20gb | 2/8 | 2/7 | 1 NVDECs /0 JPEG /0 OFA | 2/8 | 3 |
| MIG 3g.40gb | 4/8 | 3/7 | 2 NVDECs /0 JPEG /0 OFA | 4/8 | 2 |
| MIG 4g.40gb | 4/8 | 4/7 | 2 NVDECs /0 JPEG /0 OFA | 4/8 | 1 |
| MIG 7g.80gb | Full | 7/7 | 5 NVDECs /1 JPEG /1 OFA | Full | 1 |
Table. NVIDIA A100 MIG Profile
Note
MIG 1g.10gb+me profile can only be used when starting with the R470 driver.
- Check after creating the MIG GPU Instance.
GPU Instance creation
Color mode$ nvidia-smi mig -i [GPU ID] -cgi [Profile ID]$ nvidia-smi mig -i [GPU ID] -cgi [Profile ID]Code Block. nvidia-smi command - GPU Instance creation Color mode$ nvidia-smi mig -i 0 -cgi 0 Successfully created GPU instance ID 0 on GPU 0 using profile MIG 7g.80gb (ID 0)$ nvidia-smi mig -i 0 -cgi 0 Successfully created GPU instance ID 0 on GPU 0 using profile MIG 7g.80gb (ID 0)Code block. nvidia-smi command - GPU Instance creation example GPU Instance check
Color mode$ nvidia-smi mig -i [GPU ID] -lgi$ nvidia-smi mig -i [GPU ID] -lgiCode Block. nvidia-smi Command - GPU Instance Check Color mode$ nvidia-smi mig -i 0 -lgi +--------------------------------------------------------+ | GPU instances: | | GPU Name Profile Instance Placement | | ID ID Start:Size | |========================================================| | 0 MIG 7g.80gb 0 0 0:8 | +--------------------------------------------------------+$ nvidia-smi mig -i 0 -lgi +--------------------------------------------------------+ | GPU instances: | | GPU Name Profile Instance Placement | | ID ID Start:Size | |========================================================| | 0 MIG 7g.80gb 0 0 0:8 | +--------------------------------------------------------+Code block. nvidia-smi command - GPU Instance check example
Compute Instance Creation
If you have created a GPU Instance, you can create a Compute Instance.
Check the MIG Compute Instance profile that can be created.
Color mode$ nvidia-smi mig -i [GPU ID] -gi [GPU Instance ID] -lcip$ nvidia-smi mig -i [GPU ID] -gi [GPU Instance ID] -lcipCode Block. nvidia-smi command - MIG Compute Instance profile check Color mode$ nvidia-smi mig -i 0 -gi 0 -lcip +---------------------------------------------------------------------------------+ | Compute instance profiles: | | GPU GPU Name Profile Instances Exclusive Shared | | GPU Instance ID Free/Total SM DEC ENC OFA | | ID CE JPEG | |=================================================================================| | 0 0 MIG 1c.7g.80gb 0 7/7 14 5 0 1 | | 7 1 | +---------------------------------------------------------------------------------+ | 0 0 MIG 2c.7g.80gb 1 3/3 28 5 0 1 | | 7 1 | +---------------------------------------------------------------------------------+ | 0 0 MIG 3c.7g.80gb 2 2/2 42 5 0 1 | | 7 1 | +---------------------------------------------------------------------------------+ | 0 0 MIG 4c.7g.80gb 3 1/1 56 5 0 1 | | 7 1 | +---------------------------------------------------------------------------------+ | 0 0 MIG 7g.80gb 4* 1/1 98 5 0 1 | | 7 1 | +---------------------------------------------------------------------------------+$ nvidia-smi mig -i 0 -gi 0 -lcip +---------------------------------------------------------------------------------+ | Compute instance profiles: | | GPU GPU Name Profile Instances Exclusive Shared | | GPU Instance ID Free/Total SM DEC ENC OFA | | ID CE JPEG | |=================================================================================| | 0 0 MIG 1c.7g.80gb 0 7/7 14 5 0 1 | | 7 1 | +---------------------------------------------------------------------------------+ | 0 0 MIG 2c.7g.80gb 1 3/3 28 5 0 1 | | 7 1 | +---------------------------------------------------------------------------------+ | 0 0 MIG 3c.7g.80gb 2 2/2 42 5 0 1 | | 7 1 | +---------------------------------------------------------------------------------+ | 0 0 MIG 4c.7g.80gb 3 1/1 56 5 0 1 | | 7 1 | +---------------------------------------------------------------------------------+ | 0 0 MIG 7g.80gb 4* 1/1 98 5 0 1 | | 7 1 | +---------------------------------------------------------------------------------+Code block. MIG Compute Instance profile list example Create and check the MIG Compute Instance.
- MIG Compute Instance creationColor mode
$ nvidia-smi mig -i [GPU ID] -gi [GPU Instance ID] -cci [Compute Profile ID]$ nvidia-smi mig -i [GPU ID] -gi [GPU Instance ID] -cci [Compute Profile ID]Code Block. nvidia-smi command - MIG Compute Instance creation Color mode$ nvidia-smi mig -i 0 -gi 0 -cci 4 Successfully created compute instance ID 0 on GPU instance ID 0 using profile MIG 7g.80gb(ID 4)$ nvidia-smi mig -i 0 -gi 0 -cci 4 Successfully created compute instance ID 0 on GPU instance ID 0 using profile MIG 7g.80gb(ID 4)Code block. nvidia-smi command - MIG Compute Instance creation example - MIG Compute Instance checkColor mode
$ nvidia-smi mig -i [GPU ID] -gi [GPU Instance ID] –lci$ nvidia-smi mig -i [GPU ID] -gi [GPU Instance ID] –lciCode block. nvidia-smi command - MIG Compute Instance check Color mode$ nvidia-smi mig -i 0 -gi 0 –lci +-----------------------------------------------------------------+ | Compute instance profiles: | | GPU GPU Name Profile Instances Placement | | GPU Instance ID ID Start:Size | | ID | |=================================================================| | 0 0 MIG 7g.80gb 4 0 0:7 | +-----------------------------------------------------------------+$ nvidia-smi mig -i 0 -gi 0 –lci +-----------------------------------------------------------------+ | Compute instance profiles: | | GPU GPU Name Profile Instances Placement | | GPU Instance ID ID Start:Size | | ID | |=================================================================| | 0 0 MIG 7g.80gb 4 0 0:7 | +-----------------------------------------------------------------+Code block. MIG Compute Instance confirmation example Color mode$ nvidia-smi –L GPU 0: NVIDIA A100-SXM-80GB (UUID: GPU-c956838f-494a-92b2-6818-56eb28fe25e0) MIG 7g.80gb Device 0: (UUID: MIG-53e20040-758b-5ecb-948e-c626d03a9a32)$ nvidia-smi –L GPU 0: NVIDIA A100-SXM-80GB (UUID: GPU-c956838f-494a-92b2-6818-56eb28fe25e0) MIG 7g.80gb Device 0: (UUID: MIG-53e20040-758b-5ecb-948e-c626d03a9a32)Code block. nvidia-smi command - Check GPU status (1) Color mode$ nvidia-smi Mon Sep 27 09:52:17 2021 +-----------------------------------------------------------------------------+ | NVIDIA-SMI 470.57.02 Driver Version: 470.57.02 CUDA Version: 11.4 | |-------------------------------+----------------------+----------------------| | GPU Name Persistence-M| Bus-Id Disp.A | Volatile Uncorr. ECC | | Fan Temp Perf Pwr:Usage/Cap| Memory-Usage | GPU-Util Compute M. | | | | MIG M. | |===============================+======================+======================| | 0 NVDIA A100-SXM... Off | 00000000:05:00.0 Off | On | | N/A 32C P0 49W / 400W | 0MiB / 81251MiB | N/A Default | | | | Enabled | +-------------------------------+----------------------+----------------------+ +-----------------------------------------------------------------------------+ | MIG devices: | +-----------------------------------------------------------------------------+ | GPU GI CI MIG | Memory-Usage | Vol| Shared | | ID ID Dev | BAR1-Usage | SM Unc| CE ENC DEC OFA JPG| | | | ECC| | |=============================================================================| | 0 0 0 0 | 0MiB / 81251MiB | 98 0 | 7 0 5 1 1 | | | 1MiB / 13107... | | | +-----------------------------------------------------------------------------+ +-----------------------------------------------------------------------------+ | Processes: | | GPU GI CI PID Type Process name GPU Memory | | ID ID Usage | |=============================================================================| | No running processes found | +-----------------------------------------------------------------------------+$ nvidia-smi Mon Sep 27 09:52:17 2021 +-----------------------------------------------------------------------------+ | NVIDIA-SMI 470.57.02 Driver Version: 470.57.02 CUDA Version: 11.4 | |-------------------------------+----------------------+----------------------| | GPU Name Persistence-M| Bus-Id Disp.A | Volatile Uncorr. ECC | | Fan Temp Perf Pwr:Usage/Cap| Memory-Usage | GPU-Util Compute M. | | | | MIG M. | |===============================+======================+======================| | 0 NVDIA A100-SXM... Off | 00000000:05:00.0 Off | On | | N/A 32C P0 49W / 400W | 0MiB / 81251MiB | N/A Default | | | | Enabled | +-------------------------------+----------------------+----------------------+ +-----------------------------------------------------------------------------+ | MIG devices: | +-----------------------------------------------------------------------------+ | GPU GI CI MIG | Memory-Usage | Vol| Shared | | ID ID Dev | BAR1-Usage | SM Unc| CE ENC DEC OFA JPG| | | | ECC| | |=============================================================================| | 0 0 0 0 | 0MiB / 81251MiB | 98 0 | 7 0 5 1 1 | | | 1MiB / 13107... | | | +-----------------------------------------------------------------------------+ +-----------------------------------------------------------------------------+ | Processes: | | GPU GI CI PID Type Process name GPU Memory | | ID ID Usage | |=============================================================================| | No running processes found | +-----------------------------------------------------------------------------+Code block. nvidia-smi command - Check GPU status (2)
- MIG Compute Instance creation
Using MIG
- Use the MIG Instance to perform the Job.
- Work execution exampleYou can check an example of how to perform the task as follows.Color mode
$ docker run --gpus '"device=[GPU ID]:[MIG ID]"' -rm nvcr.io/nvidia/cuda nvidia-smi$ docker run --gpus '"device=[GPU ID]:[MIG ID]"' -rm nvcr.io/nvidia/cuda nvidia-smiCode Block. Work Execution Example Color mode$ docker run --gpus '"device=0:0"' -rm -it --network=host --shm-size=1g --ipc=host -v /root/.ssh/:/root/.ssh ================ == TensorFlow == ================ NVIDIA Release 21.08-tf1 (build 26012104) TensorFlow Version 1.15.5 Container image Copyright (c) 2021, NVIDIA CORPORATION. All right reserved. ... # Python process execution root@d622a93c9281:/workspace# python /workspace/nvidia-examples/cnn/resnet.py --num_iter 100 ... PY 3.8.10 (default, Jun 2 2021, 10:49:15) [GCC 9.4.0] TF 1.15.5 ...$ docker run --gpus '"device=0:0"' -rm -it --network=host --shm-size=1g --ipc=host -v /root/.ssh/:/root/.ssh ================ == TensorFlow == ================ NVIDIA Release 21.08-tf1 (build 26012104) TensorFlow Version 1.15.5 Container image Copyright (c) 2021, NVIDIA CORPORATION. All right reserved. ... # Python process execution root@d622a93c9281:/workspace# python /workspace/nvidia-examples/cnn/resnet.py --num_iter 100 ... PY 3.8.10 (default, Jun 2 2021, 10:49:15) [GCC 9.4.0] TF 1.15.5 ...Code Block. Work Result
- Work execution example
- Check the GPU usage rate. (Creating a JOB process)
- You can see that when the Job is driven, the process is assigned to the MIG device and the usage rate increases.You can check the GPU usage rate as follows.Color mode
$ nvidia-smi mig -i [GPU ID] -gi [GPU Instance ID] -lcip$ nvidia-smi mig -i [GPU ID] -gi [GPU Instance ID] -lcipCode Block. nvidia-smi command - Check GPU usage Color mode+-----------------------------------------------------------------------------+ | MIG devices: | +-----------------------------------------------------------------------------+ | GPU GI CI MIG | Memory-Usage | Vol| Shared | | ID ID Dev | BAR1-Usage | SM Unc| CE ENC DEC OFA JPG| | | | ECC| | |=============================================================================| | 0 0 0 0 | 66562MiB / 81251MiB | 98 0 | 7 0 5 1 1 | | | 5MiB / 13107... | | | +-----------------------------------------------------------------------------+ +-----------------------------------------------------------------------------+ | Processes: | | GPU GI CI PID Type Process name GPU Memory | | ID ID Usage | |=============================================================================| | 0 0 0 17483 C python 66559MiB | +-----------------------------------------------------------------------------++-----------------------------------------------------------------------------+ | MIG devices: | +-----------------------------------------------------------------------------+ | GPU GI CI MIG | Memory-Usage | Vol| Shared | | ID ID Dev | BAR1-Usage | SM Unc| CE ENC DEC OFA JPG| | | | ECC| | |=============================================================================| | 0 0 0 0 | 66562MiB / 81251MiB | 98 0 | 7 0 5 1 1 | | | 5MiB / 13107... | | | +-----------------------------------------------------------------------------+ +-----------------------------------------------------------------------------+ | Processes: | | GPU GI CI PID Type Process name GPU Memory | | ID ID Usage | |=============================================================================| | 0 0 0 17483 C python 66559MiB | +-----------------------------------------------------------------------------+Code block. Example of checking GPU usage
- You can see that when the Job is driven, the process is assigned to the MIG device and the usage rate increases.
MIG Instance deletion and release
To delete a MIG instance and release the MIG, follow these procedures.
MIG Removal Order
Compute Instance deletion → GPU Instance deletion → MIG feature disablement (deactivation)
Compute Instance deletion
- Delete the Compute Instance.Color mode
$ nvidia-smi mig -i [GPU ID] -gi [GPU Instance ID] –dci
$ nvidia-smi mig -i [GPU ID] -gi [GPU Instance ID] -ci [Compute Instance] –dci
$ nvidia-smi mig -i [GPU ID] -gi [GPU Instance ID] –dci $ nvidia-smi mig -i [GPU ID] -gi [GPU Instance ID] -ci [Compute Instance] –dciCode Block. nvidia-smi command - Compute Instance deletion Color mode$ nvidia-smi mig -i 0 -gi 0 –lci +-----------------------------------------------------------------+ | Compute instance profiles: | | GPU GPU Name Profile Instances Placement | | GPU Instance ID ID Start:Size | | ID | |=================================================================| | 0 0 MIG 7g.80gb 4 0 0:7 | +-----------------------------------------------------------------+$ nvidia-smi mig -i 0 -gi 0 –lci +-----------------------------------------------------------------+ | Compute instance profiles: | | GPU GPU Name Profile Instances Placement | | GPU Instance ID ID Start:Size | | ID | |=================================================================| | 0 0 MIG 7g.80gb 4 0 0:7 | +-----------------------------------------------------------------+Code Block. MIG Compute Instance Check Example Color mode$ nvidia-smi mig -i 0 -gi 0 –dci Successfully destroyed compute instance ID 0 from GPU instance ID 0$ nvidia-smi mig -i 0 -gi 0 –dci Successfully destroyed compute instance ID 0 from GPU instance ID 0Code Block. Compute Instance deletion example Color mode$ nvidia-smi mig -i 0 -gi 0 –lci No compute instances found: Not found$ nvidia-smi mig -i 0 -gi 0 –lci No compute instances found: Not foundCode Block. Compute Instance deletion confirmation
GPU Instance deletion
- Delete the GPU Instance.Color mode
$ nvidia-smi mig -i [GPU ID] –dgi
$ nvidia-smi mig -i [GPU ID] -gi [GPU Instance ID] –dgi
$ nvidia-smi mig -i [GPU ID] –dgi $ nvidia-smi mig -i [GPU ID] -gi [GPU Instance ID] –dgiCode block. nvidia-smi command - GPU Instance deletion Color mode$ nvidia-smi mig -i 0 -lgi +--------------------------------------------------------+ | GPU instances: | | GPU Name Profile Instance Placement | | ID ID Start:Size | |========================================================| | 0 MIG 7g.80gb 0 0 0:8 | +--------------------------------------------------------+$ nvidia-smi mig -i 0 -lgi +--------------------------------------------------------+ | GPU instances: | | GPU Name Profile Instance Placement | | ID ID Start:Size | |========================================================| | 0 MIG 7g.80gb 0 0 0:8 | +--------------------------------------------------------+Code block. nvidia-smi command - GPU Instance check example Color mode$ nvidia-smi mig -i 0 -dgi Successfully destroyed GPU instance ID 0 from GPU 0$ nvidia-smi mig -i 0 -dgi Successfully destroyed GPU instance ID 0 from GPU 0Code block. nvidia-smi command - GPU Instance deletion example Color mode$ nvidia-smi mig -i 0 -lgi No GPU instances found: Not found$ nvidia-smi mig -i 0 -lgi No GPU instances found: Not foundCode block. nvidia-smi command - GPU Instance deletion example
MIG Function Disablement (Deactivation)
- Disable MIG and then reboot.Color mode
$ nvidia-smi -mig 0
Disabled MIG Mode for GPU 00000000:05:00.0

All done.
$ nvidia-smi -mig 0 Disabled MIG Mode for GPU 00000000:05:00.0 All done.Code Block. nvidia-smi command - MIG disable Color mode$ nvidia-smi Mon Sep 30 05:18:28 2021 +-----------------------------------------------------------------------------+ | NVIDIA-SMI 470.57.02 Driver Version: 470.57.02 CUDA Version: 11.4 | |-------------------------------+----------------------+----------------------| | GPU Name Persistence-M| Bus-Id Disp.A | Volatile Uncorr. ECC | | Fan Temp Perf Pwr:Usage/Cap| Memory-Usage | GPU-Util Compute M. | | | | MIG M. | |===============================+======================+======================| | 0 NVDIA A100-SXM... Off | 00000000:05:00.0 Off | 0 | | N/A 33C P0 60W / 400W | 0MiB / 81251MiB | 0% Default | | | | Disabled | +-------------------------------+----------------------+----------------------+ +-----------------------------------------------------------------------------+ | MIG devices: | +-----------------------------------------------------------------------------+ | GPU GI CI MIG | Memory-Usage | Vol| Shared | | ID ID Dev | BAR1-Usage | SM Unc| CE ENC DEC OFA JPG| | | | ECC| | |=============================================================================| | No MIG devices found | +-----------------------------------------------------------------------------+ +-----------------------------------------------------------------------------+ | Processes: | | GPU GI CI PID Type Process name GPU Memory | | ID ID Usage | |=============================================================================| | No running processes found | +-----------------------------------------------------------------------------+$ nvidia-smi Mon Sep 30 05:18:28 2021 +-----------------------------------------------------------------------------+ | NVIDIA-SMI 470.57.02 Driver Version: 470.57.02 CUDA Version: 11.4 | |-------------------------------+----------------------+----------------------| | GPU Name Persistence-M| Bus-Id Disp.A | Volatile Uncorr. ECC | | Fan Temp Perf Pwr:Usage/Cap| Memory-Usage | GPU-Util Compute M. | | | | MIG M. | |===============================+======================+======================| | 0 NVDIA A100-SXM... Off | 00000000:05:00.0 Off | 0 | | N/A 33C P0 60W / 400W | 0MiB / 81251MiB | 0% Default | | | | Disabled | +-------------------------------+----------------------+----------------------+ +-----------------------------------------------------------------------------+ | MIG devices: | +-----------------------------------------------------------------------------+ | GPU GI CI MIG | Memory-Usage | Vol| Shared | | ID ID Dev | BAR1-Usage | SM Unc| CE ENC DEC OFA JPG| | | | ECC| | |=============================================================================| | No MIG devices found | +-----------------------------------------------------------------------------+ +-----------------------------------------------------------------------------+ | Processes: | | GPU GI CI PID Type Process name GPU Memory | | ID ID Usage | |=============================================================================| | No running processes found | +-----------------------------------------------------------------------------+Code Block. nvidia-smi command - Check GPU status
3.2.3 - Using NVSwitch on GPU Server
After creating a GPU Server, you can enable the NVSwitch feature in the GPU Server’s VM (Guest OS) and quickly use P2P (GPU to GPU) communication between GPUs.
Exploring NVIDIA NVSwitch for Multi GPU
NVIDIA A100 GPU server is a multi-GPU based on the NVIDIA Ampere architecture, with 8 Ampere 80 GB GPUs installed on the baseboard. The GPUs installed on the baseboard are connected to 6 NVSwitches via NVLink ports. Communication between GPUs on the baseboard is done using the full 600 GBps bandwidth. For this reason, the 8 GPUs installed on the A100 GPU server can be connected and operated like one, thereby maximizing GPU-to-GPU usage.
- NVLink(25 GBps) 12 Lane 8 GPU configuration

- NVSwitch(600 GBps) 6 units 8 GPU configuration diagram
Create GPU NVSwitch
To use the GPU NVSwitch feature, create a GPU Server service on the Samsung Cloud Platform, create a VM Instance (GuestOS) with 8 A100 GPUs assigned, and activate the Fabricmanager.
주의
- NVSwitch can only be activated and used for products with 8 A100 GPUs assigned to a single GPU server (g1v128a8 (vCPU 128 | Memory 1920G | A100(80GB)*8)).
- Currently, GPU Server created with Windows OS does not support NVSwitch (Fabricmanager).
NVSwitch Installation and Operation Check (Fabric Manager Activation)
To operate NVSwitch, install Fabricmanager on the GPU Instance and follow the next procedure.
Install NVIDIA GPU Driver (470.52.02 Version) on the GPU server.
Color mode$ add-apt-repository ppa:graphics-drivers/ppa $ apt-get update $ apt-get install nvidia-driver-470-server$ add-apt-repository ppa:graphics-drivers/ppa $ apt-get update $ apt-get install nvidia-driver-470-serverCode Block. NVIDIA GPU Driver Installation Install and run NVIDIA Fabric Manager (470 Version) on the GPU server (For NVSwitch).
Color mode$ apt-get install cuda-drivers-fabricmanager-470 $ systemctl enable nvidia-fabricmanager $ systemctl start nvidia-fabricmanager$ apt-get install cuda-drivers-fabricmanager-470 $ systemctl enable nvidia-fabricmanager $ systemctl start nvidia-fabricmanagerCode Block. NVIDIA Fabric Manager Installation and Operation Check the status of NVIDIA Fabric Manager running on the GPU server.
- Normal operation indicates active (running)Color mode
$ systemctl status nvidia-fabricmanager$ systemctl status nvidia-fabricmanagerCode Block. Check NVIDIA Fabric Manager Operation Status
- Normal operation indicates active (running)
- Check the NVSwitch operation status on the GPU server.
- Normal operation indicates NV12Color mode
$ nvidia-smi topo --matrix$ nvidia-smi topo --matrixCode block. NVSwitch operation status check
- Normal operation indicates NV12
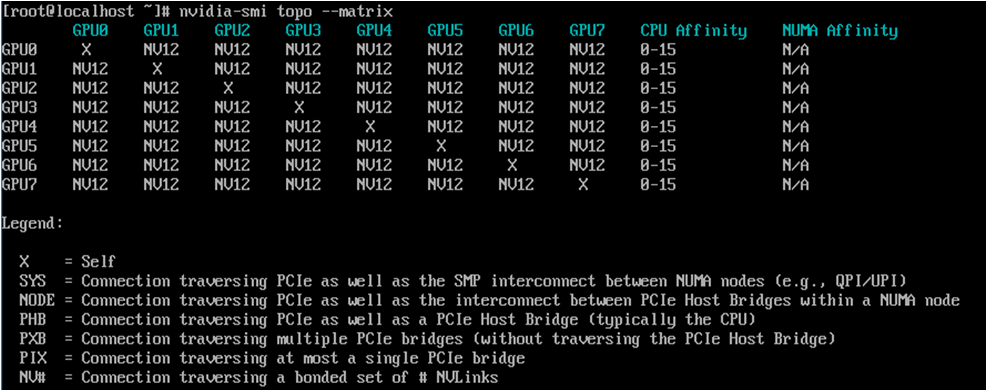
3.2.4 - Keypair Management
The user can enter the required information for the Keypair within the GPU Server service through the Samsung Cloud Platform Console, select detailed options, and create the service.
Keypair Create
You can create and use the Keypair service while using the GPU Server service on the Samsung Cloud Platform Console.
To create a keypair, follow these steps.
- All Services > Compute > GPU Server Click the menu. Navigate to the Service Home page of GPU Server.
- Click the Keypair menu on the Service Home page. It will go to the Keypair List page.
- Click the Keypair List page’s Create Keypair button. It navigates to the Create Keypair page.
- Service Information Input Enter the required information in the area.
Category Required or notDetailed description Keypair name Required Name of the Keypair to create - Enter within 255 characters using English letters, numbers, spaces, and special characters (
-,_)
Keypair type Required ssh Table. Keypair Service Information Input Items - Enter within 255 characters using English letters, numbers, spaces, and special characters (
- Additional Information Input Enter or select the required information in the area.
Category Required or notDetailed description Tag Select Add Tag - Up to 50 can be added per resource
- After clicking the Add Tag button, enter or select Key, Value values
Table. Keypair additional information input itemsCaution- After creation is complete, you can download the Key only once for the first time. Since reissuance is not possible, make sure it has been downloaded.
- Save the downloaded Private Key in a safe place.
- Service Information Input Enter the required information in the area.
- Check the input information and click the Complete button.
- When creation is complete, check the created resource on the Keypair List page.
Keypair Check detailed information
Keypair service can view and edit the full resource list and detailed information. Keypair Details page consists of Details, Tags, Activity History tabs.
To view detailed information about the Keypair, follow the steps below.
- All Services > Compute > GPU Server Click the menu. Navigate to the GPU Server’s Service Home page.
- Service Home page, click the Keypair menu. Navigate to the Keypair list page.
- Keypair List Click the resource to view detailed information on the page. Go to the Keypair Detail page.
- Keypair Details page displays status information and additional feature information, and consists of Details, Tags, Activity History tabs.
Detailed Information
On the Keypair List page, you can view detailed information of the selected resource and, if necessary, edit the information.
| Category | Detailed description |
|---|---|
| Service | Service Name |
| Resource Type | Resource Type |
| SRN | Unique resource ID in Samsung Cloud Platform
|
| Resource Name | Keypair Name |
| Resource ID | Keypair’s unique resource ID |
| Creator | User who created the Keypair |
| Creation time | Time when the keypair was created |
| Editor | User who modified the Keypair information |
| Modification Date/Time | Timestamp of Keypair information modification |
| Keypair name | Keypair name |
| Fingerprint | Unique value for identifying a Key |
| User ID | User ID of the user who created the Keypair |
| Public Key | Public Key Information |
Table. Keypair detailed information tab items
Tag
Keypair list page allows you to view the tag information of selected resources, and you can add, modify, or delete them.
| Category | Detailed description |
|---|---|
| Tag List | Tag List
|
Table. Keypair Tag Tab Items
Work History
On the Keypair list page, you can view the operation history of the selected resource.
| Category | Detailed description |
|---|---|
| Work History List | Resource Change History
|
Table. Keypair operation history tab detailed information items
Keypair Resource Management
Describes the control and management functions of the keypair.
Get public key
To retrieve the public key, follow the steps below.
Click the All Services > Compute > GPU Server menu. Go to the GPU Server’s Service Home page.
Service Home page, click the Keypair menu. Navigate to the Keypair list page.
In the Keypair list page, click the More button at the top, then click the Import Public Key button. You will be taken to the Import Public Key page.
- Required Information Input Enter or select the required information in the area.
Category RequiredDetailed description Keypair name required Name of the Keypair to create Keypair type required ssh Public Key Required Enter Public Key - Load File: Attach File button to select and attach the public key file
- Only files with the following extension (.pem) can be attached
- Enter Public Key: Paste the copied public key value
- Public key value can be copied from the Keypair Details page
Table. Required input items for fetching public key - Load File: Attach File button to select and attach the public key file
- Required Information Input Enter or select the required information in the area.
Check the entered information and click the Complete button.
- Once creation is complete, check the created resource on the Keypair List page.
Delete Keypair
You can delete unused Keypairs. However, once a Keypair is deleted it cannot be recovered, so please review the impact thoroughly in advance before proceeding with deletion.
Caution
Please be careful as data cannot be recovered after deleting the service.
To delete a keypair, follow the steps below.
- All Services > Compute > GPU Server Click the menu. Navigate to the GPU Server’s Service Home page.
- Click the Keypair menu on the Service Home page. It moves to the Keypair List page.
- On the Keypair list page, select the resource to delete and click the Delete button.
- On the Keypair list page, select multiple Keypair check boxes, and click the Delete button at the top of the resource list.
- After deletion is complete, check on the Keypair List page whether the resource has been deleted.
3.2.5 - ServiceWatch Agent Install
Users can install the ServiceWatch Agent on the GPU Server to collect custom metrics and logs.
Reference
Custom metric/log collection via the ServiceWatch Agent is currently only available on Samsung Cloud Platform For Enterprise. It will be offered in other offerings in the future.
Caution
Metric collection via ServiceWatch Agent is classified as custom metrics and, unlike the default metrics collected from each service, incurs charges, so it is recommended to remove or disable unnecessary metric collection settings.
ServiceWatch Agent
The agents that need to be installed on the GPU Server for collecting ServiceWatch’s custom metrics and logs can be divided into two main types. It is Prometheus Exporter and Open Telemetry Collector.
| Category | Detailed description | |
|---|---|---|
| Prometheus Exporter | Provides metrics of a specific application or service in a format that Prometheus can scrape
| |
| Open Telemetry Collector | Collects telemetry data such as metrics and logs from distributed systems, processes (filtering, sampling, etc.) them, and acts as a centralized collector that exports to various backends (e.g., Prometheus, Jaeger, Elasticsearch, etc.)
|
Table. Description of Prometheus Exporter and Open Telemetry Collector
Caution
If you have configured Kubernetes Engine on a GPU Server, please check GPU metrics through the metrics provided by Kubernetes Engine.
- If you install the DCGM Exporter on a GPU server configured with Kubernetes Engine, it may not work properly.
Install Prometheus Exporter for GPU metrics (for Ubuntu)
Install the Prometheus Exporter to collect metrics of the GPU Server according to the steps below.
NVDIA Driver Installation Check
- Check the installed NVDIA Driver.Color mode
nvidia-smi --query-gpu driver_version --format csvnvidia-smi --query-gpu driver_version --format csvCode block. NVDIA Driver version check command Color modedriver_version 535.183.06 ... 535.183.06driver_version 535.183.06 ... 535.183.06Code block. NVDIA Driver version check example
NVSwitch Configuration and Query (NSCQ) Library Installation
Reference
NVSwitch Configuration and Query (NSCQ) Library is required for Hopper or earlier Generation GPUs.
Notice
The installation commands below are possible in an environment where the internet is available.
If you are in an environment without internet, you need to download libnvdia-nscq from https://developer.download.nvidia.com/compute/cuda/repos/ and upload it.
Install cuda-keyring.
Color modewget https://developer.download.nvidia.com/compute/cuda/repos/<distro>/<arch>/cuda-keyring_1.1-1_all.debwget https://developer.download.nvidia.com/compute/cuda/repos/<distro>/<arch>/cuda-keyring_1.1-1_all.debCode block. NSCQ library download command Color modesudo dpkg -i cuda-keyring_1.1-1_all.deb apt updatesudo dpkg -i cuda-keyring_1.1-1_all.deb apt updateCode block. NSCQ library installation command Color modenvidia-smi --query-gpu driver_version --format csvnvidia-smi --query-gpu driver_version --format csvCode block. NVDIA Driver version check command Color modedriver_version 535.183.06 ... 535.183.06driver_version 535.183.06 ... 535.183.06Code block. NVDIA Driver version check example Install libnvidia-nscq.
Color modeapt-cache policy libnvidia-nscq-535apt-cache policy libnvidia-nscq-535Code block. NSCQ library apt-cache command Color modelibnvidia-nscq-535: Installed: (none) Candidate: 535.247.01-1 Version table: 535.247.01-1 600 600 https://developer.download.nvidia.com/compute/cuda/repos/ubuntu2204/x86_64 Packages ... 600 https://developer.download.nvidia.com/compute/cuda/repos/ubuntu2204/x86_64 Packages 535.216.01-1 600 600 https://developer.download.nvidia.com/compute/cuda/repos/ubuntu2204/x86_64 Packages 535.183.06-1 600 # Install version matching the Driver 600 https://developer.download.nvidia.com/compute/cuda/repos/ubuntu2204/x86_64 Packages 535.183.01-1 600 ... 600 https://developer.download.nvidia.com/compute/cuda/repos/ubuntu2204/x86_64 Packages 535.54.03-1 600 600 https://developer.download.nvidia.com/compute/cuda/repos/ubuntu2204/x86_64 Packageslibnvidia-nscq-535: Installed: (none) Candidate: 535.247.01-1 Version table: 535.247.01-1 600 600 https://developer.download.nvidia.com/compute/cuda/repos/ubuntu2204/x86_64 Packages ... 600 https://developer.download.nvidia.com/compute/cuda/repos/ubuntu2204/x86_64 Packages 535.216.01-1 600 600 https://developer.download.nvidia.com/compute/cuda/repos/ubuntu2204/x86_64 Packages 535.183.06-1 600 # Install version matching the Driver 600 https://developer.download.nvidia.com/compute/cuda/repos/ubuntu2204/x86_64 Packages 535.183.01-1 600 ... 600 https://developer.download.nvidia.com/compute/cuda/repos/ubuntu2204/x86_64 Packages 535.54.03-1 600 600 https://developer.download.nvidia.com/compute/cuda/repos/ubuntu2204/x86_64 PackagesCode block. NSCQ library apt-cache command result Color modeapt install libnvidia-nscq-535=535.183.06-1apt install libnvidia-nscq-535=535.183.06-1Code block. NSCQ library installation command
Notice
It must be installed with the same version as the NVDIA Driver version.
- Example) driver version: 535.183.06, libnvdia-nscq version: 535.183.06-1
NVSwitch Device Monitoring API(NVSDM) Library Installation
Note
After Blackwell GPU Architecture, installation of the NVSDM Library is required. NVIDIA Driver versions 560 and below do not provide the NVSDM Library.
- NVSDM library install.Color mode
apt-cache policy libnvsdmapt-cache policy libnvsdmCode block. NVSDM library apt-cache command Color modelibnvsdm: Installed: (none) Candidate: 580.105.08-1 Version table: 580.105.08-1 600 600 https://developer.download.nvidia.com/compute/cuda/repos/ubuntu2204/x86_64 Packages 580.95.05-1 600 600 https://developer.download.nvidia.com/compute/cuda/repos/ubuntu2204/x86_64 Packages 580.82.07-1 600 600 https://developer.download.nvidia.com/compute/cuda/repos/ubuntu2204/x86_64 Packages 580.65.06-1 600 600 https://developer.download.nvidia.com/compute/cuda/repos/ubuntu2204/x86_64 Packageslibnvsdm: Installed: (none) Candidate: 580.105.08-1 Version table: 580.105.08-1 600 600 https://developer.download.nvidia.com/compute/cuda/repos/ubuntu2204/x86_64 Packages 580.95.05-1 600 600 https://developer.download.nvidia.com/compute/cuda/repos/ubuntu2204/x86_64 Packages 580.82.07-1 600 600 https://developer.download.nvidia.com/compute/cuda/repos/ubuntu2204/x86_64 Packages 580.65.06-1 600 600 https://developer.download.nvidia.com/compute/cuda/repos/ubuntu2204/x86_64 PackagesCode block. NVSDM library apt-cache command result Color modeapt install libnvsdm=580.105.08-1apt install libnvsdm=580.105.08-1Code block. NVSDM library installation
NVIDIA DCGM Installation (for Ubuntu)
Install the DCGM Exporter according to the following steps.
- DCGM(datacenter-gpu-manager) Installation
- datacenter-gpu-manager-exporter Installation
- DCGM Service Activation and Start
DCGM(datacenter-gpu-manager) Installation
It refers to a specific version of NVIDIA’s Data Center GPU Manager (DCGM) tool, which is a package for managing and monitoring NVIDIA data center GPUs. Specifically, cuda12 indicates that this management tool is installed for CUDA version 12, and datacenter‑gpu‑manager‑4 denotes the 4.x version of DCGM. This tool provides various features including GPU status monitoring, diagnostics, alert system, and power/clock management.
- Check the CUDA version.Color mode
nvidia-smi | grep CUDAnvidia-smi | grep CUDACode block. Check CUDA version Color mode| NVIDIA-SMI 535.183.06 Driver Version: 535.183.06 CUDA Version: 12.2 || NVIDIA-SMI 535.183.06 Driver Version: 535.183.06 CUDA Version: 12.2 |Code block. Example of CUDA version check result Color modeCUDA_VERSION=12CUDA_VERSION=12Code block. CUDA version setting command - Install datacenter-gpu-manager-cuda.Color mode
apt install datacenter-gpu-manager-4-cuda${CUDA_VERSION}apt install datacenter-gpu-manager-4-cuda${CUDA_VERSION}Code block. datacenter-gpu-manager-cuda installation command
datacenter-gpu-manager-exporter installation
Based on NVIDIA Data Center GPU Manager (DCGM), it is a tool that collects various GPU metrics such as GPU usage, memory usage, temperature, and power consumption, and exposes them so they can be used in monitoring systems like Prometheus.
- Install datacenter-gpu-manager-exporter.Color mode
apt install datacenter-gpu-manager-exporterapt install datacenter-gpu-manager-exporterCode block. datacenter-gpu-manager-exporter installation command - Check the DCGM Exporter configuration file.Color mode
cat /usr/lib/systemd/system/nvidia-dcgm-exporter.service | grep ExecStartcat /usr/lib/systemd/system/nvidia-dcgm-exporter.service | grep ExecStartCode block. datacenter-gpu-manager-exporter configuration file verification command Color modeExecStart=/usr/bin/dcgm-exporter -f /etc/dcgm-exporter/default-counters.csvExecStart=/usr/bin/dcgm-exporter -f /etc/dcgm-exporter/default-counters.csvCode block. datacenter-gpu-manager-exporter configuration file check result example - When installing DCGM Exporter, check the provided settings and remove
#from the required metrics, and add#to the unnecessary metrics.Color modevi /etc/dcgm-exporter/default-counters.csv ## Example ## ... DCGM_FI_PROF_PIPE_TENSOR_ACTIVE, gauge, Ratio of cycles the tensor (HMMA) pipe is active. DCGM_FI_PROF_DRAM_ACTIVE, gauge, Ratio of cycles the device memory interface is active sending or receiving data. # DCGM_FI_PROF_PIPE_FP64_ACTIVE, gauge, Ratio of cycles the fp64 pipes are active. # DCGM_FI_PROF_PIPE_FP32_ACTIVE, gauge, Ratio of cycles the fp32 pipes are active. ...vi /etc/dcgm-exporter/default-counters.csv ## Example ## ... DCGM_FI_PROF_PIPE_TENSOR_ACTIVE, gauge, Ratio of cycles the tensor (HMMA) pipe is active. DCGM_FI_PROF_DRAM_ACTIVE, gauge, Ratio of cycles the device memory interface is active sending or receiving data. # DCGM_FI_PROF_PIPE_FP64_ACTIVE, gauge, Ratio of cycles the fp64 pipes are active. # DCGM_FI_PROF_PIPE_FP32_ACTIVE, gauge, Ratio of cycles the fp32 pipes are active. ...Code block. datacenter-gpu-manager-exporter metric setting example
Reference
For the metrics that can be collected with GPU DCGM Exporter and how to configure them, see DCGM Exporter metrics.
Caution
Since metric collection via ServiceWatch Agent is classified as custom metrics and incurs charges unlike the default collected metrics, unnecessary metric collection must be removed or disabled to avoid excessive charges.
DCGM Service activation and start
Activate and start the nvdia-dcgm service.
Color modesystemctl enable --now nvidia-dcgmsystemctl enable --now nvidia-dcgmCode block. nvdia-dcgm service activation and start command Activate and start the nvdia-dcgm-exporter service.
Color modesystemctl enable --now nvidia-dcgm-exportersystemctl enable --now nvidia-dcgm-exporterCode block. nvdia-dcgm-exporter service activation and start command
Notice
If you have completed the DCGM Exporter setup, you need to install the Open Telemetry Collector provided by ServiceWatch to complete the ServiceWatch Agent configuration.
For more details, see ServiceWatch > ServiceWatch Agent Using.
For more details, see ServiceWatch > ServiceWatch Agent Using.
Installation of Prometheus Exporter for GPU metrics (for RHEL)
Install the ServiceWatch Agent according to the steps below to collect metrics of the GPU Server.
NVDIA Driver Installation Check (for RHEL)
- Check the installed NVDIA Driver.Color mode
nvidia-smi --query-gpu driver_version --format csvnvidia-smi --query-gpu driver_version --format csvCode block. NVDIA Driver version check command Color modedriver_version 535.183.06 ... 535.183.06driver_version 535.183.06 ... 535.183.06Code block. NVDIA Driver version check example
NVSwitch Configuration and Query (NSCQ) Library installation (for RHEL)
Reference
NVSwitch Configuration and Query (NSCQ) Library is required for Hopper or earlier Generation GPUs.
- For RHEL, check if libnvdia-nscq is installed and then install it.
Notice
The installation commands below can be used in an environment with internet access.
If you are in an environment without internet, you need to download libnvdia-nscq from https://developer.download.nvidia.com/compute/cuda/repos/ and upload it.
Check the libnvdia-nscq package.
Color moderpm -qa | grep libnvidia-nscq libnvidia-nscq-535-535.183.06-1.x86_64rpm -qa | grep libnvidia-nscq libnvidia-nscq-535-535.183.06-1.x86_64Code block. NSCQ library package check Add CUDA Repository to DNF.
Color modednf config-manager --add-repo https://developer.download.nvidia.com/compute/cuda/repos/rhel8/x86_64/cuda-rhel8.repodnf config-manager --add-repo https://developer.download.nvidia.com/compute/cuda/repos/rhel8/x86_64/cuda-rhel8.repoCode block. Add DNF Repository NVDIA Driver status initialization
Color modednf module reset nvidia-driverdnf module reset nvidia-driverCode block. NVIDIA Driver DNF module state initialization Color modeUpdating Subscription Management repositories. Last metadata expiration check: 0:03:15 ago on Wed 19 Nov 2025 01:23:48 AM EST. Dependencies resolved. ============================================= Package Architecture Version Repository Size ============================================= Disabling module profiles: nvidia-driver/default nvidia-driver/fm Resetting modules: nvidia-driver Transaction Summary ============================================= Is this ok [y/N]: yUpdating Subscription Management repositories. Last metadata expiration check: 0:03:15 ago on Wed 19 Nov 2025 01:23:48 AM EST. Dependencies resolved. ============================================= Package Architecture Version Repository Size ============================================= Disabling module profiles: nvidia-driver/default nvidia-driver/fm Resetting modules: nvidia-driver Transaction Summary ============================================= Is this ok [y/N]: yCode block. Example of the result of state initialization of the NVIDIA Driver DNF module Activate the NVDIA Driver module.
Color modednf module enable nvidia-driver:535-opendnf module enable nvidia-driver:535-openCode block. NVDIA Driver module activation Color modeUpdating Subscription Management repositories. Last metadata expiration check: 0:04:22 ago on Wed 19 Nov 2025 01:23:48 AM EST. Dependencies resolved. ============================================= Package Architecture Version Repository Size ============================================= Enabling module streams: nvidia-driver 535-open Transaction Summary ============================================= Is this ok [y/N]: yUpdating Subscription Management repositories. Last metadata expiration check: 0:04:22 ago on Wed 19 Nov 2025 01:23:48 AM EST. Dependencies resolved. ============================================= Package Architecture Version Repository Size ============================================= Enabling module streams: nvidia-driver 535-open Transaction Summary ============================================= Is this ok [y/N]: yCode block. NVDIA Driver module activation result example Check the libnvdia-nscq module list.
Color modednf list libnvidia-nscq-535 --showduplicatesdnf list libnvidia-nscq-535 --showduplicatesCode block. libnvdia-nscq module list check Install libnvdia-nscq.
Color modednf install libnvidia-nscq-535-535.183.06-1dnf install libnvidia-nscq-535-535.183.06-1Code block. libnvdia-nscq installation command
NVSwitch Device Monitoring API(NVSDM) Library Installation (for RHEL)
Reference
After Blackwell, GPU Architecture requires NVSDM Library installation. NVDIA Driver versions 560 and below do not provide the NVSDM Library.
Check the NVSDM library module list.
Color modednf list libnvsdm --showduplicatesdnf list libnvsdm --showduplicatesCode block. Check NVSDM library module list Color modelibnvsdm: Installed: (none) Candidate: 580.105.08-1 Version table: 580.105.08-1 600 600 https://developer.download.nvidia.com/compute/cuda/repos/ubuntu2204/x86_64 Packages 580.95.05-1 600 600 https://developer.download.nvidia.com/compute/cuda/repos/ubuntu2204/x86_64 Packages 580.82.07-1 600 600 https://developer.download.nvidia.com/compute/cuda/repos/ubuntu2204/x86_64 Packages 580.65.06-1 600 600 https://developer.download.nvidia.com/compute/cuda/repos/ubuntu2204/x86_64 Packageslibnvsdm: Installed: (none) Candidate: 580.105.08-1 Version table: 580.105.08-1 600 600 https://developer.download.nvidia.com/compute/cuda/repos/ubuntu2204/x86_64 Packages 580.95.05-1 600 600 https://developer.download.nvidia.com/compute/cuda/repos/ubuntu2204/x86_64 Packages 580.82.07-1 600 600 https://developer.download.nvidia.com/compute/cuda/repos/ubuntu2204/x86_64 Packages 580.65.06-1 600 600 https://developer.download.nvidia.com/compute/cuda/repos/ubuntu2204/x86_64 PackagesCode block. NVSDM library module list verification result example Install libnvsdm.
Color modednf install libnvsdm-580.105.08-1dnf install libnvsdm-580.105.08-1Code block. NVSDM library installation Color modeUpdating Subscription Management repositories. Last metadata expiration check: 0:08:18 ago on Wed 19 Nov 2025 01:05:28 AM EST. Dependencies resolved. ========================================================================= Package Architecture Version Repository Size ========================================================================= Installing: libnvsdm x86_64 580.105.08-1 cuda-rhel8-x86_64 675 k Installing dependencies: infiniband-diags x86_64 48.0-1.el8 rhel-8-for-x86_64-baseos-rpms 323 k libibumad x86_64 48.0-1.el8 rhel-8-for-x86_64-baseos-rpms 34 k Transaction Summary ========================================================================= Install 3 Packages Total download size: 1.0 M Installed size: 3.2 M Is this ok [y/N]: yUpdating Subscription Management repositories. Last metadata expiration check: 0:08:18 ago on Wed 19 Nov 2025 01:05:28 AM EST. Dependencies resolved. ========================================================================= Package Architecture Version Repository Size ========================================================================= Installing: libnvsdm x86_64 580.105.08-1 cuda-rhel8-x86_64 675 k Installing dependencies: infiniband-diags x86_64 48.0-1.el8 rhel-8-for-x86_64-baseos-rpms 323 k libibumad x86_64 48.0-1.el8 rhel-8-for-x86_64-baseos-rpms 34 k Transaction Summary ========================================================================= Install 3 Packages Total download size: 1.0 M Installed size: 3.2 M Is this ok [y/N]: yCode block. NVSDM library installation command result example
NVIDIA DCGM Installation (for RHEL)
Install Node Exporter according to the steps below.
- DCGM(datacenter-gpu-manager) Installation
- datacenter-gpu-manager-exporter installation
- DCGM Service Activation and Start
DCGM(datacenter-gpu-manager) Installation (for RHEL)
It refers to a specific version of NVIDIA’s Data Center GPU Manager (DCGM) tool, which is a package for managing and monitoring NVIDIA data center GPUs. Specifically, cuda12 indicates that this management tool is installed for CUDA version 12, and datacenter‑gpu‑manager‑4 denotes the 4.x version of DCGM. This tool provides various functions including GPU status monitoring, diagnostics, alert system, and power/clock management.
- Add CUDA Repository to DNF.Color mode
dnf config-manager --add-repo https://developer.download.nvidia.com/compute/cuda/repos/rhel8/x86_64/cuda-rhel8.repodnf config-manager --add-repo https://developer.download.nvidia.com/compute/cuda/repos/rhel8/x86_64/cuda-rhel8.repoCode block. Add DNF Repository - Check the CUDA version.Color mode
nvidia-smi | grep CUDAnvidia-smi | grep CUDACode block. Check CUDA version Color mode| NVIDIA-SMI 535.183.06 Driver Version: 535.183.06 CUDA Version: 12.2 || NVIDIA-SMI 535.183.06 Driver Version: 535.183.06 CUDA Version: 12.2 |Code block. Example of CUDA version check result Color modeCUDA_VERSION=12CUDA_VERSION=12Code block. CUDA version setting command - Check the list of datacenter-gpu-manager-cuda modules.Color mode
dnf list datacenter-gpu-manager-4-cuda${CUDA_VERSION} --showduplicatesdnf list datacenter-gpu-manager-4-cuda${CUDA_VERSION} --showduplicatesCode block. Check datacenter-gpu-manager-cuda module list Color modeUpdating Subscription Management repositories. Unable to read consumer identity This system is not registered with an entitlement server. You can use subscription-manager to register. Last metadata expiration check: 0:00:34 ago on Wed 19 Nov 2025 12:26:56 AM EST. Available Packages datacenter-gpu-manager-4-cuda12.x86_64 1:4.0.0-1 cuda-rhel8-x86_64 datacenter-gpu-manager-4-cuda12.x86_64 1:4.1.0-1 cuda-rhel8-x86_64 datacenter-gpu-manager-4-cuda12.x86_64 1:4.1.1-1 cuda-rhel8-x86_64 datacenter-gpu-manager-4-cuda12.x86_64 1:4.2.0-1 cuda-rhel8-x86_64 datacenter-gpu-manager-4-cuda12.x86_64 1:4.2.2-1 cuda-rhel8-x86_64 datacenter-gpu-manager-4-cuda12.x86_64 1:4.2.3-1 cuda-rhel8-x86_64 datacenter-gpu-manager-4-cuda12.x86_64 1:4.2.3-2 cuda-rhel8-x86_64 datacenter-gpu-manager-4-cuda12.x86_64 1:4.3.0-1 cuda-rhel8-x86_64 datacenter-gpu-manager-4-cuda12.x86_64 1:4.3.1-1 cuda-rhel8-x86_64 datacenter-gpu-manager-4-cuda12.x86_64 1:4.4.0-1 cuda-rhel8-x86_64 datacenter-gpu-manager-4-cuda12.x86_64 1:4.4.1-1 cuda-rhel8-x86_64 datacenter-gpu-manager-4-cuda12.x86_64 1:4.4.2-1 cuda-rhel8-x86_64Updating Subscription Management repositories. Unable to read consumer identity This system is not registered with an entitlement server. You can use subscription-manager to register. Last metadata expiration check: 0:00:34 ago on Wed 19 Nov 2025 12:26:56 AM EST. Available Packages datacenter-gpu-manager-4-cuda12.x86_64 1:4.0.0-1 cuda-rhel8-x86_64 datacenter-gpu-manager-4-cuda12.x86_64 1:4.1.0-1 cuda-rhel8-x86_64 datacenter-gpu-manager-4-cuda12.x86_64 1:4.1.1-1 cuda-rhel8-x86_64 datacenter-gpu-manager-4-cuda12.x86_64 1:4.2.0-1 cuda-rhel8-x86_64 datacenter-gpu-manager-4-cuda12.x86_64 1:4.2.2-1 cuda-rhel8-x86_64 datacenter-gpu-manager-4-cuda12.x86_64 1:4.2.3-1 cuda-rhel8-x86_64 datacenter-gpu-manager-4-cuda12.x86_64 1:4.2.3-2 cuda-rhel8-x86_64 datacenter-gpu-manager-4-cuda12.x86_64 1:4.3.0-1 cuda-rhel8-x86_64 datacenter-gpu-manager-4-cuda12.x86_64 1:4.3.1-1 cuda-rhel8-x86_64 datacenter-gpu-manager-4-cuda12.x86_64 1:4.4.0-1 cuda-rhel8-x86_64 datacenter-gpu-manager-4-cuda12.x86_64 1:4.4.1-1 cuda-rhel8-x86_64 datacenter-gpu-manager-4-cuda12.x86_64 1:4.4.2-1 cuda-rhel8-x86_64Code block. datacenter-gpu-manager-cuda module list check result example - Install datacenter-gpu-manager-cuda.Color mode
dnf install datacenter-gpu-manager-4-cuda${CUDA_VERSION}dnf install datacenter-gpu-manager-4-cuda${CUDA_VERSION}Code block. datacenter-gpu-manager-cuda installation Color modeUpdating Subscription Management repositories. Unable to read consumer identity This system is not registered with an entitlement server. You can use subscription-manager to register. Last metadata expiration check: 0:07:12 ago on Wed 19 Nov 2025 12:26:56 AM EST. Dependencies resolved. =================================================================================================== Package Architecture Version Repository Size =================================================================================================== Installing: datacenter-gpu-manager-4-cuda12 x86_64 1:4.4.2-1 cuda-rhel8-x86_64 554 M Installing dependencies: datacenter-gpu-manager-4-core x86_64 1:4.4.2-1 cuda-rhel8-x86_64 9.9 M Installing weak dependencies: datacenter-gpu-manager-4-proprietary x86_64 1:4.4.2-1 cuda-rhel8-x86_64 5.3 M datacenter-gpu-manager-4-proprietary-cuda12 x86_64 1:4.4.2-1 cuda-rhel8-x86_64 289 M Transaction Summary ==================================================================================================== Install 4 Packages ... Is this ok [y/N]: yUpdating Subscription Management repositories. Unable to read consumer identity This system is not registered with an entitlement server. You can use subscription-manager to register. Last metadata expiration check: 0:07:12 ago on Wed 19 Nov 2025 12:26:56 AM EST. Dependencies resolved. =================================================================================================== Package Architecture Version Repository Size =================================================================================================== Installing: datacenter-gpu-manager-4-cuda12 x86_64 1:4.4.2-1 cuda-rhel8-x86_64 554 M Installing dependencies: datacenter-gpu-manager-4-core x86_64 1:4.4.2-1 cuda-rhel8-x86_64 9.9 M Installing weak dependencies: datacenter-gpu-manager-4-proprietary x86_64 1:4.4.2-1 cuda-rhel8-x86_64 5.3 M datacenter-gpu-manager-4-proprietary-cuda12 x86_64 1:4.4.2-1 cuda-rhel8-x86_64 289 M Transaction Summary ==================================================================================================== Install 4 Packages ... Is this ok [y/N]: yCode block. datacenter-gpu-manager-cuda installation result example
datacenter-gpu-manager-exporter installation (for RHEL)
It is a tool that, based on NVIDIA Data Center GPU Manager (DCGM), collects various GPU metrics such as GPU usage, memory usage, temperature, and power consumption, and exposes them for use in monitoring systems like Prometheus.
Add the CUDA Repository to DNF. (If you have already performed this command, proceed to the next step.)
Color modednf config-manager --add-repo https://developer.download.nvidia.com/compute/cuda/repos/rhel8/x86_64/cuda-rhel8.repodnf config-manager --add-repo https://developer.download.nvidia.com/compute/cuda/repos/rhel8/x86_64/cuda-rhel8.repoCode block. Add DNF Repository Check the CUDA version. (If you have already performed this command, proceed to the next step.)
Color modenvidia-smi | grep CUDAnvidia-smi | grep CUDACode block. Check CUDA version Color mode| NVIDIA-SMI 535.183.06 Driver Version: 535.183.06 CUDA Version: 12.2 || NVIDIA-SMI 535.183.06 Driver Version: 535.183.06 CUDA Version: 12.2 |Code block. Example of CUDA version check result Color modeCUDA_VERSION=12CUDA_VERSION=12Code block. CUDA version setting command Check the list of datacenter-gpu-manager-exporter modules.
Color modednf list datacenter-gpu-manager-exporter --showduplicatesdnf list datacenter-gpu-manager-exporter --showduplicatesCode block. datacenter-gpu-manager-exporter module list check Color modeUpdating Subscription Management repositories. Unable to read consumer identity This system is not registered with an entitlement server. You can use subscription-manager to register. Last metadata expiration check: 0:02:11 ago on Wed 19 Nov 2025 12:26:56 AM EST. Available Packages datacenter-gpu-manager-exporter.x86_64 4.0.1-1 cuda-rhel8-x86_64 datacenter-gpu-manager-exporter.x86_64 4.1.0-1 cuda-rhel8-x86_64 datacenter-gpu-manager-exporter.x86_64 4.1.1-1 cuda-rhel8-x86_64 datacenter-gpu-manager-exporter.x86_64 4.1.3-1 cuda-rhel8-x86_64 datacenter-gpu-manager-exporter.x86_64 4.5.0-1 cuda-rhel8-x86_64 datacenter-gpu-manager-exporter.x86_64 4.5.1-1 cuda-rhel8-x86_64 datacenter-gpu-manager-exporter.x86_64 4.5.2-1 cuda-rhel8-x86_64 datacenter-gpu-manager-exporter.x86_64 4.6.0-1 cuda-rhel8-x86_64Updating Subscription Management repositories. Unable to read consumer identity This system is not registered with an entitlement server. You can use subscription-manager to register. Last metadata expiration check: 0:02:11 ago on Wed 19 Nov 2025 12:26:56 AM EST. Available Packages datacenter-gpu-manager-exporter.x86_64 4.0.1-1 cuda-rhel8-x86_64 datacenter-gpu-manager-exporter.x86_64 4.1.0-1 cuda-rhel8-x86_64 datacenter-gpu-manager-exporter.x86_64 4.1.1-1 cuda-rhel8-x86_64 datacenter-gpu-manager-exporter.x86_64 4.1.3-1 cuda-rhel8-x86_64 datacenter-gpu-manager-exporter.x86_64 4.5.0-1 cuda-rhel8-x86_64 datacenter-gpu-manager-exporter.x86_64 4.5.1-1 cuda-rhel8-x86_64 datacenter-gpu-manager-exporter.x86_64 4.5.2-1 cuda-rhel8-x86_64 datacenter-gpu-manager-exporter.x86_64 4.6.0-1 cuda-rhel8-x86_64Code block. datacenter-gpu-manager-exporter module list check result example Install datacenter-gpu-manager-cuda. dcgm-exporter 4.5.X requires glibc 2.34 or higher, but since glibc 2.34 is provided in RHEL9, we specify the version as 4.1.3-1 for installation.
Color modednf install datacenter-gpu-manager-exporter-4.1.3-1dnf install datacenter-gpu-manager-exporter-4.1.3-1Code block. datacenter-gpu-manager-cuda installation Color modeUpdating Subscription Management repositories. Unable to read consumer identity This system is not registered with an entitlement server. You can use subscription-manager to register. Last metadata expiration check: 0:07:12 ago on Wed 19 Nov 2025 12:26:56 AM EST. Dependencies resolved. ==================================================================================================== Package Architecture Version Repository Size ==================================================================================================== Installing: datacenter-gpu-manager-exporter x86_64 4.1.3-1 cuda-rhel8-x86_64 26 M ... Is this ok [y/N]: yUpdating Subscription Management repositories. Unable to read consumer identity This system is not registered with an entitlement server. You can use subscription-manager to register. Last metadata expiration check: 0:07:12 ago on Wed 19 Nov 2025 12:26:56 AM EST. Dependencies resolved. ==================================================================================================== Package Architecture Version Repository Size ==================================================================================================== Installing: datacenter-gpu-manager-exporter x86_64 4.1.3-1 cuda-rhel8-x86_64 26 M ... Is this ok [y/N]: yCode block. datacenter-gpu-manager-cuda installation result example Color modecat /usr/lib/systemd/system/nvidia-dcgm-exporter.service | grep ExecStartcat /usr/lib/systemd/system/nvidia-dcgm-exporter.service | grep ExecStartCode block. datacenter-gpu-manager-exporter configuration file Color modeExecStart=/usr/bin/dcgm-exporter -f /etc/dcgm-exporter/default-counters.csvExecStart=/usr/bin/dcgm-exporter -f /etc/dcgm-exporter/default-counters.csvCode block. datacenter-gpu-manager-exporter configuration file check result example When installing DCGM Exporter, check the provided settings and remove
#from the required metrics, and add#to the unnecessary metrics.Color modevi /etc/dcgm-exporter/default-counters.csv ## Example ## ... DCGM_FI_PROF_PIPE_TENSOR_ACTIVE, gauge, Ratio of cycles the tensor (HMMA) pipe is active. DCGM_FI_PROF_DRAM_ACTIVE, gauge, Ratio of cycles the device memory interface is active sending or receiving data. # DCGM_FI_PROF_PIPE_FP64_ACTIVE, gauge, Ratio of cycles the fp64 pipes are active. # DCGM_FI_PROF_PIPE_FP32_ACTIVE, gauge, Ratio of cycles the fp32 pipes are active. ...vi /etc/dcgm-exporter/default-counters.csv ## Example ## ... DCGM_FI_PROF_PIPE_TENSOR_ACTIVE, gauge, Ratio of cycles the tensor (HMMA) pipe is active. DCGM_FI_PROF_DRAM_ACTIVE, gauge, Ratio of cycles the device memory interface is active sending or receiving data. # DCGM_FI_PROF_PIPE_FP64_ACTIVE, gauge, Ratio of cycles the fp64 pipes are active. # DCGM_FI_PROF_PIPE_FP32_ACTIVE, gauge, Ratio of cycles the fp32 pipes are active. ...Code block. datacenter-gpu-manager-exporter metric configuration example
Reference
For the metrics that can be collected with GPU DCGM Exporter and how to configure them, see DCGM Exporter Metrics.
Caution
Since metric collection via ServiceWatch Agent is classified as custom metrics and incurs charges unlike the default collected metrics, unnecessary metric collection must be removed or disabled to avoid excessive charges.
DCGM Service Activation and Start (for RHEL)
Enable and start the nvdia-dcgm service.
Color modesystemctl enable --now nvidia-dcgmsystemctl enable --now nvidia-dcgmCode block. nvdia-dcgm service activation and start command Activate and start the nvdia-dcgm-exporter service.
Color modesystemctl enable --now nvidia-dcgm-exportersystemctl enable --now nvidia-dcgm-exporterCode block. nvdia-dcgm-exporter service activation and start command
Notice
If you have completed the DCGM Exporter setup, you need to install the Open Telemetry Collector provided by ServiceWatch to complete the ServiceWatch Agent configuration.
For more details, see ServiceWatch > ServiceWatch Agent Using.
For more details, see ServiceWatch > ServiceWatch Agent Using.
DCGM Exporter Metrics
DCGM Exporter Key Metrics
Among the metrics provided by DCGM Exporter, the main GPU metrics are as follows.
| Category | DCGM Field | Prometheus Metric Type | Summary | |
|---|---|---|---|---|
| Clocks | DCGM_FI_DEV_SM_CLOCK | gauge | SM clock frequency (in MHz) | |
| Clocks | DCGM_FI_DEV_MEM_CLOCK | gauge | Memory clock frequency (in MHz) | |
| Temperature | DCGM_FI_DEV_GPU_TEMP | gauge | GPU temperature (in C) | |
| Power | DCGM_FI_DEV_POWER_USAGE | gauge | Power draw (in W) | |
| Utilization | DCGM_FI_DEV_GPU_UTIL | gauge | GPU utilization (in %) | |
| Utilization | DCGM_FI_DEV_MEM_COPY_UTIL | gauge | Memory utilization (in %) | |
| Memory Usage | DCGM_FI_DEV_FB_FREE | gauge | Frame buffer memory free (in MiB) | |
| Memory Usage | DCGM_FI_DEV_FB_USED | gauge | Frame buffer memory used (in MiB) | |
| Nvlink | DCGM_FI_DEV_NVLINK_BANDWIDTH_TOTAL(8 GPU only) | counter | Total number of NVLink bandwidth counters for all lanes |
Table. Major GPU metrics provided by DCGM Exporter
DCGM Exporter Metric Collection Settings
Please refer to the default metrics of DCGM Exporter at DCGM Exporter > Default Metrics.
- For indicators to be set in addition to the default settings, remove
#in default-counters.csv. - For metrics that are not desired to be collected among the default metrics, add
#or delete the item.
Color mode
# Format
# If line starts with a '#' it is considered a comment
# DCGM FIELD, Prometheus metric type, help message

# Clocks
DCGM_FI_DEV_SM_CLOCK,  gauge, SM clock frequency (in MHz).
DCGM_FI_DEV_MEM_CLOCK, gauge, Memory clock frequency (in MHz).

# Temperature
DCGM_FI_DEV_MEMORY_TEMP, gauge, Memory temperature (in C).
DCGM_FI_DEV_GPU_TEMP,    gauge, GPU temperature (in C).

# Power
DCGM_FI_DEV_POWER_USAGE,              gauge, Power draw (in W).
DCGM_FI_DEV_TOTAL_ENERGY_CONSUMPTION, counter, Total energy consumption since boot (in mJ).

# PCIE
# DCGM_FI_PROF_PCIE_TX_BYTES,  counter, Total number of bytes transmitted through PCIe TX via NVML.
# DCGM_FI_PROF_PCIE_RX_BYTES,  counter, Total number of bytes received through PCIe RX via NVML.
...
# Format
# If line starts with a '#' it is considered a comment
# DCGM FIELD, Prometheus metric type, help message
# Clocks
DCGM_FI_DEV_SM_CLOCK, gauge, SM clock frequency (in MHz).
DCGM_FI_DEV_MEM_CLOCK, gauge, Memory clock frequency (in MHz).
# Temperature
DCGM_FI_DEV_MEMORY_TEMP, gauge, Memory temperature (in C).
DCGM_FI_DEV_GPU_TEMP, gauge, GPU temperature (in C).
# Power
DCGM_FI_DEV_POWER_USAGE, gauge, Power draw (in W).
DCGM_FI_DEV_TOTAL_ENERGY_CONSUMPTION, counter, Total energy consumption since boot (in mJ).
# PCIE
# DCGM_FI_PROF_PCIE_TX_BYTES, counter, Total number of bytes transmitted through PCIe TX via NVML.
# DCGM_FI_PROF_PCIE_RX_BYTES, counter, Total number of bytes received through PCIe RX via NVML.
...3.3 - API Reference
API Reference
3.4 - CLI Reference
CLI Reference
3.5 - Release Note
GPU Server
2025.10.23
FEATURE
Add new features and provide ServiceWatch service integration functionality- ServiceWatch service integration provision
- You can monitor data through the ServiceWatch service.
- You can select a RHEL image when creating a GPU Server.
- Keypair management feature has been added.
- You can create a keypair to use, or retrieve a public key and apply it.
2025.07.01
FEATURE
GPU Server feature addition, Image sharing method change and GPU Server usage guide addition- GPU Server feature addition
- IP, Public NAT IP, Private NAT IP configuration feature has been added.
- LLM Endpoint is provided for LLM usage.
- The method of sharing images between accounts has been changed.
- You can create a new shared Image and share it.
- Add GPU Server usage guide
- Using Multi-instance GPU on GPU Server and Using NVSwitch on GPU Server added the guides.
2025.04.28
FEATURE
Add OS image- GPU Server RHEL OS and GPU driver version have been added.
2025.02.27
FEATURE
Common Feature Change- GPU Server feature addition
- NAT setting feature has been added to GPU Server.
- Samsung Cloud Platform Common Feature Change
- Account, IAM and Service Home, tags, etc. have been reflected in common CX changes.
2024.10.01
NEW
GPU Server Service Official Version Release- GPU Server service has been officially launched.
- CPU, GPU, memory, etc., we have launched a virtualization computing service that allows you to allocate and use the infrastructure resources provided by the server as needed at the required time without having to purchase them individually.
4 - Bare Metal Server
4.1 - Overview
Service Overview
Bare Metal Server does not use virtualization technology and a high-performance cloud computing service that can allocate and use physically separated computing resources such as CPU and memory individually. Since it is not affected by other cloud users, you can reliably operate performance-sensitive services.
Features
Easy and convenient computing environment setup: Through the web-based console, you can easily use everything from Bare Metal Server provisioning to resource management and cost management. You can receive a server with standard specs (CPU, Memory, Disk) allocated exclusively and use it immediately.
Providing High-Performance Computing Environment: We provide servers suitable for workloads that require large capacity and high performance, such as real-time (Real-Time) systems, HPC (High Performance Computing), and servers that demand excessive I/O usage, in a physically isolated environment.
Efficient Service Provision: We ensure performance and stability through optimal server selection and in-house testing. Customers can select the optimal resources for their service environment through the various specifications of Bare Metal Servers offered by Samsung Cloud Platform.
Service Diagram
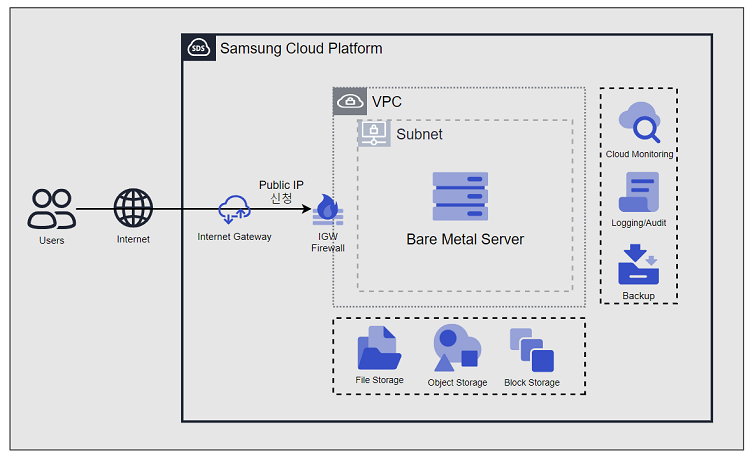
Provided Features
Bare Metal Server provides the following features.
- Auto Provisioning and Management: Through the web-based console, you can easily use everything from Bare Metal Server provisioning to resource management and cost management.
- Providing various types of server types and OS images: Provides CPU/Memory/Disk resources of standard server types, and offers various standard OS images.
- Storage Connection: Provides additional connected storage besides the OS disk. You can connect and use Block Storage, File Storage, and Object Storage.
- Network Connection: You can connect the general subnet/IP settings of the Bare Metal Server and the Public NAT IP. Provides a local subnet connection for communication between servers. This operation can be modified on the detail page.
- Monitoring: You can view monitoring information such as CPU, Memory, Disk, which are computing resources, through Cloud Monitoring. To use the Cloud Monitoring service of Bare Metal Server, you need to install the Agent. Please be sure to install the Agent for stable Bare Metal Server service usage. For more details, refer to Bare Metal Server Monitoring Metrics.
- Backup and Recovery: Bare Metal Server’s Filesystem backup and recovery can be used through the Backup service.
- Efficient Cost Management: You can easily create/terminate servers as needed, and because billing is based on actual usage time, you can use it cost-effectively in various unpredictable situations.
- Local disk partition creation You can create and use up to 10 local disk partitions.
- Terraform provision: Provides an IaC environment through Terraform.
Components
Bare Metal Server provides various OS standard images and standard server types. Users can select and use them according to the scale of the service they want to configure.
OS Image Provided Version
The OS images supported by Bare Metal Server are as follows
| OS Image Version | EoS Date |
|---|---|
| Oracle Linux 9.6 | 2032-06-30 |
| RHEL 8.10 | 2029-05-31 |
| RHEL 9.4 | 2026-04-30 |
| RHEL 9.6 | 2027-05-31 |
| Rocky Linux 8.10 | 2029-05-31 |
| Rocky Linux 9.6 | 2025-11-30 |
| Ubuntu 22.04 | 2027-06-30 |
| Ubuntu 24.04 | 2029-06-30 |
| Windows 2019 | 2029-01-09 |
| Windows 2022 | 2031-10-14 |
Table. Bare Metal Server Provided OS Image Version
Server Type
The server types supported by Bare Metal Server are as follows. For more details about the server types supported by Bare Metal Server, see Bare Metal Server Server Type.
s3v16m64_metal
| Category | Example | Detailed description |
|---|---|---|
| Server Generation | s3 | Provided server classification and generation
|
| CPU vCore | v16 | vCore count
|
| Memory | m64 | Memory Capacity
|
Table. Bare Metal Server Server Type
Preceding Service
This is a list of services that must be pre-configured before creating the service. Please refer to the guide provided for each service for details and prepare in advance.
| Service Category | Service | Detailed Description |
|---|---|---|
| Networking | VPC | A service that provides an independent virtual network in a cloud environment |
Table. Bare Metal Server Pre-service
4.1.1 - Server Type
Bare Metal Server Server Type
Bare Metal Server provides server types according to the intended use. Server types are composed of various combinations such as CPU, Memory, etc. The server used for the Bare Metal Server is determined by the server type selected when creating the Bare Metal Server. Please select the server type based on the specifications of the application you want to run on the Bare Metal Server.
The server types supported by Bare Metal Server are as follows.
s3v16m64_metal
Category
Example
Detailed description
Server Generation
s3
Provided server classification and generation- s3
- s means standard specification
- 3 means generation
- h3
- h means large-capacity server specification
- 3 means generation
CPU vCore
v16
vCore count- v16: Allocated vCore is a multiple of the physical core count
- 16 vCore corresponds to physically 8 cores
- Provided with Hyper-Threading enabled by default, which can be disabled when creating a service
Memory
m64
Memory Capacity- m64: 64GB Memory
Table. Bare Metal Server server type format
## s3/h3 server type
Bare Metal Server s3 server type is provided with standard specifications (vCPU, Memory) and is suitable for high-performance applications because it receives physically separated resources for use.
Also, the Bare Metal Server h3 server type is offered with large-capacity server specifications and is suitable for high-performance applications for large-scale data processing.
* Supports 5 types of vCPU (16, 32, 64, 96, 128vCore)
* Intel 4th generation(Sapphire Rapids) Processor
* Supports up to 64 physical cores, 128 vCPUs, and 2,048 GB of memory
* Provides two internal disks up to 1.92 TB
Server Type
Physical CPU
vCPU
Memory
CPU Type
Internal Disk
s3v16m64_metal
8 Core
16 vCore
64 GB
Intel Xeon Gold 6434 up to 4.1GHz
480 GB * 2EA
s3v16m128_metal
8 Core
16 vCore
128 GB
Intel Xeon Gold 6434 up to 4.1GHz
480 GB * 2EA
s3v16m256_metal
8 Core
16 vCore
256 GB
Intel Xeon Gold 6434 up to 4.1GHz
480 GB * 2EA
h3v32m128_metal
16 Core
32 vCore
128 GB
Intel Xeon Gold 6444Y up to 4.0GHz
960 GB * 2EA
h3v32m256_metal
16 Core
32 vCore
256 GB
Intel Xeon Gold 6444Y up to 4.0GHz
960 GB * 2EA
h3v32m512_metal
16 Core
32 vCore
512 GB
Intel Xeon Gold 6444Y up to 4.0GHz
960 GB * 2EA
h3v64m256_metal
32 Core
64 vCore
256 GB
Intel Xeon Gold 6448H up to 3.2GHz
1.92 TB * 2EA
h3v64m512_metal
32 Core
64 vCore
512 GB
Intel Xeon Gold 6448H up to 3.2GHz
1.92 TB * 2EA
h3v64m1024_metal
32 Core
64 vCore
1024 GB
Intel Xeon Gold 6448H up to 3.2GHz
1.92 TB * 2EA
h3v96m384_metal
48 Core
96 vCore
384 GB
Intel Xeon Gold 6442Y up to 3.3GHz
1.92 TB * 2EA
h3v96m768_metal
48 Core
96 vCore
768 GB
Intel Xeon Gold 6442Y up to 3.3GHz
1.92 TB * 2EA
h3v96m1536_metal
48 Core
96 vCore
1536 GB
Intel Xeon Gold 6442Y up to 3.3GHz
1.92 TB * 2EA
h3v128m512_metal
64 Core
128 vCore
512 GB
Intel Xeon Gold 6448H up to 3.2GHz
1.92 TB * 2EA
h3v128m1024_metal
64 Core
128 vCore
1024 GB
Intel Xeon Gold 6448H up to 3.2GHz
1.92 TB * 2EA
h3v128m2048_metal
64 Core
128 vCore
2048 GB
Intel Xeon Gold 6448H up to 3.2GHz
1.92 TB * 2EA
Table. Bare Metal Server server type specifications > s3/h3 server type
## s2/h2 Server Type
<div class="scp-textbox scp-textbox-type-warn">
<div class="scp-textbox-title">Notice</div>
<div class="scp-textbox-contents">
s2/h2 server type’s new application service has been terminated. Existing services you are using are not affected.
</div>
</div>
Bare Metal Server s2 server type is provided with standard specifications (vCPU, Memory) and is suitable for high-performance applications because it receives and uses physically separated resources.
Also, the Bare Metal Server h2 server type is offered with high-capacity server specifications and is suitable for high-performance applications for large-scale data processing.
* Supports a total of 5 types of vCPU (16, 24, 32, 72, 96 vCore)
* Intel 3rd generation (Ice Lake) Processor
* Supports up to 48 physical cores, 96 vCPUs, and 1,024 GB of memory
* Provide 2 internal disks up to 1.92TB
Server Type
Physical CPU
vCPU
Memory
CPU Type
Internal Disk
s2v16m64_metal
8 Core
16 vCore
64 GB
Intel Xeon Gold 6334 up to 3.6GHz
480 GB * 2EA
s2v16m128_metal
8 Core
16 vCore
128 GB
Intel Xeon Gold 6334 up to 3.6GHz
480 GB * 2EA
s2v16m256_metal
8 Core
16 vCore
256 GB
Intel Xeon Gold 6334 up to 3.6GHz
480 GB * 2EA
h2v24m96_metal
12 Core
24 vCore
96 GB
Intel Xeon Gold 5317 up to 3.4GHz
960 GB * 2EA
h2v24m192_metal
12 Core
24 vCore
192 GB
Intel Xeon Gold 5317 up to 3.4GHz
960 GB * 2EA
h2v24m384_metal
12 Core
24 vCore
384 GB
Intel Xeon Gold 5317 up to 3.4GHz
960 GB * 2EA
h2v32m128_metal
16 Core
32 vCore
128 GB
Intel Xeon Gold 6346 up to 3.6GHz
960 GB * 2EA
h2v32m256_metal
16 Core
32 vCore
256 GB
Intel Xeon Gold 6346 up to 3.6GHz
960 GB * 2EA
h2v32m512_metal
16 Core
32 vCore
512 GB
Intel Xeon Gold 6346 up to 3.6GHz
960 GB * 2EA
h2v72m256_metal
36 Core
72 vCore
256 GB
Intel Xeon Gold 6354 up to 3.6GHz
1.92 TB * 2EA
h2v72m512_metal
36 Core
72 vCore
512 GB
Intel Xeon Gold 6354 up to 3.6GHz
1.92 TB * 2EA
h2v72m1024_metal
36 Core
72 vCore
1024 GB
Intel Xeon Gold 6354 up to 3.6GHz
1.92 TB * 2EA
h2v96m384_metal
48 Core
96 vCore
384 GB
Intel Xeon Gold 6342 up to 3.3GHz
1.92 TB * 2EA
h2v96m768_metal
48 Core
96 vCore
768 GB
Intel Xeon Gold 6342 up to 3.3GHz
1.92 TB * 2EA
Table. Bare Metal Server server type specifications > s2/h2 server type
4.1.2 - Monitoring Metrics
Bare Metal Server Monitoring Metrics
The following table shows the monitoring metrics for Bare Metal Server that can be checked through Cloud Monitoring.
Guide
Bare Metal Server requires the user to install the Agent through a guide to retrieve monitoring metrics. Please install the Agent before using the stable Bare Metal Server service. For the Agent installation method and detailed Cloud Monitoring usage, refer to the Cloud Monitoring guide.
| Performance Item | Detailed Description | Unit |
|---|---|---|
| Core Usage [IO Wait] | The ratio of CPU time spent in a waiting state (disk wait) | % |
| Core Usage [System] | The ratio of CPU time spent in kernel space | % |
| Core Usage [User] | The ratio of CPU time spent in user space | % |
| CPU Cores | The number of CPU cores on the host | cnt |
| CPU Usage [Active] | The percentage of CPU time used, excluding idle and IOWait states | % |
| CPU Usage [Idle] | The ratio of CPU time spent in an idle state | % |
| CPU Usage [IO Wait] | The ratio of CPU time spent in a waiting state (disk wait) | % |
| CPU Usage [System] | The percentage of CPU time used by the kernel | % |
| CPU Usage [User] | The percentage of CPU time used by the user area | % |
| CPU Usage/Core [Active] | The percentage of CPU time used, excluding idle and IOWait states | % |
| CPU Usage/Core [Idle] | The ratio of CPU time spent in an idle state | % |
| CPU Usage/Core [IO Wait] | The ratio of CPU time spent in a waiting state (disk wait) | % |
| CPU Usage/Core [System] | The percentage of CPU time used by the kernel | % |
| CPU Usage/Core [User] | The percentage of CPU time used by the user area | % |
| Disk CPU Usage [IO Request] | The ratio of CPU time spent executing I/O requests for the device | % |
| Disk Queue Size [Avg] | The average queue length of requests executed for the device | num |
| Disk Read Bytes | The number of bytes read from the device per second | bytes |
| Disk Read Bytes [Delta Avg] | The average of system.diskio.read.bytes_delta for individual disks | bytes |
| Disk Read Bytes [Delta Max] | The maximum of system.diskio.read.bytes_delta for individual disks | bytes |
| Disk Read Bytes [Delta Min] | The minimum of system.diskio.read.bytes_delta for individual disks | bytes |
| Disk Read Bytes [Delta Sum] | The sum of system.diskio.read.bytes_delta for individual disks | bytes |
| Disk Read Bytes [Delta] | The delta of system.diskio.read.bytes for individual disks | bytes |
| Disk Read Bytes [Success] | The total number of bytes read successfully | bytes |
| Disk Read Requests | The number of read requests for the disk device per second | cnt |
| Disk Read Requests [Delta Avg] | The average of system.diskio.read.count_delta for individual disks | cnt |
| Disk Read Requests [Delta Max] | The maximum of system.diskio.read.count_delta for individual disks | cnt |
| Disk Read Requests [Delta Min] | The minimum of system.diskio.read.count_delta for individual disks | cnt |
| Disk Read Requests [Delta Sum] | The sum of system.diskio.read.count_delta for individual disks | cnt |
| Disk Read Requests [Success Delta] | The delta of system.diskio.read.count for individual disks | cnt |
| Disk Read Requests [Success] | The total number of successful reads | cnt |
| Disk Request Size [Avg] | The average size of requests executed for the device (in sectors) | num |
| Disk Service Time [Avg] | The average service time for I/O requests executed for the device (in milliseconds) | ms |
| Disk Wait Time [Avg] | The average time spent waiting for I/O requests executed for the device | ms |
| Disk Wait Time [Read] | The average disk read wait time | ms |
| Disk Wait Time [Write] | The average disk write wait time | ms |
| Disk Write Bytes [Delta Avg] | The average of system.diskio.write.bytes_delta for individual disks | bytes |
| Disk Write Bytes [Delta Max] | The maximum of system.diskio.write.bytes_delta for individual disks | bytes |
| Disk Write Bytes [Delta Min] | The minimum of system.diskio.write.bytes_delta for individual disks | bytes |
| Disk Write Bytes [Delta Sum] | The sum of system.diskio.write.bytes_delta for individual disks | bytes |
| Disk Write Bytes [Delta] | The delta of system.diskio.write.bytes for individual disks | bytes |
| Disk Write Bytes [Success] | The total number of bytes written successfully | bytes |
| Disk Write Requests | The number of write requests for the disk device per second | cnt |
| Disk Write Requests [Delta Avg] | The average of system.diskio.write.count_delta for individual disks | cnt |
| Disk Write Requests [Delta Max] | The maximum of system.diskio.write.count_delta for individual disks | cnt |
| Disk Write Requests [Delta Min] | The minimum of system.diskio.write.count_delta for individual disks | cnt |
| Disk Write Requests [Delta Sum] | The sum of system.diskio.write.count_delta for individual disks | cnt |
| Disk Write Requests [Success Delta] | The delta of system.diskio.write.count for individual disks | cnt |
| Disk Write Requests [Success] | The total number of successful writes | cnt |
| Disk Writes Bytes | The number of bytes written to the device per second | bytes |
| Filesystem Hang Check | Filesystem (local/NFS) hang check (normal: 1, abnormal: 0) | status |
| Filesystem Nodes | The total number of file nodes in the filesystem | cnt |
| Filesystem Nodes [Free] | The total number of available file nodes in the filesystem | cnt |
| Filesystem Size [Available] | The available disk space for non-privileged users (in bytes) | bytes |
| Filesystem Size [Free] | The available disk space (in bytes) | bytes |
| Filesystem Size [Total] | The total disk space (in bytes) | bytes |
| Filesystem Usage | The percentage of used disk space | % |
| Filesystem Usage [Avg] | The average of filesystem.used.pct for individual filesystems | % |
| Filesystem Usage [Inode] | The inode usage rate | % |
| Filesystem Usage [Max] | The maximum of filesystem.used.pct for individual filesystems | % |
| Filesystem Usage [Min] | The minimum of filesystem.used.pct for individual filesystems | % |
| Filesystem Usage [Total] | The total filesystem usage | % |
| Filesystem Used | The used disk space (in bytes) | bytes |
| Filesystem Used [Inode] | The inode usage | bytes |
| Memory Free | The total available memory (in bytes), excluding system cache and buffer memory | bytes |
| Memory Free [Actual] | The actual available memory (in bytes) | bytes |
| Memory Free [Swap] | The available swap memory | bytes |
| Memory Total | The total memory | bytes |
| Memory Total [Swap] | The total swap memory | bytes |
| Memory Usage | The percentage of used memory | % |
| Memory Usage [Actual] | The percentage of actual used memory | % |
| Memory Usage [Cache Swap] | The cache swap usage rate | % |
| Memory Usage [Swap] | The percentage of used swap memory | % |
| Memory Used | The used memory | bytes |
| Memory Used [Actual] | The actual used memory (in bytes), subtracted from the total memory | bytes |
| Memory Used [Swap] | The used swap memory | bytes |
| Collisions | Network collisions | cnt |
| Network In Bytes | The number of received bytes | bytes |
| Network In Bytes [Delta Avg] | The average of system.network.in.bytes_delta for individual networks | bytes |
| Network In Bytes [Delta Max] | The maximum of system.network.in.bytes_delta for individual networks | bytes |
| Network In Bytes [Delta Min] | The minimum of system.network.in.bytes_delta for individual networks | bytes |
| Network In Bytes [Delta Sum] | The sum of system.network.in.bytes_delta for individual networks | bytes |
| Network In Bytes [Delta] | The delta of received bytes | bytes |
| Network In Dropped | The number of dropped incoming packets | cnt |
| Network In Errors | The number of errors during reception | cnt |
| Network In Packets | The number of received packets | cnt |
| Network In Packets [Delta Avg] | The average of system.network.in.packets_delta for individual networks | cnt |
| Network In Packets [Delta Max] | The maximum of system.network.in.packets_delta for individual networks | cnt |
| Network In Packets [Delta Min] | The minimum of system.network.in.packets_delta for individual networks | cnt |
| Network In Packets [Delta Sum] | The sum of system.network.in.packets_delta for individual networks | cnt |
| Network In Packets [Delta] | The delta of received packets | cnt |
| Network Out Bytes | The number of transmitted bytes | bytes |
| Network Out Bytes [Delta Avg] | The average of system.network.out.bytes_delta for individual networks | bytes |
| Network Out Bytes [Delta Max] | The maximum of system.network.out.bytes_delta for individual networks | bytes |
| Network Out Bytes [Delta Min] | The minimum of system.network.out.bytes_delta for individual networks | bytes |
| Network Out Bytes [Delta Sum] | The sum of system.network.out.bytes_delta for individual networks | bytes |
| Network Out Bytes [Delta] | The delta of transmitted bytes | bytes |
| Network Out Dropped | The number of dropped outgoing packets | cnt |
| Network Out Errors | The number of errors during transmission | cnt |
| Network Out Packets | The number of transmitted packets | cnt |
| Network Out Packets [Delta Avg] | The average of system.network.out.packets_delta for individual networks | cnt |
| Network Out Packets [Delta Max] | The maximum of system.network.out.packets_delta for individual networks | cnt |
| Network Out Packets [Delta Min] | The minimum of system.network.out.packets_delta for individual networks | cnt |
| Network Out Packets [Delta Sum] | The sum of system.network.out.packets_delta for individual networks | cnt |
| Network Out Packets [Delta] | The delta of transmitted packets | cnt |
| Open Connections [TCP] | The number of open TCP connections | cnt |
| Open Connections [UDP] | The number of open UDP connections | cnt |
| Port Usage | The port usage rate | % |
| SYN Sent Sockets | The number of sockets in the SYN_SENT state (when connecting from local to remote) | cnt |
| Kernel PID Max | The value of kernel.pid_max | cnt |
| Kernel Thread Max | The value of kernel.threads-max | cnt |
| Process CPU Usage | The percentage of CPU time consumed by the process since the last update | % |
| Process CPU Usage/Core | The percentage of CPU time used by the process since the last event | % |
| Process Memory Usage | The percentage of main memory (RAM) used by the process | % |
| Process Memory Used | The resident set size, which is the amount of memory used by the process in RAM | bytes |
| Process PID | The process ID | pid |
| Process PPID | The parent process ID | pid |
| Processes [Dead] | The number of dead processes | cnt |
| Processes [Idle] | The number of idle processes | cnt |
| Processes [Running] | The number of running processes | cnt |
| Processes [Sleeping] | The number of sleeping processes | cnt |
| Processes [Stopped] | The number of stopped processes | cnt |
| Processes [Total] | The total number of processes | cnt |
| Processes [Unknown] | The number of processes with unknown or unsearchable status | cnt |
| Processes [Zombie] | The number of zombie processes | cnt |
| Running Process Usage | The process usage rate | % |
| Running Processes | The number of running processes | cnt |
| Running Thread Usage | The thread usage rate | % |
| Running Threads | The total number of threads running in running processes | cnt |
| Context Switches | The number of context switches (per second) | cnt |
| Load/Core [1 min] | The load averaged over the last 1 minute, divided by the number of cores | cnt |
| Load/Core [15 min] | The load averaged over the last 15 minutes, divided by the number of cores | cnt |
| Load/Core [5 min] | The load averaged over the last 5 minutes, divided by the number of cores | cnt |
| Multipaths [Active] | The number of external storage connection paths with status = active | cnt |
| Multipaths [Failed] | The number of external storage connection paths with status = failed | cnt |
| Multipaths [Faulty] | The number of external storage connection paths with status = faulty | cnt |
| NTP Offset | The measured offset (time difference between the NTP server and the local environment) of the last sample | num |
| Run Queue Length | The length of the run queue | num |
| Uptime | The OS uptime (in milliseconds) | ms |
| Context Switchies | The number of CPU context switches (per second) | cnt |
| Disk Read Bytes [Sec] | The number of bytes read from the Windows logical disk per second | cnt |
| Disk Read Time [Avg] | The average data read time (in seconds) | sec |
| Disk Transfer Time [Avg] | The average disk wait time | sec |
| Disk Usage | The disk usage rate | % |
| Disk Write Bytes [Sec] | The number of bytes written to the Windows logical disk per second | cnt |
| Disk Write Time [Avg] | The average data write time (in seconds) | sec |
| Pagingfile Usage | The paging file usage rate | % |
| Pool Used [Non Paged] | The non-paged pool usage in kernel memory | bytes |
| Pool Used [Paged] | The paged pool usage in kernel memory | bytes |
| Process [Running] | The number of currently running processes | cnt |
| Threads [Running] | The number of currently running threads | cnt |
| Threads [Waiting] | The number of threads waiting for processor time | cnt |
Table. Bare Metal Server Monitoring Metrics (Available when Agent is installed)
4.2 - How-to guides
The user can input required information for a Bare Metal Server through the Samsung Cloud Platform Console, select detailed options, and create the service.
Bare Metal Server Create
You can create and use the Bare Metal Server service from the Samsung Cloud Platform Console.
To create a Bare Metal Server, follow the steps below.
- All Services > Compute > Bare Metal Server Click the menu. Go to the Service Home page of Bare Metal Server.
- Click the Bare Metal Server Create button on the Service Home page. It navigates to the Bare Metal Server Create page.
- Bare Metal Server creation On the page, enter the information required to create the service, and select detailed options.
- Image and Version Selection area, select the required information.
Category Required or notDetailed description Image Required Select the type of image provided - RHEL
- Rocky Linux
- Ubuntu
- Windows
Image Version Required Select version of the chosen image - Provides a list of versions of the provided server images
Table. Bare Metal Server Image and Version Input Items - Service Information Input area, please input or select the required information.
Category Required or notDetailed description Server count Required Number of Bare Metal Server servers to create simultaneously - Only numbers can be entered, and must be between 1 and 5
Service Type > Server Type Required Bare Metal Server Server Type - Select desired vCPU, Memory, Disk specifications
- For detailed information about server types provided by Bare Metal Server, refer to Bare Metal Server Server Type
Service Type > Planned Compute Required Status of resources with Planned Compute set - In Use: Number of resources with Planned Compute set that are in use
- Configured: Number of resources with Planned Compute set
- Coverage Preview: Amount applied by Planned Compute per resource
- Apply for Planned Compute Service: Go to Planned Compute application page
- For details, refer to Apply for Planned Compute
Automation Account Required Automatically creates an account to provide automation functions after Bare Metal Server creation - The account is used only for inter-system interface purposes
- Password is encrypted and cannot be accessed outside the system
- If the account is deleted, network changes and some automation functions will be restricted
Table. Bare Metal Server Service Information Input Items - In the Required Information Input area, enter or select the required information.
Category Required or notDetailed description Administrator Account Required Set the administrator account and password to be used when connecting to the server - RHEL, Ubuntu OS are provided fixed as root
- For Windows OS, enter using lowercase English letters and numbers, 5~20 characters
Administratornot allowed
Server Name Required Enter a name to distinguish the Bare Metal Server when the selected number of servers is 1 - Set the hostname to the entered server name
- Start with a lowercase English letter, and use lowercase letters, numbers, and special character (
-) to enter within 3 to 15 characters
- Must not end with a special character (
-)
Server Name Prefix Required Input Prefix to distinguish each Bare Metal Server generated when the selected number of servers is 2 or more - Automatically generated in the form of user input value (prefix) + ‘
-###’
- Must start with a lowercase English letter, and be entered using lowercase letters, numbers, and special characters (
-) within 3 to 15 characters
- Must not end with a special character (
-)
Network Settings Required Set the network where the Bare Metal Server will be installed - Select a pre-created VPC
- General Subnet: Select a pre-created general Subnet
- IP can be set to Auto-generated or User input; if Input is selected, the user enters the IP directly
- NAT: Available only when there is a single server and the VPC has an Internet Gateway attached
- When checked, a NAT IP can be selected
- NAT IP: Select a NAT IP
- If there is no NAT IP to select, click the Create New button to generate a Public IP
- Click the Refresh button to view and select the created Public IP
- Creating a Public IP incurs charges according to the Public IP pricing policy
- Local Subnet (Optional): Choose to use a local Subnet
- Not a required element for creating the service
- Select a pre-created local Subnet
- IP can be set to Auto-generated or User input; if Input is selected, the user enters the IP directly
Table. Bare Metal Server Required Information Input Items
- Image and Version Selection area, select the required information.
Caution
Please use a firewall etc. to control traffic access for Bare Metal Server. Security Group is not provided.
The firewall of the Bare Metal Server can only be used for traffic control between the Bare Metal Server and the Virtual Server. To use the Bare Metal Server’s firewall, follow the steps below.
- Separate the VPC of the Bare Metal Server: Separate them so that the Bare Metal Server and Virtual Server do not use the same VPC.
- Create Transit Gateway: Please create the Transit Gateway.
- The integration between the VPC of Virtual Server and the VPC of Bare Metal Server uses a Transit Gateway.
- When creating a Transit Gateway integration in the VPC of a Bare Metal Server, you must also create the Bare Metal Server’s firewall.
- Firewall Rule registration: Register a rule in the Firewall of the Bare Metal Server.
- Bare Metal Server Creation on the page Additional Information Input area, enter or select the required information.
Category Required or notDetailed description Local disk partition Select Set whether to use local disk partition - Up to 10 can be created, including the root partition
- Up to 90% of total capacity can be used
- After checking Use, partition information can be set
- Root partition information setting
- Partition type: flat, lvm selectable
- Partition name: enter partition name
- Can be entered only when partition type is lvm
- Enter within 15 characters, starting with a letter and including letters, numbers, and special characters (
-)
- Partition size: enter at least 50 GB
- Filesystem type: select according to the used image
- For RHEL, Rocky Linux: xfs, ext4
- For Ubuntu: ext4, xfs, btrfs
- For SLES: btrfs, xfs, ext4
- Mount point: start with special character
/and enter within 15 characters, including letters, numbers, and special characters (-)- If Filesystem type is swap, entry not allowed
- Available capacity: 90% of the default disk capacity provided when selecting a server
- When setting partition size, the remaining capacity is automatically calculated and displayed
- Total partition disk amount cannot exceed available capacity
- Additional partition information setting
- Partition type: flat, lvm selectable
- Partition name: enter partition name
- Can be entered only when partition type is lvm
- Enter within 15 characters, starting with a letter and including letters, numbers, and special characters (
-)
- Partition size: enter at least 1 GB
- Filesystem type: select according to the used image>
- For RHEL, Rocky Linux: xfs, ext4, swap
- For Ubuntu: ext4, xfs, btrfs, swap
- For SLES: btrfs, xfs, ext4, swap
- Mount point: start with special character
/and enter within 15 characters, including letters, numbers, and special characters (-)- If Filesystem type is swap, entry not allowed
- Available capacity: 90% of the default disk capacity provided when selecting a server
- When setting partition size, the remaining capacity is automatically calculated and displayed
- Total partition disk amount cannot exceed available capacity
Placement Group Select Servers belonging to the same Placement group are distributed across different racks - Provides distributed placement for up to 2 servers belonging to the same Placement group
- For distribution of 3 or more servers, add additional Placement groups
- Applicable only at initial creation; cannot be modified after creation
- If you terminate the last server belonging to a Placement group, that Placement group is automatically deleted
Lock Select Using Lock prevents actions caused by mistakes, preventing the server from being terminated, started, or stopped Hyper Threading Select Set logical cores to operate at twice the number of physical cores - Uncheck the box to turn off Hyper Threading
- Cannot be changed after server creation
Init Script Select Script to run when the server starts - Init Script must be selected differently depending on the image type
- For Windows: Select Batch Script
- For Linux: Shell Script
Table. Bare Metal Server Additional Information Input Items - Summary Check the detailed information and estimated billing amount generated in the panel, and click the Complete button.
- When creation is complete, check the created resources on the Bare Metal Server List page.
Bare Metal Server Check detailed information
The Bare Metal Server service can view and edit the full resource list and detailed information. Bare Metal Server Details page consists of Details, Tags, Activity History tabs.
Bare Metal Server If you want to view detailed information, follow the steps below.
- All Services > Compute > Bare Metal Server Click the menu. Navigate to the Service Home page of Bare Metal Server.
- Click the Bare Metal Server menu on the Service Home page. Go to the Bare Metal Server List page.
- Bare Metal Server List page, click the resource to view detailed information. Bare Metal Server Details page moves.
- Bare Metal Server Detail page displays status information and additional feature information, and consists of Detail Information, Tag, Operation History tabs.
Category Detailed description Bare Metal Server status Status of the Bare Metal Server created by the user - Creating: server is being created
- Running:: creation complete and usable
- Editing:: IP is being changed
- Unknown: error state
- Starting: server is starting
- Stopping: server is stopping
- Stopped: server has stopped
- Terminating: termination in progress
- Terminated: termination complete
Server Control Button to change server status - Start: Start a stopped server
- Stop: Stop a running server
Service termination Button to cancel the service Table. Bare Metal Server status information and additional functions
Detailed Information
Bare Metal Server List page allows you to view detailed information of the selected resource and, if necessary, edit the information.
| Category | Detailed description |
|---|---|
| Service | Service Name |
| Resource Type | Resource Type |
| SRN | Unique resource ID in Samsung Cloud Platform
|
| Resource Name | Resource Name
|
| Resource ID | Unique resource ID in the service |
| Creator | User who created the service |
| Creation time | Service creation time |
| Editor | User who edited the service information |
| Modification DateTime | Date and time when service information was modified |
| Server name | Server name |
| Image/Version | Server’s OS image and version |
| Server Type | vCPU, memory information display |
| Planned Compute | Resource status with Planned Compute set
|
| Lock | Display lock usage status
|
| Hyper Threading | Hyper Threading usage/not usage indication
|
| Network | Network information of Bare Metal Server
|
| Local Subnet | Local Subnet information of Bare Metal Server
|
| Block Storage | Block Storage information connected to the server
|
| Init Script | View the Init Script entered when creating the server |
Table. Bare Metal Server detailed information tab items
Tag
Bare Metal Server List page, you can view the tag information of the selected resource, and add, modify, or delete it.
| Category | Detailed description |
|---|---|
| Tag List | Tag List
|
Table. Bare Metal Server Tag Tab Items
Work History
You can view the operation history of the selected resources on the Bare Metal Server List page.
| Category | Detailed description |
|---|---|
| Work History List | Resource Change History
|
Table. Bare Metal Server Work History Tab Detailed Information Items
Bare Metal Server Resource Management
If you need server control and management functions for the created Bare Metal Server resources, you can perform the tasks on the Bare Metal Server List or Bare Metal Server Details page.
Bare Metal Server Operation Control
You can start, stop, and restart a running Bare Metal Server.
To control the operation of Bare Metal Server, follow the steps below.
- All Services > Compute > Bare Metal Server Click the menu. Navigate to the Service Home page of Bare Metal Server.
- Click the Bare Metal Server menu on the Service Home page. Navigate to the Bare Metal Server List page.
- Bare Metal Server list On the page, after selecting multiple servers, you can control multiple servers simultaneously using the start and stop buttons at the top of the table.
- Bare Metal Server Details page also allows you to start and stop the server.
- Bare Metal Server List on the page click the resource to control operation and navigate to the Bare Metal Server Detail page.
- Check the server status and complete the changes using each Server Management button.
- Start: Start the stopped server.
- Stop: Stops the running server.
Guide
When a Bare Metal Server is stopped, the server’s power turns off.
- Since it may affect applications or storage in use, we recommend shutting down the OS and then stopping.
- After shutting down the OS, be sure to also stop in the Console.
Operation control unavailable
- Bare Metal Server If you cannot start when requesting a start, see below.
- When Lock is set: After changing the Lock setting to disabled, try again.
- If the Bare Metal Server’s status is not Stopped: Change the Bare Metal Server’s status to Stopped, then try again.
- If stopping a Bare Metal Server request is not possible, refer to the following.
- If Lock is set: Change the Lock setting to disabled, then try again.
- If the Bare Metal Server’s status is not Running: Change the Bare Metal Server’s status to Running, then try again.
Add Block Storage
You can add Block Storage to a Bare Metal Server.
To add Block Storage, follow the steps below.
- All Services > Compute > Bare Metal Server Click the menu. Navigate to the Service Home page of Bare Metal Server.
- Click the Bare Metal Server menu on the Service Home page. Go to the Bare Metal Server list page.
- On the Bare Metal Server List page, click the server to add Block Storage. You will be taken to the Bare Metal Server Details page.
- Click the Add button in the Block Storage item on the Bare Metal Server Details page.
- If the popup window confirming Block Storage addition opens, click the Confirm button. Move to the Block Storage (BM) Creation page.
- Block Storage(BM) Creation on the page, enter the information required to create the service and create the Block Storage.
- For detailed information about creating Block Storage(BM), please refer to Block Storage(BM) Create.
- Navigate to the Bare Metal Server Details page after adding Block Storage and verify that Block Storage has been added.
Caution
After creating Block Storage, you cannot increase the capacity.
Bare Metal Server Termination
If you terminate an unused Bare Metal Server, you can reduce operating costs. However, terminating a Bare Metal Server may cause the running service to stop immediately, so you should consider the impact of service interruption sufficiently before proceeding with the termination.
Caution
Please note that data cannot be recovered after service termination.
Caution
If you terminate the servers one by one that have Block Storage(BM) attached, the servers will be terminated but the attached Block Storage(BM) will not be terminated, so please terminate it directly from Block Storage(BM).
To cancel the Bare Metal Server, follow the steps below.
- All Services > Compute > Bare Metal Server Click the menu. Navigate to the Service Home page of Bare Metal Server.
- Click the Bare Metal Server menu on the Service Home page. Go to the Bare Metal Server list page.
- Bare Metal Server List page, select the resource to cancel, and click the Cancel Service button.
- You can select multiple resources and delete them simultaneously.
- You can also delete by clicking the Service Termination button on the Bare metal Server details page of the resource to be terminated.
- When termination is complete, check on the Bare Metal Server List page whether the resource has been terminated.
Termination Constraints
Bare Metal Server when a termination request cannot be processed, we will guide with a popup window. Please refer to the cases below.
Cancellation not allowed
Block Storage(BM) is connected (simultaneous termination of 2 or more servers): Disconnect the Block Storage(BM) first.
- For detailed information on how to cancel, please refer to Block Storage(BM) Cancel.
If File Storage is connected: Please disconnect the File Storage first.
- For detailed information on how to cancel, please refer to File Storage Cancel.
If Lock is set: After changing the Lock setting to disabled, try again.
If there is a Backup Agent or Load Balancer connection resource: Terminate the connection of that resource first.
If resource management tasks for Bare Metal Server are in progress on the same account: After the Bare Metal Server resource management tasks are completed, please try again.
If the Bare Metal Server’s status is not Running or Stopped: Change the Bare Metal Server’s status to Running or Stopped, then try again.
If the server that cannot be terminated simultaneously is included: Please select only the resources that can be terminated and try again.
Local Subnet Setup
After completing the creation of a Bare Metal Server, if you add a local Subnet on the Bare Metal Server Details page, you must configure the network settings of the local Subnet yourself.
First Connection(kr-west)
There is no local subnet connected to the Bare Metal Server, and if you are adding the first connection, proceed according to the guide below.
Caution
This guide applies to kr-west (Korea West) when adding the first local Subnet connection to the server.
- kr-south(South Korea) guide, refer to the First Connection(kr-south) chapter.
Linux - Setting up Subnet on Ubuntu
On the Ubuntu operating system, add a local Subnet, and to proceed with network configuration, follow the steps below.
On the Bare Metal Server Details page, check the Interface Name.
View the network configuration information.
Color mode[root@localhost ~]# vi /etc/netplan/50-cloud-init.yaml network: ethernets: ens2f1: match: macaddress: 68:05:ca:d4:09:91 mtu: 1500 set-name: ens2f1 ens4f1: match: macaddress: 68:05:ca:d4:09:01 mtu: 1500 set-name: ens4f1[root@localhost ~]# vi /etc/netplan/50-cloud-init.yaml network: ethernets: ens2f1: match: macaddress: 68:05:ca:d4:09:91 mtu: 1500 set-name: ens2f1 ens4f1: match: macaddress: 68:05:ca:d4:09:01 mtu: 1500 set-name: ens4f1Code block. Network configuration file lookup After adding a new VLAN, set the IP for the Bonding configuration.
- Change the ID and IP in the example code to the assigned ID and IP.Color mode
[root@localhost ~]# vi /etc/netplan/50-cloud-init.yaml network: bonds: bond-mgt: interfaces: - ens2f1 // **Bare Metal Server Details** page, enter the Interface Name you confirmed. - ens4f1 // **Bare Metal Server detailed** page, enter the Interface Name you verified. mtu: 1500 parameters: mii-monitor-interval: 100 mode: active-backup transmit-hash-policy: layer2 ethernets: ens2f1: match: macaddress: 68:05:ca:d4:09:91 mtu: 1500 set-name: ens2f1 ens4f1: match: macaddress: 68:05:ca:d4:09:01 mtu: 1500 set-name: ens4f1 vlans: bond-mgt.20: // Enter the Vlan ID confirmed in the SCP Console instead of 20. addresses: - 192.168.0.10/24 // Set it to the local Subnet IP confirmed in the SCP Console. id: 20 // Set it to the VLAN ID confirmed in the SCP Console. link: bond-mgt mtu: 1500[root@localhost ~]# vi /etc/netplan/50-cloud-init.yaml network: bonds: bond-mgt: interfaces: - ens2f1 // **Bare Metal Server Details** page, enter the Interface Name you confirmed. - ens4f1 // **Bare Metal Server detailed** page, enter the Interface Name you verified. mtu: 1500 parameters: mii-monitor-interval: 100 mode: active-backup transmit-hash-policy: layer2 ethernets: ens2f1: match: macaddress: 68:05:ca:d4:09:91 mtu: 1500 set-name: ens2f1 ens4f1: match: macaddress: 68:05:ca:d4:09:01 mtu: 1500 set-name: ens4f1 vlans: bond-mgt.20: // Enter the Vlan ID confirmed in the SCP Console instead of 20. addresses: - 192.168.0.10/24 // Set it to the local Subnet IP confirmed in the SCP Console. id: 20 // Set it to the VLAN ID confirmed in the SCP Console. link: bond-mgt mtu: 1500Code block. IP Settings
- Change the ID and IP in the example code to the assigned ID and IP.
Apply the changes to the system.
Color mode# netplan apply# netplan applyCode block. Reflect changes Check the interface status.
Color mode# ip a or # bash /usr/local/bin/ip.sh# ip a or # bash /usr/local/bin/ip.shCode block. Interface lookup
Linux – Setting up Subnet on CentOS/Red Hat
After adding a local Subnet on the CentOS/Red Hat operating system, follow the steps below to configure the network.
Caution
If you set the Interface name incorrectly, the IP information in use may be deleted, so be careful.
On the Bare Metal Server Details page, check the Interface Name.
Modify the following command and execute.
Color mode#!/usr/bin/bash IP_ADDR="10.1.1.3/24" // Set the local Subnet IP that you checked from the Console. VLAN_ID="7" // Set the Vlan ID confirmed in the Console. BOND_NAME="bond-mgt" BOND_IF_name1="ens2f1" // Enter the Interface Name you verified on the **Bare Metal Server Details** page. BOND_IF_name2="ens4f0" // **Bare Metal Server Details** Enter the Interface Name you verified on the page. # Delete Connection nmcli con down "Bond ${BOND_NAME}" nmcli con del "Bond ${BOND_NAME}" nmcli con down "System ${BOND_IF_name1}" nmcli con down "System ${BOND_IF_name2}" nmcli con del "System ${BOND_IF_name1}" nmcli con del "System ${BOND_IF_name2}" # Create Bonding nmcli con add con-name ${BOND_NAME} type bond ifname ${BOND_NAME} nmcli conn mod ${BOND_NAME} con-name "Bond ${BOND_NAME}" nmcli conn mod "Bond ${BOND_NAME}" ipv4.method disabled nmcli conn mod "Bond ${BOND_NAME}" ipv6.method ignore nmcli conn mod "Bond ${BOND_NAME}" connect.autoconnect yes nmcli conn mod "Bond ${BOND_NAME}" +bond.options mode=active-backup \ +bond.options xmit_hash_policy=layer2 \ +bond.options miimon=100 \ +bond.options num_grat_arp=1 \ +bond.options downdelay=0 \ +bond.options updelay=0 # Assign bond-slave nmcli conn add type bond-slave ifname ${BOND_IF_name1} con-name "${BOND_IF_name1}" master ${BOND_NAME} nmcli conn mod ${BOND_IF_name1} con-name "System ${BOND_IF_name1}" nmcli conn add type bond-slave ifname ${BOND_IF_name2} con-name "${BOND_IF_name2}" master ${BOND_NAME} nmcli conn mod ${BOND_IF_name2} con-name "System ${BOND_IF_name2}" # Connection UP nmcli conn up "Bond ${BOND_NAME}" # add vlan nmcli conn add type vlan ifname "${BOND_NAME}.${VLAN_ID}" con-name "${BOND_NAME}.${VLAN_ID}" id ${VLAN_ID} dev ${BOND_NAME} nmcli con mod ${BOND_NAME}.${VLAN_ID} con-name "Vlan ${BOND_NAME}.${VLAN_ID}" nmcli con mod "Vlan ${BOND_NAME}.${VLAN_ID}" ipv4.addresses ${IP_ADDR} nmcli con mod "Vlan ${BOND_NAME}.${VLAN_ID}" ipv4.method manual nmcli con mod "Vlan ${BOND_NAME}.${VLAN_ID}" ipv6.method "ignore" nmcli con mod "Vlan ${BOND_NAME}.${VLAN_ID}" connect.autoconnect yes nmcli con up "Vlan ${BOND_NAME}.${VLAN_ID}" nmcli device reapply ${BOND_NAME}.${VLAN_ID}#!/usr/bin/bash IP_ADDR="10.1.1.3/24" // Set the local Subnet IP that you checked from the Console. VLAN_ID="7" // Set the Vlan ID confirmed in the Console. BOND_NAME="bond-mgt" BOND_IF_name1="ens2f1" // Enter the Interface Name you verified on the **Bare Metal Server Details** page. BOND_IF_name2="ens4f0" // **Bare Metal Server Details** Enter the Interface Name you verified on the page. # Delete Connection nmcli con down "Bond ${BOND_NAME}" nmcli con del "Bond ${BOND_NAME}" nmcli con down "System ${BOND_IF_name1}" nmcli con down "System ${BOND_IF_name2}" nmcli con del "System ${BOND_IF_name1}" nmcli con del "System ${BOND_IF_name2}" # Create Bonding nmcli con add con-name ${BOND_NAME} type bond ifname ${BOND_NAME} nmcli conn mod ${BOND_NAME} con-name "Bond ${BOND_NAME}" nmcli conn mod "Bond ${BOND_NAME}" ipv4.method disabled nmcli conn mod "Bond ${BOND_NAME}" ipv6.method ignore nmcli conn mod "Bond ${BOND_NAME}" connect.autoconnect yes nmcli conn mod "Bond ${BOND_NAME}" +bond.options mode=active-backup \ +bond.options xmit_hash_policy=layer2 \ +bond.options miimon=100 \ +bond.options num_grat_arp=1 \ +bond.options downdelay=0 \ +bond.options updelay=0 # Assign bond-slave nmcli conn add type bond-slave ifname ${BOND_IF_name1} con-name "${BOND_IF_name1}" master ${BOND_NAME} nmcli conn mod ${BOND_IF_name1} con-name "System ${BOND_IF_name1}" nmcli conn add type bond-slave ifname ${BOND_IF_name2} con-name "${BOND_IF_name2}" master ${BOND_NAME} nmcli conn mod ${BOND_IF_name2} con-name "System ${BOND_IF_name2}" # Connection UP nmcli conn up "Bond ${BOND_NAME}" # add vlan nmcli conn add type vlan ifname "${BOND_NAME}.${VLAN_ID}" con-name "${BOND_NAME}.${VLAN_ID}" id ${VLAN_ID} dev ${BOND_NAME} nmcli con mod ${BOND_NAME}.${VLAN_ID} con-name "Vlan ${BOND_NAME}.${VLAN_ID}" nmcli con mod "Vlan ${BOND_NAME}.${VLAN_ID}" ipv4.addresses ${IP_ADDR} nmcli con mod "Vlan ${BOND_NAME}.${VLAN_ID}" ipv4.method manual nmcli con mod "Vlan ${BOND_NAME}.${VLAN_ID}" ipv6.method "ignore" nmcli con mod "Vlan ${BOND_NAME}.${VLAN_ID}" connect.autoconnect yes nmcli con up "Vlan ${BOND_NAME}.${VLAN_ID}" nmcli device reapply ${BOND_NAME}.${VLAN_ID}Code block. IP configuration script Check the interface status.
Color mode# ip a or # bash /usr/local/bin/ip.sh# ip a or # bash /usr/local/bin/ip.shCode block. Interface lookup
Setting up Subnet on Windows
After adding a local Subnet in the Windows operating system, follow these steps to configure the network.
Windows Start icon, right-click, then run the Windows PowerShell (Administrator) program.
Check the Interface Name on the Bare Metal Server Details page.
Run ncpa.cpl from the Windows Run menu.

Check whether the interface is activated, and if necessary, activate it.
- Bare Metal Server detail checked on the page Interface Name activate.

Create a Teaming.
Color modePS C:\> New-NetLbfoTeam –Name “bond-mgt” –TeamMembers ens2f1,ens4f1 PS C:\> Set-NetLbfoTeam –Name “bond-mgt” –LoadBalancingAlgorithm DynamicPS C:\> New-NetLbfoTeam –Name “bond-mgt” –TeamMembers ens2f1,ens4f1 PS C:\> Set-NetLbfoTeam –Name “bond-mgt” –LoadBalancingAlgorithm DynamicCode block. Teaming creation 
After adding a new VLAN, set the IP.
- Enter the VLAN ID and local Subnet IP confirmed on the Bare Metal Server Details page.Color mode
PS C:\> Add-NetLbfoTeamNIC -Team bond_bond-mgt -VlanID 20 -Name bond-mgt.20 PS C:\> Get-NetAdapter PS C:\> netsh interface ip set address bond-mgt.20 static “192.168.0.10/24”PS C:\> Add-NetLbfoTeamNIC -Team bond_bond-mgt -VlanID 20 -Name bond-mgt.20 PS C:\> Get-NetAdapter PS C:\> netsh interface ip set address bond-mgt.20 static “192.168.0.10/24”Code block. Windows IP Settings
- Run ncpa.cpl from the Windows Run menu to check the interface status.
First connection(kr-south)
If there is no local subnet connected to the Bare Metal Server initially, and you are adding the first connection, proceed according to the guide below.
Caution
This guide is for kr-south (Korean region) when adding the first local Subnet connection to the server.
- kr-west(Korea West) the guide that applies to First Connection(kr-west) please refer to the chapter.
Linux - Setting up Subnet on Ubuntu
To add a local Subnet on the Ubuntu operating system and proceed with network settings, follow the steps below.
After adding a new Vlan, set the IP.
- Change the ID and IP in the example code to the assigned ID and IP.Color mode
[root@localhost ~]# vi /etc/netplan/50-cloud-init.yaml network: bonds: bond-mgt: interfaces: - ens2f1 - ens4f1 mtu: 1500 parameters: mii-monitor-interval: 100 mode: active-backup transmit-hash-policy: layer2 ethernets: ens2f1: match: macaddress: 68:05:ca:d4:09:91 mtu: 1500 set-name: ens2f1 ens4f1: match: macaddress: 68:05:ca:d4:09:01 mtu: 1500 set-name: ens4f1 vlans: bond-mgt.20: addresses: - 192.168.0.10/24 id: 20 link: bond-mgt mtu: 1500 vlans: bond-mgt.21: // Enter the Vlan ID you checked on the Console instead of 21. addresses: - 192.168.0.20/24 // Set to the local Subnet IP confirmed in the Console. id: 21 // Set it to the Vlan ID verified in the Console. link: bond-mgt mtu: 1500[root@localhost ~]# vi /etc/netplan/50-cloud-init.yaml network: bonds: bond-mgt: interfaces: - ens2f1 - ens4f1 mtu: 1500 parameters: mii-monitor-interval: 100 mode: active-backup transmit-hash-policy: layer2 ethernets: ens2f1: match: macaddress: 68:05:ca:d4:09:91 mtu: 1500 set-name: ens2f1 ens4f1: match: macaddress: 68:05:ca:d4:09:01 mtu: 1500 set-name: ens4f1 vlans: bond-mgt.20: addresses: - 192.168.0.10/24 id: 20 link: bond-mgt mtu: 1500 vlans: bond-mgt.21: // Enter the Vlan ID you checked on the Console instead of 21. addresses: - 192.168.0.20/24 // Set to the local Subnet IP confirmed in the Console. id: 21 // Set it to the Vlan ID verified in the Console. link: bond-mgt mtu: 1500Code block. Vlan addition and IP setting
- Change the ID and IP in the example code to the assigned ID and IP.
Reflect the modifications in the system.
Color mode# netplan apply# netplan applyCode block. Reflect changes Check the interface status.
Color mode# ip a or # bash /usr/local/bin/ip.sh# ip a or # bash /usr/local/bin/ip.shCode block. Interface lookup
Linux – Setting up Subnet on CentOS/Red Hat
After adding a local Subnet on CentOS/Red Hat operating system, follow the steps below to configure the network.
Caution
If you add a local Subnet and configure the network incorrectly, be careful as the IP information in use may be deleted.
- Check the Bond Name for local Subnet.Color mode
# sh /usr/local/bin/ip.sh# sh /usr/local/bin/ip.shCode block. Bonding check - Modify the following command and execute.Color mode
#!/usr/bin/bash IP_ADDR="10.1.1.3/24" // Set the local Subnet IP as confirmed from the Console. VLAN_ID="7" // Set the Vlan ID confirmed in the console. BOND_NAME="bond-mgt" // Set the Bond Name confirmed in step 1. # add vlan nmcli conn add type vlan ifname "${BOND_NAME}.${VLAN_ID}" con-name "${BOND_NAME}.${VLAN_ID}" id ${VLAN_ID} dev ${BOND_NAME} nmcli con mod ${BOND_NAME}.${VLAN_ID} con-name "Vlan ${BOND_NAME}.${VLAN_ID}" nmcli con mod "Vlan ${BOND_NAME}.${VLAN_ID}" ipv4.addresses ${IP_ADDR} nmcli con mod "Vlan ${BOND_NAME}.${VLAN_ID}" ipv4.method manual nmcli con mod "Vlan ${BOND_NAME}.${VLAN_ID}" ipv6.method "ignore" nmcli con mod "Vlan ${BOND_NAME}.${VLAN_ID}" connect.autoconnect yes nmcli con up "Vlan ${BOND_NAME}.${VLAN_ID}" nmcli device reapply ${BOND_NAME}.${VLAN_ID}#!/usr/bin/bash IP_ADDR="10.1.1.3/24" // Set the local Subnet IP as confirmed from the Console. VLAN_ID="7" // Set the Vlan ID confirmed in the console. BOND_NAME="bond-mgt" // Set the Bond Name confirmed in step 1. # add vlan nmcli conn add type vlan ifname "${BOND_NAME}.${VLAN_ID}" con-name "${BOND_NAME}.${VLAN_ID}" id ${VLAN_ID} dev ${BOND_NAME} nmcli con mod ${BOND_NAME}.${VLAN_ID} con-name "Vlan ${BOND_NAME}.${VLAN_ID}" nmcli con mod "Vlan ${BOND_NAME}.${VLAN_ID}" ipv4.addresses ${IP_ADDR} nmcli con mod "Vlan ${BOND_NAME}.${VLAN_ID}" ipv4.method manual nmcli con mod "Vlan ${BOND_NAME}.${VLAN_ID}" ipv6.method "ignore" nmcli con mod "Vlan ${BOND_NAME}.${VLAN_ID}" connect.autoconnect yes nmcli con up "Vlan ${BOND_NAME}.${VLAN_ID}" nmcli device reapply ${BOND_NAME}.${VLAN_ID}Code block. IP configuration script - Check the interface status.Color mode
# ip a
or
# bash /usr/local/bin/ip.sh
# ip a or # bash /usr/local/bin/ip.shCode block. Interface lookup
Setting up Subnet on Windows
After adding a local Subnet on the Windows operating system, follow these steps to configure the network.
Windows Start icon, right-click, then run the Windows PowerShell (Administrator) program.
Check the Teaming name for local Subnet.
Color modePS C:\> Get-NetAdapterPS C:\> Get-NetAdapterCode block. Windows interface check After adding a new VLAN, set the IP.
- Enter the Teaming name confirmed in step 2, and the Vlan ID and Local Subnet IP confirmed in the Console.Color mode
PS C:\> Add-NetLbfoTeamNIC -Team bond_bond-mgt -VlanID 20 -Name bond-mgt.20 PS C:\> Get-NetAdapter PS C:\> netsh interface ip set address bond-mgt.20 static “192.168.0.10/24”PS C:\> Add-NetLbfoTeamNIC -Team bond_bond-mgt -VlanID 20 -Name bond-mgt.20 PS C:\> Get-NetAdapter PS C:\> netsh interface ip set address bond-mgt.20 static “192.168.0.10/24”Code block. Create Teaming
- Enter the Teaming name confirmed in step 2, and the Vlan ID and Local Subnet IP confirmed in the Console.
In the Windows Start menu, run ncpa.cpl to check the interface status.
Add second connection (kr-west, kr-south)
If there is a local Subnet connected to the Bare Metal Server, the guide for the second additional connection is as follows.
Because a Bonding was already created when connecting the first local Subnet, there is no procedure to create Bonding when connecting the second local Subnet.
Please refer to the details below.
Notice
This is a guide that can be applied commonly to kr-west, kr-south.
Linux - Setting up Subnet on Ubuntu
To add a local Subnet on the Ubuntu operating system and proceed with network configuration, follow the steps below.
After adding a new Vlan, set the IP.
- Change the ID and IP of the example code to the assigned ID and IP.Color mode
[root@localhost ~]# vi /etc/netplan/50-cloud-init.yaml network: bonds: bond-mgt: interfaces: - ens2f1 - ens4f1 mtu: 1500 parameters: mii-monitor-interval: 100 mode: active-backup transmit-hash-policy: layer2 ethernets: ens2f1: match: macaddress: 68:05:ca:d4:09:91 mtu: 1500 set-name: ens2f1 ens4f1: match: macaddress: 68:05:ca:d4:09:01 mtu: 1500 set-name: ens4f1 vlans: bond-mgt.20: addresses: - 192.168.0.10/24 id: 20 link: bond-mgt mtu: 1500 vlans: bond-mgt.21: // Enter the Vlan ID you checked on the console instead of 21. addresses: - 192.168.0.20/24 // Set it to the local Subnet IP confirmed from the Console. id: 21 // Set it to the Vlan ID confirmed in the Console. link: bond-mgt mtu: 1500[root@localhost ~]# vi /etc/netplan/50-cloud-init.yaml network: bonds: bond-mgt: interfaces: - ens2f1 - ens4f1 mtu: 1500 parameters: mii-monitor-interval: 100 mode: active-backup transmit-hash-policy: layer2 ethernets: ens2f1: match: macaddress: 68:05:ca:d4:09:91 mtu: 1500 set-name: ens2f1 ens4f1: match: macaddress: 68:05:ca:d4:09:01 mtu: 1500 set-name: ens4f1 vlans: bond-mgt.20: addresses: - 192.168.0.10/24 id: 20 link: bond-mgt mtu: 1500 vlans: bond-mgt.21: // Enter the Vlan ID you checked on the console instead of 21. addresses: - 192.168.0.20/24 // Set it to the local Subnet IP confirmed from the Console. id: 21 // Set it to the Vlan ID confirmed in the Console. link: bond-mgt mtu: 1500Code block. Vlan addition and IP configuration
- Change the ID and IP of the example code to the assigned ID and IP.
Apply the changes to the system.
Color mode# netplan apply# netplan applyCode block. Reflect changes Check the interface status.
Color mode# ip a or # bash /usr/local/bin/ip.sh# ip a or # bash /usr/local/bin/ip.shCode block. Interface lookup
Linux – Setting up Subnet on CentOS/Red Hat
After adding a local Subnet on CentOS/Red Hat operating system, follow the steps below to configure the network.
Caution
If you add a local Subnet and configure the network incorrectly, be careful as the IP information in use may be deleted.
- Check the Bond Name for the local Subnet.Color mode
# sh /usr/local/bin/ip.sh# sh /usr/local/bin/ip.shCode block. Bonding check - Modify the following command and execute.Color mode
#!/usr/bin/bash IP_ADDR="10.1.1.3/24" // Set the local Subnet IP as confirmed from the console. VLAN_ID="7" // Set the Vlan ID confirmed in the console. BOND_NAME="bond-mgt" // Set the Bond Name confirmed in step 1. # add vlan nmcli conn add type vlan ifname "${BOND_NAME}.${VLAN_ID}" con-name "${BOND_NAME}.${VLAN_ID}" id ${VLAN_ID} dev ${BOND_NAME} nmcli con mod ${BOND_NAME}.${VLAN_ID} con-name "Vlan ${BOND_NAME}.${VLAN_ID}" nmcli con mod "Vlan ${BOND_NAME}.${VLAN_ID}" ipv4.addresses ${IP_ADDR} nmcli con mod "Vlan ${BOND_NAME}.${VLAN_ID}" ipv4.method manual nmcli con mod "Vlan ${BOND_NAME}.${VLAN_ID}" ipv6.method "ignore" nmcli con mod "Vlan ${BOND_NAME}.${VLAN_ID}" connect.autoconnect yes nmcli con up "Vlan ${BOND_NAME}.${VLAN_ID}" nmcli device reapply ${BOND_NAME}.${VLAN_ID}#!/usr/bin/bash IP_ADDR="10.1.1.3/24" // Set the local Subnet IP as confirmed from the console. VLAN_ID="7" // Set the Vlan ID confirmed in the console. BOND_NAME="bond-mgt" // Set the Bond Name confirmed in step 1. # add vlan nmcli conn add type vlan ifname "${BOND_NAME}.${VLAN_ID}" con-name "${BOND_NAME}.${VLAN_ID}" id ${VLAN_ID} dev ${BOND_NAME} nmcli con mod ${BOND_NAME}.${VLAN_ID} con-name "Vlan ${BOND_NAME}.${VLAN_ID}" nmcli con mod "Vlan ${BOND_NAME}.${VLAN_ID}" ipv4.addresses ${IP_ADDR} nmcli con mod "Vlan ${BOND_NAME}.${VLAN_ID}" ipv4.method manual nmcli con mod "Vlan ${BOND_NAME}.${VLAN_ID}" ipv6.method "ignore" nmcli con mod "Vlan ${BOND_NAME}.${VLAN_ID}" connect.autoconnect yes nmcli con up "Vlan ${BOND_NAME}.${VLAN_ID}" nmcli device reapply ${BOND_NAME}.${VLAN_ID}Code block. IP configuration script - Check the interface status.Color mode
# ip a or # bash /usr/local/bin/ip.sh# ip a or # bash /usr/local/bin/ip.shCode block. Interface lookup
Setting Subnet in Windows
After adding a local Subnet in the Windows operating system, follow the steps below to set up the network.
Right-click the Windows Start icon, then run the Windows PowerShell (Administrator) program.
Check the Teaming name for local Subnet.
Color modePS C:\> Get-NetAdapterPS C:\> Get-NetAdapterCode block. Windows interface check After adding a new VLAN, set the IP.
- Enter the Teaming name confirmed in step 2, the Vlan ID and Local Subnet IP confirmed in the Console.Color mode
PS C:\> Add-NetLbfoTeamNIC -Team bond_bond-mgt -VlanID 20 -Name bond-mgt.20
PS C:\> Get-NetAdapter
PS C:\> netsh interface ip set address bond-mgt.20 static “192.168.0.10/24”
PS C:\> Add-NetLbfoTeamNIC -Team bond_bond-mgt -VlanID 20 -Name bond-mgt.20 PS C:\> Get-NetAdapter PS C:\> netsh interface ip set address bond-mgt.20 static “192.168.0.10/24”Code block. Teaming creation
- Enter the Teaming name confirmed in step 2, the Vlan ID and Local Subnet IP confirmed in the Console.
In the Windows Run menu, execute ncpa.cpl to check the interface status.
IP Change
IP can be changed for migration, server replacement, etc.
Caution
- If you proceed with changing the IP, you will no longer be able to communicate with that IP, and you cannot cancel the IP change while it is in progress.
- If it is a server running the Load Balancer service, you must delete the existing IP from the LB server group and directly add the changed IP as a member of the LB server group.
- Servers using Public NAT, Privat NAT must disable and reconfigure Public NAT, Privat NAT after an IP change.
- If you are using Public NAT, Privat NAT, first disable the use of Public NAT, Privat NAT, complete the IP change, and then set it again.
- Public NAT, Privat NAT usage can be changed by clicking the Edit button of Public NAT IP, Privat NAT on the Bare Metal Server Details page.
If you want to change the IP, follow the steps below.
All Services > Compute > Bare Metal Server Click the menu. Navigate to the Service Home page of Bare Metal Server.
Click the Bare Metal Server menu on the Service Home page. You will be taken to the Bare Metal Server list page.
Bare Metal Server List page, click the server to change the IP. Bare Metal Server Details page will be opened.
Click the Edit button next to the IP item on the Bare Metal Server Details page.
When the popup notifying IP modification opens, click the Confirm button. The IP Change popup opens.
IP change popup window’s Step 1, Step 2, Step 3Proceed with the tasks in order.
Guide- When changing the IP, the detailed configuration method of the IP change step varies depending on the subnet of the IP to be changed. Be sure to refer to the following example and proceed with the work for each step.
- When changing to an IP that uses the same subnet: Change to IP of the same Subnet see
- When changing to an IP that uses a different subnet: Change IP to a different Subnet see
- When each progress step is completed successfully, the task status in the upper right corner is displayed as Completed, and you can proceed to the next step.
- When performing the final check of Step 3, it is recommended to restart the server and then proceed with the inspection.
- When changing the IP, the detailed configuration method of the IP change step varies depending on the subnet of the IP to be changed. Be sure to refer to the following example and proceed with the work for each step.
After confirming that all tasks have been completed successfully, click the Confirm button.
Change to the same Subnet’s IP
Explains how to set IP per operating system when the IP to be changed uses the same subnet.
Linux – centos/redhat operating system
Step 1
Follow the next procedure and proceed with Step 1 work.
- Select the Subnet to change.
- Enter the IP to change.
- IP allocation request Click the button.
- When the popup notifying IP change confirmation opens, click the Confirm button.
- If the task completes successfully, the task status in the upper right corner will be displayed as Completed.CautionIf you proceed with the IP allocation request of Step 1, you cannot cancel or restore the IP change.
- If the task completes successfully, the task status in the upper right corner will be displayed as Completed.
Step 2
Follow the next procedure and proceed with Step 2 work.
Connect to the IP change target server using NAT IP for the IP change operation.
NoticeTo prevent situations where communication is impossible during operation, it is recommended to connect via another Virtual Server or Bare Metal Server created in the same subnet.Step 1 Enter the assigned IP and set the IP to be changed on the server.
- In the following example, replace
172.17.34.150with the assigned IP. - After checking the information of the Interface you want to change on the server, enter it instead of the example
bond-srv.9.Color mode# nmcli con mod "Vlan bond-srv.9" ipv4.addresses 172.17.34.150/24 # nmcli con mod "Vlan bond-srv.9" ipv4.method manual # nmcli device reapply bond-srv.9# nmcli con mod "Vlan bond-srv.9" ipv4.addresses 172.17.34.150/24 # nmcli con mod "Vlan bond-srv.9" ipv4.method manual # nmcli device reapply bond-srv.9Code block. IP settings to change Guide- If you set the IP, the terminal session will be disconnected.
- Step 2 After completing the task, if the task status changes to Completed, you can reconnect to the terminal.
- In the following example, replace
When all tasks are completed, select the task completion checkbox of Step 2 in the IP Change popup window.
- If the task completes successfully, the task status in the upper right corner will be displayed as Completed.Guide
- If the task status of Step 2 has been changed to Completed but there is still an issue with terminal connection, go to the All Services > Management > Support Center Contact menu and inquire.
- If the task completes successfully, the task status in the upper right corner will be displayed as Completed.
Step 3
Follow the next procedure and proceed with Step 3 work.
Connect to the target server for IP change using NAT IP and check the communication status.
- Use the following command to check again whether the previous configuration information remains and whether it has been changed correctly. If you can connect normally to the IP change target server, the changed IP is in normal communication status.Color mode
# bash /usr/local/bin/ip.sh# bash /usr/local/bin/ip.shCode block. Communication status check ReferenceNAT IP does not change.
- Use the following command to check again whether the previous configuration information remains and whether it has been changed correctly. If you can connect normally to the IP change target server, the changed IP is in normal communication status.
Once all tasks are completed, restart the server and then perform a final check.
ReferenceIt is recommended to perform the final check after restarting the server.If there are no issues in the final inspection results, select the work completion checkbox of Step 3 in the IP Change popup window.
Linux – Ubuntu Operating System
Step 1
Follow the next procedure and proceed with Step 1 work.
- Select the Subnet to change.
- Enter the IP to change.
- IP Allocation Request Click the button.
- If a popup notifying IP change confirmation opens, click the Confirm button.
- If the task completes successfully, the task status in the upper right corner will be displayed as Completed.CautionIf you proceed with the IP allocation request of Step 1, you cannot cancel or restore the IP change.
- If the task completes successfully, the task status in the upper right corner will be displayed as Completed.
Step 2
Proceed with Step 2 work following the next procedure.
To perform the IP change operation, connect to the IP change target server using a NAT IP.
GuideTo prevent situations where communication is impossible during operation, it is recommended to connect via another Virtual Server or Bare Metal Server created in the same subnet.Step 1Enter the IP assigned in Step 1 and set the IP to be changed on the server.
- In the following example, replace
172.17.34.150/24with the assigned IP. - After checking the information of the Interface you want to change on the server, enter it instead of the example
bond-srv.9.Color mode[root@localhost ~]# vi /etc/netplan/50-cloud-init.yaml network: bonds: ...................... omitted ethernets: ...................... omitted vlans: bond-srv.9: addresses: - 172.17.34.150/24 # Enter the IP assigned in Step1. gateway4: 172.17.34.2 id: 9 link: bond-srv mtu: 1500 bond-srv.350: addresses: - 172.16.87.150/24 routes: - to: 172.17.87.0/24 via: 172.16.87.1 - to: 172.17.87.0/24 via: 172.16.87.1 id: 350 link: bond-srv[root@localhost ~]# vi /etc/netplan/50-cloud-init.yaml network: bonds: ...................... omitted ethernets: ...................... omitted vlans: bond-srv.9: addresses: - 172.17.34.150/24 # Enter the IP assigned in Step1. gateway4: 172.17.34.2 id: 9 link: bond-srv mtu: 1500 bond-srv.350: addresses: - 172.16.87.150/24 routes: - to: 172.17.87.0/24 via: 172.16.87.1 - to: 172.17.87.0/24 via: 172.16.87.1 id: 350 link: bond-srvCode block. IP settings to change
- In the following example, replace
Use the Netplan apply command to apply the changes to the system.
Color mode[root@localhost ~]# netplan apply[root@localhost ~]# netplan applyCode block. Run Netplan apply Notice- If you set the IP, the terminal session will be disconnected.
- Step 2 After completing the task, if the task status changes to Completed, you can reconnect to the terminal.
When all tasks are completed, select the task completion checkbox of Step 2 in the IP Change popup window.
- If the task completes successfully, the task status in the upper right corner will be displayed as Completed.Notice
- If the task status of Step 2 has been changed to Completed but there is an issue with terminal access, go to the All Services > Management > Support Center Contact menu and inquire.
- If the task completes successfully, the task status in the upper right corner will be displayed as Completed.
Step 3
Follow the next procedure and proceed with Step 3 work.
Check the communication status by connecting to the IP change target server with NAT IP.
- Use the following command to check again whether the pre-change configuration information remains and whether it has been changed correctly. If you can connect normally to the IP change target server, the changed IP is in normal communication status.Color mode
# bash /usr/local/bin/ip.sh# bash /usr/local/bin/ip.shCode block. Communication status check ReferenceNAT IP does not change.
- Use the following command to check again whether the pre-change configuration information remains and whether it has been changed correctly. If you can connect normally to the IP change target server, the changed IP is in normal communication status.
Once all tasks are completed, restart the server and then perform a final check.
ReferenceIt is recommended to perform the final check after restarting the server.If there are no issues in the final inspection results, select the work completion checkbox of Step 3 in the IP Change popup window.
Windows Operating System
Step 1
Follow the next procedure and proceed with Step 1 work.
- Select the Subnet to change.
- Please enter the IP to change.
- IP Allocation Request Click the button.
- When the popup notifying IP change confirmation opens, click the Confirm button.
- If the task completes successfully, the task status in the upper right corner will be displayed as Completed.CautionIf you proceed with Step 1’s IP allocation request, you cannot cancel or restore the IP change.
- If the task completes successfully, the task status in the upper right corner will be displayed as Completed.
Step 2
Follow the next procedure and proceed with Step 2 work.
Connect to the target server for IP change using NAT IP for the IP change operation.
GuideTo prevent situations where communication is impossible during operation, it is recommended to connect via another Virtual Server or Bare Metal Server created in the same subnet.Right-click the Windows Start icon, then run Windows PowerShell (Administrator).
Step 1Enter the assigned IP and set the IP to be changed on the server.
- In the following example, replace
172.17.34.150with the assigned IP.Color modePS C:\> netsh interface ip set address "bond-srv.20" static 172.17.34.150 255.255.255.0PS C:\> netsh interface ip set address "bond-srv.20" static 172.17.34.150 255.255.255.0Code block. IP settings to change Notice- If you set the IP, the terminal session will be disconnected.
- Step 2 After completing the task, if the task status changes to Completed, you can reconnect to the terminal.
- In the following example, replace
When all tasks are completed, select the task completion checkbox of Step 2 in the IP change popup window.
- If the task completes successfully, the task status in the upper right corner will be displayed as Completed.Notice
- Step 2’s task status changed to Completed, and if there is an issue with terminal access, go to the All Services > Management > Support Center’s Contact Us menu and inquire.
- If the task completes successfully, the task status in the upper right corner will be displayed as Completed.
Step 3
Follow the next procedure and proceed with Step 3 work.
Connect to the server targeted for IP change using NAT IP and check the communication status.
- Use the following command to check again whether the previous configuration information remains and whether it has been changed correctly. If you can connect normally to the IP change target server, the changed IP is in normal communication status.Color mode
PS C:\> Get-NetIPAddress | Format-TablePS C:\> Get-NetIPAddress | Format-TableCode block. Communication status check ReferenceNAT IP does not change.
- Use the following command to check again whether the previous configuration information remains and whether it has been changed correctly. If you can connect normally to the IP change target server, the changed IP is in normal communication status.
Once all tasks are completed, restart the server and then perform a final check.
ReferenceIt is recommended to perform the final check after restarting the server.If there are no issues with the final inspection results, select the work completion checkbox of Step 3 in the IP change popup window.
Change to IP of another Subnet
Explains how to set IP per operating system when the IP to be changed uses a different subnet.
Linux – centos/redhat operating system
Step 1
Follow the next procedure and proceed with Step 1 work.
- Please select the Subnet to change.
- Enter the IP to change.
- IP Allocation Request button을 클릭하세요.
- When the popup that notifies IP change confirmation opens, click the Confirm button.
- If the task completes successfully, Check Vlan ID, Check Default Gateway information is displayed, and the task status at the top right is shown as Completed.CautionIf you proceed with the IP allocation request of Step 1, you cannot cancel or restore the IP change.
- If the task completes successfully, Check Vlan ID, Check Default Gateway information is displayed, and the task status at the top right is shown as Completed.
Step 2
Proceed with Step 2 work following the next procedure.
Connect to the IP change target server with a NAT IP to perform the IP change operation.
GuideTo prevent situations where communication is impossible during operation, it is recommended to connect via another Virtual Server or Bare Metal Server created in the same subnet.Add a new VLAN and set the IP to add the IP to the server.
- Add VLAN: Create the interface of the Vlan ID confirmed in Step 1. In the following example, enter the assigned ID instead of
20.
- Add VLAN: Create the interface of the Vlan ID confirmed in Step 1. In the following example, enter the assigned ID instead of
- IP Settings: Enter the IP assigned in Step 1. In the following example, replace
192.168.0.10/24with the assigned IP.Color mode# nmcli conn add type vlan ifname "bond-srv.20" con-name "bond-srv.20" id 20 dev bond-srv # nmcli con mod bond-srv.20 con-name "Vlan bond-srv.20" # nmcli con mod "Vlan bond-srv.20" ipv4.addresses 192.168.0.10/24 # nmcli con mod "Vlan bond-srv.20" ipv4.method manual # nmcli con mod "Vlan bond-srv.20" ipv6.method "ignore" # nmcli con up "Vlan bond-srv.20"# nmcli conn add type vlan ifname "bond-srv.20" con-name "bond-srv.20" id 20 dev bond-srv # nmcli con mod bond-srv.20 con-name "Vlan bond-srv.20" # nmcli con mod "Vlan bond-srv.20" ipv4.addresses 192.168.0.10/24 # nmcli con mod "Vlan bond-srv.20" ipv4.method manual # nmcli con mod "Vlan bond-srv.20" ipv6.method "ignore" # nmcli con up "Vlan bond-srv.20"Code block. IP settings to change
Set the Default Gateway on the new VLAN.
- Default gateway setting: Enter the Default gateway IP assigned in Step 1. In the following example, replace
192.168.0.1with the assigned Default gateway IP.Color mode# nmcli con mod "Vlan bond-srv.20" ipv4.gateway 192.168.0.1 # nmcli device reapply bond-srv.20# nmcli con mod "Vlan bond-srv.20" ipv4.gateway 192.168.0.1 # nmcli device reapply bond-srv.20Code block. IP settings to change Guide- If you set the Default Gateway on a new VLAN, the terminal session will be disconnected.
- Step 2 After completing the task, if the task status changes to Completed, you can reconnect to the terminal.
- Default gateway setting: Enter the Default gateway IP assigned in Step 1. In the following example, replace
When all tasks are completed, select the task completion checkbox of Step 2 in the IP Change popup window.
- If the task completes successfully, the task status in the upper right corner will be displayed as Completed.Guide
- Step 2’s work status changed to Completed, but if there is still an issue with terminal access, go to the All Services > Management > Support Center Contact menu and inquire.
- If the task completes successfully, the task status in the upper right corner will be displayed as Completed.
Step 3
Follow the next procedure and proceed with Step 3 work.
Connect to the target server for IP change using NAT IP.
After checking the Default Gateway IP of the existing (pre-change) interface, delete it.
- In the following example, enter the verified IP instead of
192.168.10.1.Color mode# ip route del default via 192.168.10.1# ip route del default via 192.168.10.1Code block. Delete Default Gateway IP of existing interface
- In the following example, enter the verified IP instead of
Connect to the IP change target server with a NAT IP and check the communication status.
- Use the following command to check again whether the previous configuration information remains and whether it has been changed correctly. If you can connect normally to the IP change target server, the changed IP is in normal communication status.Color mode
# netstat –nr
# bash /usr/local/bin/ip.sh
# netstat –nr # bash /usr/local/bin/ip.shCode block. Communication status check ReferenceNAT IP does not change.
- Use the following command to check again whether the previous configuration information remains and whether it has been changed correctly. If you can connect normally to the IP change target server, the changed IP is in normal communication status.
After checking the VLAN information of the existing IP, delete it from the server.
- In the following example, replace
30with the ID you verified.Color mode# nmcli con delete "Vlan bond-srv.30"# nmcli con delete "Vlan bond-srv.30"Code block. Delete Vlan information of existing IP
- In the following example, replace
Once all tasks are completed, restart the server and then perform a final check.
ReferenceIt is recommended to perform the final check after restarting the server.If there is no issue with the final inspection results, select the work completion checkbox of Step 3 in the IP Change popup.
Linux – Ubuntu operating system
Step 1
Follow the next procedure and proceed with Step 1 work.
- Please select the Subnet to change.
- Enter the IP to change.
- IP allocation request Click the button.
- When the popup notifying IP change confirmation opens, click the Confirm button.
- If the task completes successfully, Check Vlan ID, Check Default Gateway information is displayed, and the task status at the top right is shown as Completed.CautionStep 1’s IP allocation request cannot be cancelled or restored once processed.
- If the task completes successfully, Check Vlan ID, Check Default Gateway information is displayed, and the task status at the top right is shown as Completed.
Step 2
Follow the next procedure and proceed with Step 2 work.
Connect to the IP change target server using a NAT IP for the IP change operation.
GuideTo prevent situations where communication is impossible during operation, it is recommended to connect via another Virtual Server or Bare Metal Server created in the same subnet.To add the IP to be changed to the server, add a new VLAN and set the IP and Default Gateway.
- This is the part where content is added below the Step 1 work description in the following example.
- In the following example, enter the assigned ID and IP instead of ID and IP.Color mode
[root@localhost ~]# vi /etc/netplan/50-cloud-init.yaml network: bonds: ...................... omitted ethernets: ...................... omitted vlans: bond-srv.9: addresses: - 172.17.34.150/24 gateway4: 172.17.34.2 id: 9 link: bond-srv mtu: 1500 bond-srv.350: addresses: - 172.16.87.150/24 routes: - to: 172.17.87.0/24 via: 172.16.87.1 - to: 172.17.87.0/24 via: 172.16.87.1 id: 350 link: bond-srv # Create the interface of the Vlan ID confirmed in Step1. # Enter the IP assigned in Step1. # Enter the Default gateway IP assigned from Step1. bond-srv.20: addresses: - 192.168.0.10/24 gateway4: 192.168.0.1 id: 20 link: bond-srv mtu: 1500[root@localhost ~]# vi /etc/netplan/50-cloud-init.yaml network: bonds: ...................... omitted ethernets: ...................... omitted vlans: bond-srv.9: addresses: - 172.17.34.150/24 gateway4: 172.17.34.2 id: 9 link: bond-srv mtu: 1500 bond-srv.350: addresses: - 172.16.87.150/24 routes: - to: 172.17.87.0/24 via: 172.16.87.1 - to: 172.17.87.0/24 via: 172.16.87.1 id: 350 link: bond-srv # Create the interface of the Vlan ID confirmed in Step1. # Enter the IP assigned in Step1. # Enter the Default gateway IP assigned from Step1. bond-srv.20: addresses: - 192.168.0.10/24 gateway4: 192.168.0.1 id: 20 link: bond-srv mtu: 1500Code block. IP settings to change
Use the Netplan apply command to apply the changes to the system.
Color mode[root@localhost ~]# netplan apply[root@localhost ~]# netplan applyCode block. Netplan apply execution Notice- If you set a new Default Gateway, the terminal session will be disconnected.
- Step 2 After completing the task, if the task status changes to Completed, you can reconnect to the terminal.
When all tasks are completed, select the task completion checkbox of Step 2 in the IP Change popup window.
- If the task completes successfully, the task status in the upper right corner will be displayed as Completed.Notice
- If the task status of Step 2 has been changed to Completed but there is still an issue with terminal access, go to the All Services > Management > Support Center Contact menu and inquire.
- If the task completes successfully, the task status in the upper right corner will be displayed as Completed.
Step 3
Follow the next procedure and proceed with Step 3 work.
Connect to the target server for IP change using NAT IP.
After checking the Default Gateway IP of the existing (pre-change) interface, delete it.
- In the following example, the Delete this line row is the part that gets deleted.Color mode
[root@localhost ~]# vi /etc/netplan/50-cloud-init.yaml network: bonds: ...................... omitted ethernets: ...................... Omitted vlans: bond-srv.9: addresses: - 172.17.34.150/24 gateway4: 172.17.34.2 # Delete this line id: 9 link: bond-srv mtu: 1500 bond-srv.350: addresses: - 172.16.87.150/24 routes: - to: 172.17.87.0/24 via: 172.16.87.1 - to: 172.17.87.0/24 via: 172.16.87.1 id: 350 link: bond-srv bond-srv.20: addresses: - 192.168.0.10/24 gateway4: 192.168.0.1 id: 20 link: bond-srv mtu: 1500[root@localhost ~]# vi /etc/netplan/50-cloud-init.yaml network: bonds: ...................... omitted ethernets: ...................... Omitted vlans: bond-srv.9: addresses: - 172.17.34.150/24 gateway4: 172.17.34.2 # Delete this line id: 9 link: bond-srv mtu: 1500 bond-srv.350: addresses: - 172.16.87.150/24 routes: - to: 172.17.87.0/24 via: 172.16.87.1 - to: 172.17.87.0/24 via: 172.16.87.1 id: 350 link: bond-srv bond-srv.20: addresses: - 192.168.0.10/24 gateway4: 192.168.0.1 id: 20 link: bond-srv mtu: 1500Code block. Delete Default Gateway IP of existing interface
- In the following example, the Delete this line row is the part that gets deleted.
Connect to the IP change target server using NAT IP and check the communication status.
- Use the following command to check again whether the previous configuration information remains and whether it has been changed correctly. If you can connect normally to the IP change target server, the changed IP is in normal communication state.Color mode
# netstat –nr # bash /usr/local/bin/ip.sh# netstat –nr # bash /usr/local/bin/ip.shCode block. Communication status check ReferenceNAT IP does not change.
- Use the following command to check again whether the previous configuration information remains and whether it has been changed correctly. If you can connect normally to the IP change target server, the changed IP is in normal communication state.
Delete the existing IP.
- In the following example, the Delete this line row is the part that gets deleted.Color mode
[root@localhost ~]# vi /etc/netplan/50-cloud-init.yaml network: bonds: ...................... omitted ethernets: ...................... omitted vlans: bond-srv.9: #Delete this line addresses: # delete this line - 172.17.34.150/24 #Delete this line gateway4: 172.17.34.2 #Delete this line id: 9 #Delete this line link: bond-srv #Delete this line mtu: 1500 #Delete this line bond-srv.350: addresses: - 172.16.87.150/24 routes: - to: 172.17.87.0/24 via: 172.16.87.1 - to: 172.17.87.0/24 via: 172.16.87.1 id: 350 link: bond-srv bond-srv.20: addresses: - 192.168.0.10/24 gateway4: 192.168.0.1 id: 20 link: bond-srv mtu: 1[root@localhost ~]# vi /etc/netplan/50-cloud-init.yaml network: bonds: ...................... omitted ethernets: ...................... omitted vlans: bond-srv.9: #Delete this line addresses: # delete this line - 172.17.34.150/24 #Delete this line gateway4: 172.17.34.2 #Delete this line id: 9 #Delete this line link: bond-srv #Delete this line mtu: 1500 #Delete this line bond-srv.350: addresses: - 172.16.87.150/24 routes: - to: 172.17.87.0/24 via: 172.16.87.1 - to: 172.17.87.0/24 via: 172.16.87.1 id: 350 link: bond-srv bond-srv.20: addresses: - 192.168.0.10/24 gateway4: 192.168.0.1 id: 20 link: bond-srv mtu: 1Code block. Delete existing IP
- In the following example, the Delete this line row is the part that gets deleted.
Apply the modified items to the system.
Color mode[root@localhost ~]# netplan apply [root@localhost ~]# ip link delete bond-srv.9 # Additional actions when VLAN is deleted[root@localhost ~]# netplan apply [root@localhost ~]# ip link delete bond-srv.9 # Additional actions when VLAN is deletedCode block. Apply changes When all tasks are completed, restart the server and then conduct a final check.
Reference
It is recommended to perform the final check after restarting the server.
- If there are no issues in the final inspection results, select the work completion checkbox of Step 3 in the IP Change popup window.
Windows Operating System
Step 1
Follow the next procedure and proceed with Step 1 work.
- Select the Subnet to change.
- Enter the IP to change.
- IP Allocation Request 버튼을 클릭하세요.
- When the popup that notifies IP change confirmation opens, click the Confirm button.
- If the task completes successfully, Check Vlan ID, Check Default Gateway information is displayed, and the task status at the top right is shown as Completed.CautionIf you proceed with the IP allocation request of Step 1, you cannot cancel or revert the IP change.
- If the task completes successfully, Check Vlan ID, Check Default Gateway information is displayed, and the task status at the top right is shown as Completed.
Step 2
Proceed with Step 2 work following the next procedure.
Connect to the IP change target server using NAT IP for the IP change operation.
GuideTo prevent situations where communication is impossible during operation, it is recommended to connect via another Virtual Server or Bare Metal Server created in the same subnet.Windows Start icon, right-click, then run Windows PowerShell (Administrator).
Add a VLAN and set the IP and default gateway.
- Add VLAN: Create the interface for the Vlan ID identified in Step 1. In the following example, replace
20with the assigned ID. - IP setting: Enter the IP assigned in Step 1. In the following example, replace
46with the ifindex confirmed by Get-NetAdapter, and replace 192.168.0.10 with the assigned IP. - Default gateway setting: Enter the assigned Default gateway IP from Step 1. In the following example, replace
192.168.0.1with the assigned Default gateway IP.Color modePS C:\> Add-NetLbfoTeamNIC -Team bond_bond-srv -VlanID 20 -Name bond-srv.20 -Confirm:$false PS C:\> Get-NetAdapter PS C:\> New-NetIPAddress -InterfaceIndex 46 -IPAddress 192.168.0.10 -PrefixLength 24 –defaultgateway 192.168.0.1PS C:\> Add-NetLbfoTeamNIC -Team bond_bond-srv -VlanID 20 -Name bond-srv.20 -Confirm:$false PS C:\> Get-NetAdapter PS C:\> New-NetIPAddress -InterfaceIndex 46 -IPAddress 192.168.0.10 -PrefixLength 24 –defaultgateway 192.168.0.1Code block. IP settings to change Guide- If you set a new Default Gateway, the terminal session will be disconnected.
- Step 2 After completing the task, if the task status changes to Completed, you can reconnect to the terminal.
- Add VLAN: Create the interface for the Vlan ID identified in Step 1. In the following example, replace
When all tasks are completed, select the task completion checkbox of Step 2 in the IP Change popup window.
- If the task completes successfully, the task status in the upper right corner will be displayed as Completed.Guide
- If the work status of Step 2 has been changed to Completed but there is still an issue with terminal access, go to the All Services > Management > Support Center Contact menu and inquire.
- If the task completes successfully, the task status in the upper right corner will be displayed as Completed.
Step 3
Follow the next procedure and proceed with Step 3 work.
Connect to the IP change target server using NAT IP.
Run the interface index (ifindex) to check the existing Default Gateway IP.
Color modePS C:\> Get-NetAdapter Name InterfaceDescription ifIndex Status MacAddress LinkSpeed ---- -------------------- ------- ------ ---------- --------- bond-srv.9 Microsoft Network Adapter Multiple...#4 30 Up 40-A6-B7-27-96-D5 50 Gbps bond-srv Microsoft Network Adapter Multiple...#3 19 Up 40-A6-B7-27-96-D5 50 Gbps bond-iscsi Microsoft Network Adapter Multiple...#2 18 Up 40-A6-B7-27-96-D4 50 Gbps bond-backup Microsoft Network Adapter Multiplexo... 22 Up 68-05-CA-C9-EB-88 20 Gbps eno2 Intel(R) Ethernet Connection X722 fo... 12 Disabled 38-68-DD-36-A0-59 1 Gbps ens3f0 Intel(R) Ethernet Network Adapter XX... 11 Up 40-A6-B7-27-96-D4 25 Gbps ………………………………………….. omittedPS C:\> Get-NetAdapter Name InterfaceDescription ifIndex Status MacAddress LinkSpeed ---- -------------------- ------- ------ ---------- --------- bond-srv.9 Microsoft Network Adapter Multiple...#4 30 Up 40-A6-B7-27-96-D5 50 Gbps bond-srv Microsoft Network Adapter Multiple...#3 19 Up 40-A6-B7-27-96-D5 50 Gbps bond-iscsi Microsoft Network Adapter Multiple...#2 18 Up 40-A6-B7-27-96-D4 50 Gbps bond-backup Microsoft Network Adapter Multiplexo... 22 Up 68-05-CA-C9-EB-88 20 Gbps eno2 Intel(R) Ethernet Connection X722 fo... 12 Disabled 38-68-DD-36-A0-59 1 Gbps ens3f0 Intel(R) Ethernet Network Adapter XX... 11 Up 40-A6-B7-27-96-D4 25 Gbps ………………………………………….. omittedCode block. Get-NetAdapter execution Color modePS C:\> get-netroute -ifindex 30 ifIndex DestinationPrefix NextHop RouteMetric PolicyStore ------- ----------------- ------- ----------- ----------- 30 255.255.255.255/32 0.0.0.0 256 ActiveStore 30 224.0.0.0/4 0.0.0.0 256 ActiveStore 30 172.17.35.0/24 172.17.35.1 256 ActiveStore 30 172.17.34.255/32 0.0.0.0 256 ActiveStore 30 172.17.34.14/32 0.0.0.0 256 ActiveStore 30 172.17.34.0/24 0.0.0.0 256 ActiveStore 30 0.0.0.0/0 172.17.34.1 1 ActiveStorePS C:\> get-netroute -ifindex 30 ifIndex DestinationPrefix NextHop RouteMetric PolicyStore ------- ----------------- ------- ----------- ----------- 30 255.255.255.255/32 0.0.0.0 256 ActiveStore 30 224.0.0.0/4 0.0.0.0 256 ActiveStore 30 172.17.35.0/24 172.17.35.1 256 ActiveStore 30 172.17.34.255/32 0.0.0.0 256 ActiveStore 30 172.17.34.14/32 0.0.0.0 256 ActiveStore 30 172.17.34.0/24 0.0.0.0 256 ActiveStore 30 0.0.0.0/0 172.17.34.1 1 ActiveStoreCode block. -ifindex execution Delete the existing Default Gateway IP.
- In the following example, replace
30with the ifindex obtained via Get-NetAdapter, and replace172.17.34.1with the IP you verified.Color modePS C:\> Remove-NetRoute -ifIndex 30 -DestinationPrefix 0.0.0.0/0 -NextHop 172.17.34.1 -Confirm:$falsePS C:\> Remove-NetRoute -ifIndex 30 -DestinationPrefix 0.0.0.0/0 -NextHop 172.17.34.1 -Confirm:$falseCode block. Delete Default Gateway IP Color modePS C:\> get-netroute -ifindex 30 ifIndex DestinationPrefix NextHop RouteMetric PolicyStore ------- ----------------- ------- ----------- ----------- 30 255.255.255.255/32 0.0.0.0 256 ActiveStore 30 224.0.0.0/4 0.0.0.0 256 ActiveStore 30 172.17.34.255/32 0.0.0.0 256 ActiveStore 30 172.17.34.14/32 0.0.0.0 256 ActiveStore 30 172.17.34.0/24 0.0.0.0 256 ActiveStorePS C:\> get-netroute -ifindex 30 ifIndex DestinationPrefix NextHop RouteMetric PolicyStore ------- ----------------- ------- ----------- ----------- 30 255.255.255.255/32 0.0.0.0 256 ActiveStore 30 224.0.0.0/4 0.0.0.0 256 ActiveStore 30 172.17.34.255/32 0.0.0.0 256 ActiveStore 30 172.17.34.14/32 0.0.0.0 256 ActiveStore 30 172.17.34.0/24 0.0.0.0 256 ActiveStoreCode block. -ifindex execution Notice- If you delete the existing Default Gateway, the terminal session will be disconnected.
- Step 2 After completing the task, if the task status changes to Completed, you can reconnect to the terminal.
- In the following example, replace
Check the communication status by connecting to the IP change target server with a NAT IP.
- Use the following command to check again whether the previous configuration information remains and whether it has been changed correctly. If you can connect normally to the target server whose IP was changed, the changed IP is in normal communication state.Color mode
PS C:\> netstat –nr | findstr Default PS C:\> Get-NetIPAddress | Format-TablePS C:\> netstat –nr | findstr Default PS C:\> Get-NetIPAddress | Format-TableCode block. Communication status check ReferenceNAT IP does not change.
- Use the following command to check again whether the previous configuration information remains and whether it has been changed correctly. If you can connect normally to the target server whose IP was changed, the changed IP is in normal communication state.
Check the existing IP’s VLAN information in the Team information.
Color modePS C:\> Get-NetLbfoTeam Name : bond_bond-srv Members : {ens6f1, ens3f1} TeamNics : {bond-srv, bond-srv.9} TeamingMode : SwitchIndependent LoadBalancingAlgorithm : Dynamic Status : Up Name : bond_bond-iscsi Members : {ens6f0, ens3f0} TeamNics : bond-iscsi TeamingMode : SwitchIndependent LoadBalancingAlgorithm : Dynamic Status : Up Name : bond_bond-backup Members : {ens2f0, ens4f1} TeamNics : bond-backup TeamingMode : SwitchIndependent LoadBalancingAlgorithm : Dynamic Status : Up PS C:\> Get-NetAdapter Name InterfaceDescription ifIndex Status MacAddress LinkSpeed ---- -------------------- ------- ------ ---------- --------- bond-srv.9 Microsoft Network Adapter Multiple...#4 30 Up 40-A6-B7-27-96-D5 50 Gbps bond-srv Microsoft Network Adapter Multiple...#3 19 Up 40-A6-B7-27-96-D5 50 Gbps bond-iscsi Microsoft Network Adapter Multiple...#2 18 Up 40-A6-B7-27-96-D4 50 Gbps bond-backup Microsoft Network Adapter Multiplexo... 22 Up 68-05-CA-C9-EB-88 20 Gbps eno2 Intel(R) Ethernet Connection X722 fo... 12 Disabled 38-68-DD-36-A0-59 1 Gbps ens3f0 Intel(R) Ethernet Network Adapter XX... 11 Up 40-A6-B7-27-96-D4 25 Gbps ………………………………………….. omittedPS C:\> Get-NetLbfoTeam Name : bond_bond-srv Members : {ens6f1, ens3f1} TeamNics : {bond-srv, bond-srv.9} TeamingMode : SwitchIndependent LoadBalancingAlgorithm : Dynamic Status : Up Name : bond_bond-iscsi Members : {ens6f0, ens3f0} TeamNics : bond-iscsi TeamingMode : SwitchIndependent LoadBalancingAlgorithm : Dynamic Status : Up Name : bond_bond-backup Members : {ens2f0, ens4f1} TeamNics : bond-backup TeamingMode : SwitchIndependent LoadBalancingAlgorithm : Dynamic Status : Up PS C:\> Get-NetAdapter Name InterfaceDescription ifIndex Status MacAddress LinkSpeed ---- -------------------- ------- ------ ---------- --------- bond-srv.9 Microsoft Network Adapter Multiple...#4 30 Up 40-A6-B7-27-96-D5 50 Gbps bond-srv Microsoft Network Adapter Multiple...#3 19 Up 40-A6-B7-27-96-D5 50 Gbps bond-iscsi Microsoft Network Adapter Multiple...#2 18 Up 40-A6-B7-27-96-D4 50 Gbps bond-backup Microsoft Network Adapter Multiplexo... 22 Up 68-05-CA-C9-EB-88 20 Gbps eno2 Intel(R) Ethernet Connection X722 fo... 12 Disabled 38-68-DD-36-A0-59 1 Gbps ens3f0 Intel(R) Ethernet Network Adapter XX... 11 Up 40-A6-B7-27-96-D4 25 Gbps ………………………………………….. omittedCode block. Run Get-NetLbfoTeam Delete the existing IP’s VLAN information from the server.
- In the following example, enter the verified ID instead of
30.Color modePS C:\> Remove-NetLbfoTeamNic -Team bond_bond-srv -VlanID 30 -Confirm:$false PS C:\> Get-NetAdapter Name InterfaceDescription ifIndex Status MacAddress LinkSpeed ---- -------------------- ------- ------ ---------- --------- bond-srv Microsoft Network Adapter Multiple...#3 19 Up 40-A6-B7-27-96-D5 50 Gbps bond-iscsi Microsoft Network Adapter Multiple...#2 18 Up 40-A6-B7-27-96-D4 50 Gbps bond-backup Microsoft Network Adapter Multiplexo... 22 Up 68-05-CA-C9-EB-88 20 Gbps eno2 Intel(R) Ethernet Connection X722 fo... 12 Disabled 38-68-DD-36-A0-59 1 Gbps ens3f0 Intel(R) Ethernet Network Adapter XX... 11 Up 40-A6-B7-27-96-D4 25 Gbps ………………………………………….. omittedPS C:\> Remove-NetLbfoTeamNic -Team bond_bond-srv -VlanID 30 -Confirm:$false PS C:\> Get-NetAdapter Name InterfaceDescription ifIndex Status MacAddress LinkSpeed ---- -------------------- ------- ------ ---------- --------- bond-srv Microsoft Network Adapter Multiple...#3 19 Up 40-A6-B7-27-96-D5 50 Gbps bond-iscsi Microsoft Network Adapter Multiple...#2 18 Up 40-A6-B7-27-96-D4 50 Gbps bond-backup Microsoft Network Adapter Multiplexo... 22 Up 68-05-CA-C9-EB-88 20 Gbps eno2 Intel(R) Ethernet Connection X722 fo... 12 Disabled 38-68-DD-36-A0-59 1 Gbps ens3f0 Intel(R) Ethernet Network Adapter XX... 11 Up 40-A6-B7-27-96-D4 25 Gbps ………………………………………….. omittedCode block. Run Get-NetLbfoTeam
- In the following example, enter the verified ID instead of
Once all tasks are completed, restart the server and then perform a final check.
ReferenceIt is recommended to perform the final check after restarting the server.If there are no issues in the final inspection results, select the work completion checkbox of Step 3 in the IP Change popup window.
4.2.1 - ServiceWatch Agent Install
Users can install the ServiceWatch Agent on a Bare Metal Server to collect custom metrics and logs.
Reference
Custom metric/log collection via the ServiceWatch Agent is currently only available on Samsung Cloud Platform For Enterprise. It will be offered in other offerings in the future.
Caution
Since metric collection via ServiceWatch Agent is classified as custom metrics and incurs charges unlike the default collected metrics, it is recommended to remove or disable unnecessary metric collection settings.
ServiceWatch Agent
The agents that need to be installed on a Bare Metal Server for collecting ServiceWatch’s custom metrics and logs can be divided into two main types. It is Prometheus Exporter and Open Telemetry Collector.
| Category | Detailed description | |
|---|---|---|
| Prometheus Exporter | Provides metrics of a specific application or service in a format that Prometheus can scrape
| |
| Open Telemetry Collector | Acts as a centralized collector that gathers telemetry data such as metrics and logs from distributed systems, processes (filtering, sampling, etc.) it, and then exports it to various backends (e.g., Prometheus, Jaeger, Elasticsearch).
|
Table. Explanation of Prometheus Exporter and Open Telemetry Collector
Reference
The ServiceWatch Agent guide can be used the same as Virtual Server.
For more details, please refer to Virtual Server > ServiceWatch Agent.
4.3 - API Reference
API Reference
4.4 - CLI Reference
CLI Reference
4.5 - Release Note
Bare Metal Server
2025.10.23
FEATURE
Local disk partition Feature Added- Local disk partition feature provided
- Now you can create and use up to 10 Local disk partitions.
2025.07.01
FEATURE
Add new features and provide additional OS Image- Bare Metal Server list allows you to cancel multiple resources simultaneously.
- You can change the IP of a regular Subnet.
- OS Image has been added.
- RHEL 8.10, Ubuntu 24.04
2025.02.27
FEATURE
Placement Group functionality and OS Image, server type addition- Bare Metal Server feature addition
- Distribute servers belonging to the same Placement group across different racks.
- Additional OS Image provided(RHEL 9.4, Rocky Linux 8.6, Rocky Linux 9.4)
- Intel 4th generation (Sapphire Rapids) Processor based 3rd generation (s3/h3) server type added. For more details, refer to Bare Metal Server Server Type.
- Samsung Cloud Platform Common Feature Change
- Account, IAM and Service Home, tags, etc. have been reflected in common CX changes.
2024.10.01
NEW
Bare Metal Server Service Official Version Release- Bare Metal Server service has been officially launched.
- We have launched a Bare Metal Server service that can be used by customers exclusively without virtualizing physical servers.
5 - Multi-node GPU Cluster
5.1 - Overview
Service Overview
Multi-node GPU Cluster is a service that provides physical GPU servers without virtualization for large-scale high-performance AI calculations. It can cluster multiple GPUs using two or more bare metal servers with GPUs, and can be used conveniently with Samsung Cloud Platform’s high-performance storage and networking services.
Provided Features
Multi-node GPU Cluster provides the following functions.
- Auto Provisioning and Management: Through the web-based Console, you can easily use the standard GPU Bare Metal model server with 8 GPU cards, from provisioning to resource and cost management.
- Network Connection: Two or more Bare Metal Servers can be clustered through high-speed interconnects to process multiple GPUs, and by configuring the GPU Direct RDMA (Remote Direct Memory Access) environment, direct data IO between GPU memories is possible, enabling high-speed AI/Machine Learning calculations.
- Storage Connection: It provides various additional connection storages other than OS disks. High-speed network and high-performance SSD NAS File Storage, Block Storage, and Object Storage that are directly linked can also be used in conjunction.
- Network Setting Management: The server’s subnet/IP can be easily changed with the initially set value. NAT IP provides a management function that can be used or cancelled according to needs.
- Monitoring: You can check the monitoring information of computing resources such as CPU, GPU, Memory, Disk, etc. through Cloud Monitoring. To use the Cloud Monitoring service for Multi-node GPU Cluster, you need to install the Agent. Please install the Agent for stable service use. For more information, please refer to Multi-node GPU Cluster Monitoring Metrics.
Component
Multi-node GPU Cluster provides GPU as a Bare Metal Server type with standard images and server types, and NVSwitch and NVLink are provided.
GPU(H100)
GPU (Graphic Processing Unit) is specialized in parallel calculations that can process a large amount of data quickly, enabling large-scale parallel calculation processing in fields such as artificial intelligence (AI) and data analysis.
The following are the specifications of the GPU Type provided by the Multi-node GPU Cluster service.
| Classification | H100 Type |
|---|---|
| Product Provisioning Method | Bare Metal |
| GPU Architecture | NNVIDIA Hopper |
| GPU Memory | 80GB |
| GPU Transistors | 80 billion 4N TSMC |
| GPU Tensor Performance(based on FP16) | 989.4 TFLOPs, 1,978.9 TFLOPs* |
| GPU Memory Bandwidth | 3,352 GB/sec HBM3 |
| GPU CUDA Cores | 16,896 Cores |
| GPU Tensor Cores | 528(4th Generation) |
| NVLink performance | NVLink 4 |
| Total NVLink bandwidth | 900 GB/s |
| NVLink Signaling Rate | 25 Gbps (x18) |
| NVSwitch performance | NVSwitch 3 |
| NVSwitch GPU bandwidth | 900 GB/s |
| Total NVSwitch Aggregate Bandwidth | 7.2TB/s |
- With Sparsity
Table. GPU Type Specifications
OS and GPU Driver Version
The operating systems (OS) supported by Multi-node GPU Cluster are as follows.
| OS | OS version | GPU driver version |
|---|---|---|
| Ubuntu | 22.04 | 535.86.10, 535.183.06 |
Table. Multi-node GPU Cluster OS and GPU Driver Version
Server Type
The server types provided by Multi-node GPU Cluster are as follows. For a detailed description of the server types provided by Multi-node GPU Cluster, please refer to Multi-node GPU Cluster server type.
g2c96h8_metal
| Classification | Example | Detailed Description |
|---|---|---|
| Server Generation | g2 | Provided server generation
|
| CPU | c96 | Number of Cores
|
| GPU | h8 | GPU type and quantity
|
Table. Multi-node GPU Cluster server type format
Preceding Service
This is a list of services that must be pre-configured before creating this service. Please refer to the guide provided for each service and prepare in advance for more details.
| Service Category | Service | Detailed Description |
|---|---|---|
| Networking | VPC | A service that provides an independent virtual network in a cloud environment |
Fig. Multi-node GPU Cluster Pre-service
5.1.1 - Server Type
Multi-node GPU Cluster Server Type
Multi-node GPU Cluster is divided based on the provided GPU Type, and the GPU used in the Multi-node GPU Cluster is determined by the server type selected when creating a GPU Node. Please select the server type according to the specifications of the application you want to run in the Multi-node GPU Cluster.
The server types supported by Multi-node GPU Cluster are in the following format:
g2c96h8_metal
| Classification | Example | Detailed Description |
|---|---|---|
| Server Generation | g2 | Provided server generation
|
| CPU | c96 | Number of cores
|
| GPU | h8 | GPU type and quantity
|
Table. Multi-node GPU Cluster server type format
g2 Server Type
The g2 server type is a GPU Bare Metal Server using NVIDIA H100 Tensor Core GPU, suitable for large-scale high-performance AI computing.
- Provides up to 8 NVIDIA H100 Tensor Core GPUs
- Each GPU has 16,896 CUDA cores and 528 Tensor cores
- Supports up to 96 vCPUs and 1,920 GB of memory
- Supports up to 100 Gbps networking speed
- 900GB/s GPU and NVIDIA NVSwitch P2P communication
| Server Type | GPU | GPU Memory | CPU(Core) | Memory | Disk | GPU P2P |
|---|---|---|---|---|---|---|
| g2c96h8_metal | H100 | 640 GB | 96 vCore | 2 TB | SSD(OS) 960 GB * 2, NVMeSSD 3.84 TB * 4 | 900GB/s NVSwitch |
Table. Multi-node GPU Cluster server type specification > H100 server type
5.1.2 - Monitoring Metrics
Multi-node GPU Cluster monitoring metrics
The following table shows the monitoring metrics of Multi-node GPU Cluster that can be checked through Cloud Monitoring.
Guide
Multi-node GPU Cluster requires the user to install the Agent through the guide to view monitoring metrics. Please install the Agent before using the stable service. For the Agent installation method and detailed Cloud Monitoring usage, please refer to the Cloud Monitoring guide.
Multi-node GPU Cluster [Cluster]
| Performance Item | Detailed Description | Unit |
|---|---|---|
| Memory Total [Basic] | Available memory bytes | bytes |
| Memory Used [Basic] | Currently used memory bytes | bytes |
| Memory Swap In [Basic] | Replaced memory bytes | bytes |
| Memory Swap Out [Basic] | Swapped out memory bytes | bytes |
| Memory Free [Basic] | Unused memory bytes | bytes |
| Disk Read Bytes [Basic] | Read bytes | bytes |
| Disk Read Requests [Basic] | Number of Read Requests | cnt |
| Disk Write Bytes [Basic] | Write bytes | bytes |
| Disk Write Requests [Basic] | Write Request Count | cnt |
| CPU Usage [Basic] | 1-minute average system CPU usage rate | % |
| Instance State [Basic] | Instance Status | state |
| Network In Bytes [Basic] | Received bytes | bytes |
| Network In Dropped [Basic] | Receive Packet Drop | cnt |
| Network In Packets [Basic] | Received Packet Count | cnt |
| Network Out Bytes [Basic] | Transmission bytes | bytes |
| Network Out Dropped [Basic] | Transmission Packet Drop | cnt |
| Network Out Packets [Basic] | Transmission Packet Count | cnt |
Fig. Multi-node GPU Cluster [Cluster] Monitoring Metrics (Default Provided)
| Performance Item | Detailed Description | Unit |
|---|---|---|
| Cluster GPU Count | Cluster 내 GPU Count SUM
| cnt |
| Cluster GPU Count In Use | Cluster 내 Job이 수행중인 GPU 수
| cnt |
| Cluster GPU Usage | Cluster internal GPU Utilization AVG
| % |
| Cluster GPU Memory Usage [Avg] | Cluster GPU Memory Utilization AVG
| % |
Table. Multi-node GPU Cluster [Cluster] additional monitoring metrics (Agent installation required)
Multi-node GPU Cluster [Node]
| Performance Item | Detailed Description | Unit |
|---|---|---|
| Memory Total [Basic] | Available memory bytes | bytes |
| Memory Used [Basic] | bytes of memory currently being used | bytes |
| Memory Swap In [Basic] | Replaced memory bytes | bytes |
| Memory Swap Out [Basic] | Swapped out memory bytes | bytes |
| Memory Free [Basic] | unused memory bytes | bytes |
| Disk Read Bytes [Basic] | Read bytes | bytes |
| Disk Read Requests [Basic] Disk Read Requests Count | cnt | |
| Disk Write Bytes [Basic] | Write bytes | bytes |
| Disk Write Requests [Basic] | Write Request Count | cnt |
| CPU Usage [Basic] | 1-minute average system CPU usage rate | % |
| Instance State [Basic] | Instance Status | state |
| Network In Bytes [Basic] | Received bytes | bytes |
| Network In Dropped [Basic] | Received Packet Drop | cnt |
| Network In Packets [Basic] | Received Packet Count | cnt |
| Network Out Bytes [Basic] | Transmission bytes | bytes |
| Network Out Dropped [Basic] | Transmission Packet Drop | cnt |
| Network Out Packets [Basic] | Transmission packet count | cnt |
Fig. Multi-node GPU Cluster [Node] Monitoring Metrics (Default Provided)
| Performance Item | Detailed Description | Unit |
|---|---|---|
| GPU Count | GPU count | cnt |
| GPU Temperature | GPU temperature | ℃ |
| GPU Usage | utilization | % |
| GPU Usage [Avg] | GPU Overall Average Usage Rate(%) | % |
| GPU Power Cap | GPU’s maximum power capacity | W |
| GPU Power Usage | GPU’s current power usage | W |
| GPU Memory Usage [Avg] | GPU Memory Uti. AVG | % |
| GPU Count in use | Node’s Job-running GPU count | cnt |
| Execution Status for nvidia-smi | nvidia-smi command execution result | status |
| Core Usage [IO Wait] | The ratio of CPU time spent in waiting state (disk waiting) | % |
| Core Usage [System] | The ratio of CPU time spent in kernel space | % |
| -Core Usage [User]- | -The ratio of CPU time spent in user space- | -%- |
| CPU Cores | The number of CPU cores on the host. The maximum value of the unnormalized ratio is 100%* of the cores. The unnormalized ratio already reflects this value, and the maximum value is 100%* of the cores. | cnt |
| CPU Usage [Active] | Percentage of CPU time used excluding Idle and IOWait states (if all 4 cores are used at 100%: 400%) | % |
| CPU Usage [Idle] | The ratio of CPU time spent in idle state. | % |
| CPU Usage [IO Wait] | The percentage of CPU time spent in waiting state (disk waiting) | % |
| CPU Usage [System] | Percentage of CPU time used by the kernel (in case of using all 4 cores 100%: 400%) | % |
| CPU Usage [User] | Percentage of CPU time used in the user area. (In case of using all 4 cores 100%, 400%) | % |
| CPU Usage/Core [Active] | Percentage of CPU time used excluding Idle and IOWait states (normalized value by number of cores, 100% if all 4 cores are used at 100%) | % |
| CPU Usage/Core [Idle] | The ratio of CPU time spent in idle state. | % |
| CPU Usage/Core [IO Wait] | The ratio of CPU time spent in waiting state (disk waiting) | % |
| CPU Usage/Core [System] | Percentage of CPU time used by the kernel (normalized value by number of cores, 100% if all 4 cores are used at 100%) | % |
| CPU Usage/Core [User] | Percentage of CPU time used in the user area. (normalized value by number of cores, 100% if all 4 cores are used at 100%) | % |
| Disk CPU Usage [IO Request] | The ratio of CPU time spent executing input/output requests for the device (device bandwidth utilization). If this value is close to 100%, the device is in a saturated state. | % |
| Disk Queue Size [Avg] | The average queue length of requests executed for the device. | num |
| Disk Read Bytes | The number of bytes read from the device per second. | bytes |
| Disk Read Bytes [Delta Avg] | Average of system.diskio.read.bytes_delta for each disk | bytes |
| Disk Read Bytes [Delta Max] | Individual disks’ system.diskio.read.bytes_delta maximum | bytes |
| Disk Read Bytes [Delta Min] | Individual disks’ minimum system.diskio.read.bytes_delta | bytes |
| Disk Read Bytes [Delta Sum] | The sum of system.diskio.read.bytes_delta of individual disks | bytes |
| Disk Read Bytes [Delta] | Delta value of system.diskio.read.bytes for each disk | bytes |
| Disk Read Bytes [Success] | The total number of bytes read successfully. In Linux, it is assumed that the sector size is 512 and the value multiplied by the number of sectors read by 512 | bytes |
| Disk Read Requests | The number of read requests for the disk device in 1 second | cnt |
| Disk Read Requests [Delta Avg] | Average of system.diskio.read.count_delta for each disk | cnt |
| Disk Read Requests [Delta Max] | Maximum of system.diskio.read.count_delta for individual disks | cnt |
| Disk Read Requests [Delta Min] | Minimum of system.diskio.read.count_delta for each disk | cnt |
| Disk Read Requests [Delta Sum] | Sum of system.diskio.read.count_delta of individual disks | cnt |
| Disk Read Requests [Success Delta] | Individual disk’s system.diskio.read.count delta | cnt |
| Disk Read Requests [Success] | Total number of successful read completions | cnt |
| Disk Request Size [Avg] | The average size of requests executed for the device (unit: sector) | num |
| Disk Service Time [Avg] | The average service time (in milliseconds) for input requests executed on the device. | ms |
| Disk Wait Time [Avg] | The average time spent on requests executed for supported devices. | ms |
| Disk Wait Time [Read] | Disk Average Wait Time | ms |
| Disk Wait Time [Write] | Disk Average Wait Time | ms |
| Disk Write Bytes [Delta Avg] | Average of system.diskio.write.bytes_delta for each disk | bytes |
| Disk Write Bytes [Delta Max] | Maximum of system.diskio.write.bytes_delta for each disk | bytes |
| Disk Write Bytes [Delta Min] | Individual disks’ minimum system.diskio.write.bytes_delta | bytes |
| Disk Write Bytes [Delta Sum] | The sum of system.diskio.write.bytes_delta of individual disks | bytes |
| Disk Write Bytes [Delta] | Delta value of system.diskio.write.bytes for each disk | bytes |
| Disk Write Bytes [Success] | The total number of bytes written successfully. In Linux, it is assumed that the sector size is 512 and the value is multiplied by 512 to the number of sectors written | bytes |
| Disk Write Requests | The number of write requests to the disk device for 1 second | cnt |
| Disk Write Requests [Delta Avg] | Average of system.diskio.write.count_delta of individual disks | cnt |
| Disk Write Requests [Delta Max] | Maximum of system.diskio.write.count_delta for each disk | cnt |
| Disk Write Requests [Delta Min] | Minimum of system.diskio.write.count_delta for individual disks | cnt |
| Disk Write Requests [Delta Sum] | Sum of system.diskio.write.count_delta of individual disks | cnt |
| Disk Write Requests [Success Delta] | Individual disk’s system.diskio.write.count delta | cnt |
| Disk Write Requests [Success] | Total number of writes completed successfully | cnt |
| Disk Writes Bytes | The number of bytes written to the device per second. | bytes |
| Filesystem Hang Check | filesystem(local/NFS) hang check (normal:1, abnormal:0) | status |
| Filesystem Nodes | The total number of file nodes in the file system. | cnt |
| Filesystem Nodes [Free] | The total number of available file nodes in the file system. | cnt |
| Filesystem Size [Available] | This is the disk space (in bytes) that can be used by unauthorized users. | bytes |
| Filesystem Size [Free] | Available disk space (bytes) | bytes |
| Filesystem Size [Total] | Total Disk Space (bytes) | bytes |
| Filesystem Usage | Used Disk Space Percentage | % |
| Filesystem Usage [Avg] | Average of individual filesystem.used.pct | % |
| Filesystem Usage [Inode] | _inode usage rate | % |
| Filesystem Usage [Max] | Maximum value among individual filesystem usage percentages | % |
| Filesystem Usage [Min] | Minimum of individual filesystem used percentages | % |
| Filesystem Usage [Total] | - | % |
| Filesystem Used | Used Disk Space (bytes) | bytes |
| Filesystem Used [Inode] | Inode usage | bytes |
| Memory Free | The total amount of available memory (bytes). It does not include memory used by system cache and buffers (see system.memory.actual.free). | bytes |
| Memory Free [Actual] | Actual available memory (bytes). The calculation method varies depending on the OS, and in Linux, it is either MemAvailable from /proc/meminfo or calculated from available memory, cache, and buffer if meminfo is not available. On OSX, it is the sum of available memory and inactive memory. On Windows, it is the same as system.memory.free. | bytes |
| Memory Free [Swap] | Available swap memory. | bytes |
| Memory Total | Total Memory | bytes |
| Memory Total [Swap] | Total swap memory. | bytes |
| Memory Usage | Used memory percentage
| % |
| Memory Usage [Actual] | The percentage of memory actually used
| % |
| Memory Usage [Cache Swap] | Cache swap usage rate | % |
| Memory Usage [Swap] | Used swap memory percentage | % |
| Memory Used | Used Memory | bytes |
| Memory Used [Actual] | Actual used memory (bytes). The value subtracted from the total memory by the used memory. The available memory is calculated differently depending on the OS (refer to system.actual.free) | bytes |
| Memory Used [Swap] | Used swap memory. | bytes |
| Collisions | Network Collisions | cnt |
| Network In Bytes | Received byte count | bytes |
| Network In Bytes [Delta Avg] | Average of system.network.in.bytes_delta for each network | bytes |
| Network In Bytes [Delta Max] | Maximum of system.network.in.bytes_delta for each network | bytes |
| Network In Bytes [Delta Min] | Minimum of system.network.in.bytes_delta for each network | bytes |
| Network In Bytes [Delta Sum] | Sum of each network’s system.network.in.bytes_delta | bytes |
| Network In Bytes [Delta] | Received byte count delta | bytes |
| Network In Dropped | The number of packets deleted among incoming packets | cnt |
| Network In Errors | Number of errors during reception | cnt |
| Network In Packets | Received packet count | cnt |
| Network In Packets [Delta Avg] | Average of system.network.in.packets_delta for each network | cnt |
| Network In Packets [Delta Max] | Individual networks’ system.network.in.packets_delta maximum | cnt |
| Network In Packets [Delta Min] | Minimum of system.network.in.packets_delta for each network | cnt |
| Network In Packets [Delta Sum] | Sum of system.network.in.packets_delta of individual networks | cnt |
| Network In Packets [Delta] | Received packet count delta | cnt |
| Network Out Bytes | Transmitted byte count | bytes |
| Network Out Bytes [Delta Avg] | Average of system.network.out.bytes_delta for each network | bytes |
| Network Out Bytes [Delta Max] | Individual networks’ system.network.out.bytes_delta maximum | bytes |
| Network Out Bytes [Delta Min] | Minimum of system.network.out.bytes_delta for each network | bytes |
| Network Out Bytes [Delta Sum] | The sum of system.network.out.bytes_delta of individual networks | bytes |
| Network Out Bytes [Delta] | Transmitted byte count delta | bytes |
| Network Out Dropped | Number of packets dropped among outgoing packets. This value is not reported by the operating system, so it is always 0 in Darwin and BSD | cnt |
| Network Out Errors | Number of errors during transmission | cnt |
| Network Out Packets | Number of transmitted packets | cnt |
| Network Out Packets [Delta Avg] | Average of system.network.out.packets_delta for each network | cnt |
| Network Out Packets [Delta Max] | Maximum of system.network.out.packets_delta for each network | cnt |
| Network Out Packets [Delta Min] | Individual networks’ minimum system.network.out.packets_delta | cnt |
| Network Out Packets [Delta Sum] | Sum of system.network.out.packets_delta of individual networks | cnt |
| Network Out Packets [Delta] | Number of transmitted packets delta | cnt |
| Open Connections [TCP] | All open TCP connections | cnt |
| Open Connections [UDP] | All open UDP connections | cnt |
| Port Usage | Port usage available for connection | % |
| SYN Sent Sockets | Number of sockets in SYN_SENT state (when connecting from local to remote) | cnt |
| Kernel PID Max | kernel.pid_max value | cnt |
| Kernel Thread Max | kernel threads-max value | cnt |
| Process CPU Usage | Percentage of CPU time consumed by the process after the last update. This value is similar to the %CPU value of the process displayed by the top command on Unix systems | % |
| Process CPU Usage/Core | Percentage of CPU time used by the process since the last event, normalized by the number of cores, with a value between 0~100% | % |
| Process Memory Usage | main memory (RAM) where the process occupies a ratio | % |
| Process Memory Used | Resident Set size. The amount of memory a process occupies in RAM. In Windows, it is the current working set size | bytes |
| Process PID | Process PID | PID |
| Process PPID | Parent process’s pid | PID |
| Processes [Dead] | .dead processes count | cnt |
| Processes [Idle] | idle process count | cnt |
| Processes [Running] | Number of running processes | cnt |
| Processes [Sleeping] | sleeping processes count | cnt |
| Processes [Stopped] | Number of stopped processes | cnt |
| Processes [Total] | Total number of processes | cnt |
| Processes [Unknown] | Cannot search or unknown number of processes | cnt |
| Processes [Zombie] | Number of zombie processes | cnt |
| Running Process Usage | process usage rate | % |
| Running Processes | Number of running processes | cnt |
| Running Thread Usage | Thread usage rate | % |
| Running Threads | number of threads running in running processes | cnt |
| Instance Status | _instance status | state |
| Context Switches | context switch count (per second) | cnt |
| Load/Core [1 min] | Load for the last 1 minute divided by the number of cores | cnt |
| Load/Core [15 min] | The value of load divided by the number of cores for the last 15 minutes | cnt |
| Load/Core [5 min] | The value of load divided by the number of cores over the last 5 minutes | cnt |
| Multipaths [Active] | External storage connection path status = active count | cnt |
| Multipaths [Failed] | External storage connection path status = failed count | cnt |
| Multipaths [Faulty] | External storage connection path status = faulty count | cnt |
| NTP Offset | last sample’s measured offset (time difference between NTP server and local environment) | num |
| Run Queue Length | Execution Waiting Queue Length | num |
| Uptime | OS operation time (uptime). (milliseconds) | ms |
| Context Switchies | CPU context switch count (per second) | cnt |
| Disk Read Bytes [Sec] | number of bytes read from the windows logical disk in 1 second | cnt |
| Disk Read Time [Avg] | Data Read Average Time (sec) | sec |
| Disk Transfer Time [Avg] | Disk average wait time | sec |
| Disk Usage | Disk Usage Rate | % |
| Disk Write Bytes [Sec] | number of bytes written to the windows logical disk in 1 second | cnt |
| Disk Write Time [Avg] | Data Write Average Time (sec) | sec |
| Pagingfile Usage | Paging file usage rate | % |
| Pool Used [Non Paged] | Kernel memory Non-paged pool usage | bytes |
| Pool Used [Paged] | Paged Pool usage among kernel memory | bytes |
| Process [Running] | The number of processes currently running | cnt |
| Threads [Running] | Number of threads currently running | cnt |
| Threads [Waiting] | The number of threads waiting for processor time | cnt |
Table. Multi-node GPU Cluster [Node] additional monitoring metrics (Agent installation required)
5.2 - How-to guides
The user can enter the required information for the Multi-node GPU Cluster service through the Samsung Cloud Platform Console, select detailed options, and create the service.
Multi-node GPU Cluster Getting Started
You can create and use a Multi-node GPU Cluster service in the Samsung Cloud Platform Console.
This service consists of GPU Node and Cluster Fabric services.
GPU Node Creation
To create a Multi-node GPU Cluster, follow the steps below.
- All Services > Compute > Multi-node GPU Cluster Click the menu. Navigate to the Service Home page of Multi-node GPU Cluster.
- Click the GPU Node creation button on the Service Home page. You will be taken to the GPU Node creation page.
- GPU Node creation on the page, enter the information required to create the service, and select detailed options.
- Image and Version Selection Select the required information in the area.
Category RequiredDetailed description Image Required Select provided image type - Ubuntu
Image Version Required Select version of the chosen image - Provides a list of versions of the provided server images
Table. GPU Node image and version selection items
- Image and Version Selection Select the required information in the area.
- Enter service information area, input or select the required information.
Category RequiredDetailed description Number of servers Required Number of GPU Node servers to create simultaneously - Only numbers can be entered, and the minimum number of servers to create is 2.
- Only during the initial setup can you create 2 or more, and expansion is possible one at a time.
Service Type > Server Type Required GPU Node Server Type - Select desired CPU, Memory, GPU, Disk specifications
- For detailed information about the server types provided by GPU Node, refer to Multi-node GPU Cluster Server Type
Service Type > Planned Compute Required Status of resources with Planned Compute set - In Use: Number of resources with Planned Compute that are currently in use
- Configured: Number of resources with Planned Compute set
- Coverage Preview: Amount applied per resource by Planned Compute
- Planned Compute Service Application: Go to the Planned Compute service application page
- For details, refer to Apply for Planned Compute
Table. GPU Node Service Information Input Items- Required Information Input area, enter or select the required information.
Category Required or notDetailed description Administrator Account Required Set the administrator account and password to be used when connecting to the server - Ubuntu OS is provided fixed as root
Server Name Prefix Required Enter a Prefix to distinguish each GPU Node generated when the number of selected servers is 2 or more - Automatically generated as user input value (prefix) + ‘
-###’ format
- Start with a lowercase English letter, and use lowercase letters, numbers, and special characters (
-) within 3 to 11 characters
- Must not end with a special character (
-)
Network Settings Required Set the network where the GPU Node will be installed - VPC Name:Select a pre-created VPC
- General Subnet Name: Select a pre-created general Subnet
- IP can be set to auto-generate or user input, and if input is selected, the user enters the IP directly
- NAT: Can be used only when there is 1 server and the VPC has an Internet Gateway attached. Checking ‘use’ allows selection of a NAT IP. (When first created, it is generated only with 2 or more servers, so modify on the resource detail page)
- NAT IP: Select NAT IP
- If there is no NAT IP to select, click the Create New button to generate a Public IP
- Click the Refresh button to view and select the created Public IP
- Creating a Public IP incurs charges according to the Public IP pricing policy
Table. GPU Node required information entry items
- Cluster selection area, create or select a Cluster Fabric.
Category RequiredDetailed description Cluster Fabric Required Setting of a group of GPU Node servers that can apply GPU Direct RDMA together - Optimal GPU performance and speed can be secured only within the same Cluster Fabric
- When creating a new Cluster Fabric, select *New Input > Node pool, then enter the name of the Cluster Fabric to be created
- To add to an existing Cluster Fabric, select Existing Input > Node pool, then select the already created Cluster Fabric
Table. GPU Node Cluster Fabric selection items- Additional Information Input Enter or select the required information in the area.
Category Required or notDetailed description Lock Select Using Lock prevents accidental actions that could terminate/start/stop the server Init Script Select Script to run when the server starts - Init Script must be selected differently depending on the image type
- For Linux: Select Shell Script or cloud-init
Tag Select Add Tag - Up to 50 can be added per resource
- After clicking the Add Tag button, enter or select Key, Value values
Table. GPU Node additional information input items - Init Script must be selected differently depending on the image type
- Summary Check the detailed information and estimated billing amount generated in the panel, and click the Complete button.
- Once creation is complete, check the created resources on the GPU Node List page.
Caution
- When creating a service, the GPU MIG/ECC settings are reset. However, to apply the correct settings, perform a one-time reboot initially, verify whether the settings have been applied, and then use it.
- For detailed information about GPU MIG/ECC settings reset, please refer to GPU MIG/ECC Settings Reset Checklist Guide.
GPU Node Check Detailed Information
The Multi-node GPU Cluster service allows you to view and edit the full list of GPU Node resources and detailed information.
GPU Node Details page consists of Details, Tags, Job History tabs.
To view detailed information of the GPU Node, follow the steps below.
All Services > Compute > Multi-node GPU Cluster > GPU Node Click the menu. Navigate to the Service Home page of Multi-node GPU Cluster.
Click the GPU Node menu on the Service Home page. Navigate to the GPU Node List page.
- Resource items other than required columns can be added via the Settings button.
Category Required or notDetailed description Resource ID Select User-created GPU Node ID Cluster Fabric name required Cluster Fabric name created by the user Server name Required User-created GPU Node name Server Type Required Server type of GPU Node - User can check the number of cores, memory capacity, GPU type and count of the created resources
Image Required User-generated GPU Node image version IP Required IP of the GPU Node created by the user Status Required Status of the GPU Node created by the user Creation Time Select GPU Node creation time Table. GPU Node Resource List Items
- Resource items other than required columns can be added via the Settings button.
GPU Node List Click the resource to view detailed information. GPU Node Details You will be taken to the page.
- GPU Server Details At the top of the page, status information and descriptions of additional features are displayed.
Category Detailed description GPU Node status Status of GPU Node created by the user - Creating: State where the server is being created
- Running:: State where creation is complete and usable
- Editing:: State where IP is being changed
- Unknown: Error state
- Starting: State where the server is starting
- Stopping: State where the server is stopping
- Stopped: State where the server has stopped
- Terminating: State where termination is in progress
- Terminated: State where termination is complete
Server Control Button to change server status - Start: Start a stopped server
- Stop: Stop a running server
Service cancellation Button to cancel the service Table. GPU Node status information and additional features
- GPU Server Details At the top of the page, status information and descriptions of additional features are displayed.
Detailed Information
GPU Node List page’s Details Tab you can view the detailed information of the selected resource, and if necessary, edit the information.
| Category | Detailed description |
|---|---|
| Service | Service Name |
| Resource Type | Resource Type |
| SRN | Unique resource ID in Samsung Cloud Platform
|
| Resource Name | Resource Name
|
| Resource ID | Unique resource ID in the service |
| Creator | User who created the service |
| Creation time | Service creation time |
| Modifier | User who edited the service information |
| Modification date/time | Date and time when the service information was modified |
| Server name | Server name |
| Node pool | A group of nodes that can be grouped together with the same Cluster Fabric |
| Cluster Fabric name | Cluster Fabric name created by the user |
| Image/Version | Server’s OS image and version |
| Server Type | CPU, Memory, GPU, Information Display |
| Planned Compute | Resource status with Planned Compute set
|
| Lock | Display lock usage status
|
| Network | GPU Node network information
|
| Block Storage | Block Storage information connected to the server
|
| Init Script | View the Init Script content entered when creating the server |
Table. GPU Node detailed information tab items
Tag
GPU Node List page’s Tag Tab you can view the tag information of the selected resource, and add, modify, or delete it.
| Category | Detailed description |
|---|---|
| Tag List | Tag List
|
Table. GPU Node Tag Tab Items
Work History
GPU Node List page’s Job History tab allows you to view the job history of the selected resource.
| Category | Detailed description |
|---|---|
| Work History List | Resource Change History
|
Table. GPU Node Job History Tab Detailed Information Items
GPU Node Operation Control
If you need server control and management functions for the generated GPU Node resources, you can perform tasks on the GPU Node List or GPU Node Details page. You can start and stop the running GPU Node resources.
GPU Node Getting Started
You can start a stopped GPU Node. To start the GPU Node, follow the steps below.
- All Services > Compute > Multi-node GPU Cluster Click the menu. Navigate to the Service Home page of Multi-node GPU Cluster.
- Click the GPU Node menu on the Service Home page. You will be taken to the GPU Node List page.
- On the GPU Node List page, after selecting individual or multiple servers with the checkbox, you can Start via the More button at the top.
- GPU Node List page, click the resource. GPU Node Details page will be opened.
- GPU Node Details on the page, click the Start button at the top to start the server.
- Check the server status and complete the status change.
Stop GPU Node
You can stop a GPU Node that is active. To stop the GPU Node, follow the steps below.
- All Services > Compute > Multi-node GPU Cluster Click the menu. Move to Multi-node GPU Cluster’s Service Home page.
- Click the GPU Node menu on the Service Home page. You will be taken to the GPU Node List page.
- GPU Node List page, you can control individual or multiple servers by selecting the checkboxes and then using the Stop button at the top.
- GPU Node List page, click the resource. GPU Node Details page, navigate.
- GPU Node Details on the page, click the Stop button at the top to stop the server.
- Check the server status and complete the status change.
GPU Node Cancel
You can cancel unused GPU nodes to reduce operating costs. However, if you cancel the service, the running service may be stopped immediately, so you should consider the impact of service interruption sufficiently before proceeding with the cancellation.
Caution
Please note that data cannot be recovered after service termination.
To cancel the GPU Node, follow the steps below.
- All Services > Compute > Multi-node GPU Server Click the menu. Navigate to the Service Home page of the Multi-node GPU Cluster.
- Click the Cluster Fabric menu on the Service Home page. You will be taken to the Cluster Fabric List page.
- Cluster Fabric List page, select the resource to cancel, and click the Cancel Service button.
- Resources using the same Cluster Fabric can be terminated simultaneously.
- Once the termination is complete, check on the GPU Node List page whether the resources have been terminated.
Guide
The cases where GPU Node termination is not possible are as follows.
- When Block Storage (BM) is connected: Please disconnect the Block Storage (BM) connection first.
- If File Storage is connected: Please disconnect the File Storage first.
- When Lock is set: Please change the Lock setting to unused and try again.
- If the server that cannot be terminated simultaneously is included: Please re-select only the resources that can be terminated.
- If the Cluster Fabric of the server you want to terminate is different: Select only resources that use the same Cluster Fabric.
Reference
If all GPU Nodes in the Cluster Fabric are deleted, the Cluster Fabric is automatically deleted.
5.2.1 - Cluster Fabric Management
Cluster Fabric is a service that helps manage servers (GPU Nodes) included in a GPU Cluster. Using Cluster Fabric, you can move servers between GPU Clusters in the same Node pool and optimize the performance and speed of GPUs within the same GPU Cluster.
Creating Cluster Fabric
Cluster Fabric can be created together with a GPU Node, and it cannot be created or deleted separately. When all GPU Nodes within a Cluster Fabric are terminated, the Cluster Fabric is automatically deleted. If you haven’t created a GPU Node, please create one first. For more information, refer to Creating a GPU Node.
Checking Cluster Fabric Details
Guide
- Cluster Fabric can be created together with a GPU Node, and it cannot be created or deleted separately.
- When all GPU Nodes within a Cluster Fabric are terminated, the Cluster Fabric is automatically deleted.
- If you haven’t created a GPU Node, please create one first. For more information, refer to Creating a GPU Node.
You can check the created Cluster Fabric list and details, and move servers on the Cluster Fabric List page and Cluster Fabric Details page.
Click on All Services > Compute > Multi-node GPU Server menu. It will move to the Service Home page of the Multi-node GPU Cluster.
Click on the Cluster Fabric menu on the Service Home page. It will move to the Cluster Fabric List page.
- On the Cluster Fabric List page, you can view the list of resources of the GPU Cluster created by the user.
- Resource items other than required columns can be added through the Settings button.
Category RequiredDescription Resource ID Optional Cluster Fabric ID created by the user Cluster Fabric Name Required Cluster Fabric name created by the user Node Pool Optional A collection of nodes that can be bundled into the same Cluster Fabric Number of Servers Optional Number of GPU Nodes Server Type Optional Server type of the GPU Node - The user can check the number of cores, memory capacity, and GPU type and number of the created resource
Status Optional Status of the Cluster Fabric created by the user Creation Time Optional Time when the Cluster Fabric was created Table. Cluster Fabric resource list items
Click on the resource to check the details on the Cluster Fabric List page. It will move to the Cluster Fabric Details page.
- At the top of the Cluster Fabric Details page, status information and additional feature descriptions are displayed.
Category Description Cluster Fabric Status Status of the Cluster Fabric created by the user - Creating: Cluster creation in progress
- Active: Creation completed and available
- Editing: IP change in progress
- Deleting: Termination in progress
- Deleted: Termination completed
Add Target Server Function to move a server from another cluster to this cluster Table. Cluster Fabric status information and additional features
- At the top of the Cluster Fabric Details page, status information and additional feature descriptions are displayed.
Details
On the Details tab of the Cluster Fabric List page, you can check the details of the selected resource and bring in servers from other clusters.
| Category | Description |
|---|---|
| Service | Service category |
| Resource Type | Service name |
| SRN | Unique resource ID in Samsung Cloud Platform
|
| Resource Name | Resource name
|
| Resource ID | Unique resource ID in the service |
| Creator | User who created the service |
| Creation Time | Time when the service was created |
| Modifier | User who modified the service information |
| Modification Time | Time when the service information was modified |
| Cluster Fabric Name | Cluster Fabric name created by the user |
| Node Pool | A collection of nodes that can be bundled into the same Cluster Fabric |
| Target Server | List of GPU Nodes bound to the Cluster Fabric
|
Table. Cluster Fabric details tab items
Bringing in Cluster Fabric Servers
Using the Add Target Server feature on the Cluster Fabric Details page, you can bring in servers from other clusters and add them to the selected cluster.
- Click on All Services > Compute > Multi-node GPU Server menu. It will move to the Service Home page of the Multi-node GPU Cluster.
- Click on the Cluster Fabric menu on the Service Home page. It will move to the Cluster Fabric List page.
- Click on the resource to check the details on the Cluster Fabric List page. It will move to the Cluster Fabric Details page.
- Click the Add button on the right side of the target server on the details tab.
- The target server addition popup window opens.
- Cluster Fabric Select a cluster.
- The GPU Node bound to the selected cluster is retrieved, and you can select the GPU Node to bring in.
- The selected GPU Node is listed at the bottom with the GPU Node name.
- Click the Confirm button to complete.
- Click the Cancel button to cancel the task.
- Check if the added GPU Node is retrieved in the target server.
- The target server addition popup window opens.
Terminating Cluster Fabric
When all GPU Nodes within a Cluster Fabric are terminated, the Cluster Fabric is automatically deleted. For more information, refer to Terminating a GPU Node.
5.2.2 - ServiceWatch Agent Install
Users can install the ServiceWatch Agent on the GPU node of a Multi-node GPU Cluster to collect custom metrics and logs.
Reference
Collecting custom metrics/logs via ServiceWatch Agent is currently only available on Samsung Cloud Platform For Enterprise. It will be offered in other offerings in the future.
Caution
Since metric collection via ServiceWatch Agent is classified as custom metrics and incurs charges unlike the default collected metrics, it is recommended to remove or disable unnecessary metric collection settings.
ServiceWatch Agent
The agents that need to be installed on the GPU nodes of a multi-node GPU cluster for collecting ServiceWatch custom metrics and logs can be broadly divided into two types. This is Prometheus Exporter and Open Telemetry Collector.
| Category | Detailed description | |
|---|---|---|
| Prometheus Exporter | Provides metrics of a specific application or service in a format that Prometheus can scrape
| |
| Open Telemetry Collector | Acts as a centralized collector that gathers telemetry data such as metrics and logs from distributed systems, processes (filtering, sampling, etc.) them, and then exports to various backends (e.g., Prometheus, Jaeger, Elasticsearch, etc.)
|
Table. Description of Prometheus Exporter and Open Telemetry Collector
Notice
If you have configured Kubernetes Engine on a GPU Node, please check GPU metrics through the metrics provided by Kubernetes Engine.
- If you install the DCGM Exporter on a GPU node where Kubernetes Engine is configured, it may not work properly.
Reference
The ServiceWatch Agent guide for collecting GPU metrics on a GPU Node can be used the same as on a GPU Server.
For more details, see GPU Server > ServiceWatch Agent.
5.2.3 - Multi-node GPU Cluster Service Scope and Inspection Guide
Multi-node GPU Cluster service scope
In the event of an IaaS HW level issue with the Multi-node GPU Cluster service, technical support can be received through the Support Center’s Contact Us. However, risks due to changes such as OS Kernel updates or application installation are the responsibility of the user, so technical support may be difficult, please be cautious when performing system updates or other tasks.
IaaS HW level problem
- IPMI(iLO) HW monitoring console where the server’s internal HW fault event occurrence message occurs
- GPU HW operation error confirmed in nvdia-smi command
- HW error messages occurring from InfiniBand HCA card or InfiniBand Switch inspection
Caution
Multi-node GPU Cluster is a service sensitive to software version compatibility of Ubuntu OS / NVDIA / Infiniband, so official technical support is not available after changes such as the user’s OS kernel update or application installation.
IaaS HW Inspection Guide
After applying for the Multi-node GPU Cluster service, it is recommended to check the IaaS HW level according to the inspection guide.
OS Kernel and Package Holding
Notice
- If you do not want automatic updates of package versions, it is recommended to block package updates using the
apt-markcommand. - It is recommended to block the update of Linux kernel or IB related package versions.
To proceed with OS Kernel and Package holding, follow the procedure below.
- Use the following command to check the version of the kernel and IB-related packages.Color mode
root@bm-dev-001:~# dpkg -l | egrep -i "kernel | mlnx" root@bm-dev-001:~# dpkg -l | egrep -i "kernel | nvidia" root@bm-dev-001:~# dpkg -l | egrep -i "kernel | linux-image" ii crash 7.2.8-1ubuntu1.20.04.1 amd64 kernel debugging utility, allowing gdb like syntax ii dkms 2.8.1-5ubuntu2 all Dynamic Kernel Module Support Framework ii dmeventd 2:1.02.167-1ubuntu1 amd64 Linux Kernel Device Mapper event daemon ii dmsetup 2:1.02.167-1ubuntu1 amd64 Linux Kernel Device Mapper userspace library ii iser-dkms 5.4-OFED.5.4.3.0.1.1 all DKMS support fo iser kernel modules ii isert-dkms 5.4-OFED.5.4.3.0.1.1 all DKMS support fo isert kernel modules ii kernel-mft-dkms 4.17.2-12 all DKMS support for kernel-mft kernel modules ii kmod 27-1ubuntu2 amd64 tools for managing Linux kernel modules ii knem 1.1.4.90mlnx1-OFED.5.1.2.5.0.1 amd64 userspace tools for the KNEM kernel module ii knem-dkms 1.1.4.90mlnx1-OFED.5.1.2.5.0.1 all DKMS support for mlnx-ofed kernel modules ii libaio1:amd64 0.3.112-5 amd64 Linux kernel AIO access library - shared library ii libdevmapper-event1.02.1:amd64 2:1.02.167-1ubuntu1 amd64 Linux Kernel Device Mapper event support library ii libdevmapper1.02.1:amd64 2:1.02.167-1ubuntu1 amd64 Linux Kernel Device Mapper userspace library ii libdrm-amdgpu1:amd64 2.4.107-8ubuntu1~20.04.2 amd64 Userspace interface to amdgpu-specific kernel DRM services -- runtime ii libdrm-common 2.4.107-8ubuntu1~20.04.2 all Userspace interface to kernel DRM services -- common files ii libdrm-intel1:amd64 2.4.107-8ubuntu1~20.04.2 amd64 Userspace interface to intel-specific kernel DRM services -- runtime ii libdrm-nouveau2:amd64 2.4.107-8ubuntu1~20.04.2 amd64 Userspace interface to nouveau-specific kernel DRM services -- runtime ii libdrm-radeon1:amd64 2.4.107-8ubuntu1~20.04.2 amd64 Userspace interface to radeon-specific kernel DRM services -- runtime ii libdrm2:amd64 2.4.107-8ubuntu1~20.04.2 amd64 Userspace interface to kernel DRM services -- runtime ii linux-firmware 1.187.29 all Firmware for Linux kernel drivers hi linux-generic 5.4.0.105.109 amd64 Complete Generic Linux kernel and headers ii linux-headers-5.4.0-104 5.4.0-104.118 all Header files related to Linux kernel version 5.4.0 ii linux-headers-5.4.0-104-generic 5.4.0-104.118 amd64 Linux kernel headers for version 5.4.0 on 64 bit x86 SMP ii linux-headers-5.4.0-105 5.4.0-105.119 all Header files related to Linux kernel version 5.4.0 ii linux-headers-5.4.0-105-generic 5.4.0-105.119 amd64 Linux kernel headers for version 5.4.0 on 64 bit x86 SMP hi linux-headers-generic 5.4.0.105.109 amd64 Generic Linux kernel headers ii linux-image-5.4.0-104-generic 5.4.0-104.118 amd64 Signed kernel image generic ii linux-image-5.4.0-105-generic 5.4.0-105.119 amd64 Signed kernel image generic hi linux-image-generic 5.4.0.105.109 amd64 Generic Linux kernel image ii linux-libc-dev:amd64 5.4.0-105.119 amd64 Linux Kernel Headers for development ii linux-modules-5.4.0-104-generic 5.4.0-104.118 amd64 Linux kernel extra modules for version 5.4.0 on 64 bit x86 SMP ii linux-modules-5.4.0-105-generic 5.4.0-105.119 amd64 Linux kernel extra modules for version 5.4.0 on 64 bit x86 SMP ii linux-modules-extra-5.4.0-104-generic 5.4.0-104.118 amd64 Linux kernel extra modules for version 5.4.0 on 64 bit x86 SMP ii linux-modules-extra-5.4.0-105-generic 5.4.0-105.119 amd64 Linux kernel extra modules for version 5.4.0 on 64 bit x86 SMP ii mlnx-ofed-kernel-dkms 5.4-OFED.5.4.3.0.3.1 all DKMS support for mlnx-ofed kernel modules ii mlnx-ofed-kernel-utils 5.4-OFED.5.4.3.0.3.1 amd64 Userspace tools to restart and tune mlnx-ofed kernel modules ii mlnx-tools 5.2.0-0.54303 amd64 Userspace tools to restart and tune MLNX_OFED kernel modules ii nvidia-kernel-common-470 470.103.01-0ubuntu0.20.04.1 amd64 Shared files used with the kernel module ii nvidia-kernel-source-470 470.103.01-0ubuntu0.20.04.1 amd64 NVIDIA kernel source package ii nvidia-peer-memory 1.2-0 all nvidia peer memory kernel module. ii nvidia-peer-memory-dkms 1.2-0 all DKMS support for nvidia-peer-memory kernel modules ii rsyslog 8.2001.0-1ubuntu1.1 amd64 reliable system and kernel logging daemon ii srp-dkms 5.4-OFED.5.4.3.0.1.1 all DKMS support fo srp kernel modulesroot@bm-dev-001:~# dpkg -l | egrep -i "kernel | mlnx" root@bm-dev-001:~# dpkg -l | egrep -i "kernel | nvidia" root@bm-dev-001:~# dpkg -l | egrep -i "kernel | linux-image" ii crash 7.2.8-1ubuntu1.20.04.1 amd64 kernel debugging utility, allowing gdb like syntax ii dkms 2.8.1-5ubuntu2 all Dynamic Kernel Module Support Framework ii dmeventd 2:1.02.167-1ubuntu1 amd64 Linux Kernel Device Mapper event daemon ii dmsetup 2:1.02.167-1ubuntu1 amd64 Linux Kernel Device Mapper userspace library ii iser-dkms 5.4-OFED.5.4.3.0.1.1 all DKMS support fo iser kernel modules ii isert-dkms 5.4-OFED.5.4.3.0.1.1 all DKMS support fo isert kernel modules ii kernel-mft-dkms 4.17.2-12 all DKMS support for kernel-mft kernel modules ii kmod 27-1ubuntu2 amd64 tools for managing Linux kernel modules ii knem 1.1.4.90mlnx1-OFED.5.1.2.5.0.1 amd64 userspace tools for the KNEM kernel module ii knem-dkms 1.1.4.90mlnx1-OFED.5.1.2.5.0.1 all DKMS support for mlnx-ofed kernel modules ii libaio1:amd64 0.3.112-5 amd64 Linux kernel AIO access library - shared library ii libdevmapper-event1.02.1:amd64 2:1.02.167-1ubuntu1 amd64 Linux Kernel Device Mapper event support library ii libdevmapper1.02.1:amd64 2:1.02.167-1ubuntu1 amd64 Linux Kernel Device Mapper userspace library ii libdrm-amdgpu1:amd64 2.4.107-8ubuntu1~20.04.2 amd64 Userspace interface to amdgpu-specific kernel DRM services -- runtime ii libdrm-common 2.4.107-8ubuntu1~20.04.2 all Userspace interface to kernel DRM services -- common files ii libdrm-intel1:amd64 2.4.107-8ubuntu1~20.04.2 amd64 Userspace interface to intel-specific kernel DRM services -- runtime ii libdrm-nouveau2:amd64 2.4.107-8ubuntu1~20.04.2 amd64 Userspace interface to nouveau-specific kernel DRM services -- runtime ii libdrm-radeon1:amd64 2.4.107-8ubuntu1~20.04.2 amd64 Userspace interface to radeon-specific kernel DRM services -- runtime ii libdrm2:amd64 2.4.107-8ubuntu1~20.04.2 amd64 Userspace interface to kernel DRM services -- runtime ii linux-firmware 1.187.29 all Firmware for Linux kernel drivers hi linux-generic 5.4.0.105.109 amd64 Complete Generic Linux kernel and headers ii linux-headers-5.4.0-104 5.4.0-104.118 all Header files related to Linux kernel version 5.4.0 ii linux-headers-5.4.0-104-generic 5.4.0-104.118 amd64 Linux kernel headers for version 5.4.0 on 64 bit x86 SMP ii linux-headers-5.4.0-105 5.4.0-105.119 all Header files related to Linux kernel version 5.4.0 ii linux-headers-5.4.0-105-generic 5.4.0-105.119 amd64 Linux kernel headers for version 5.4.0 on 64 bit x86 SMP hi linux-headers-generic 5.4.0.105.109 amd64 Generic Linux kernel headers ii linux-image-5.4.0-104-generic 5.4.0-104.118 amd64 Signed kernel image generic ii linux-image-5.4.0-105-generic 5.4.0-105.119 amd64 Signed kernel image generic hi linux-image-generic 5.4.0.105.109 amd64 Generic Linux kernel image ii linux-libc-dev:amd64 5.4.0-105.119 amd64 Linux Kernel Headers for development ii linux-modules-5.4.0-104-generic 5.4.0-104.118 amd64 Linux kernel extra modules for version 5.4.0 on 64 bit x86 SMP ii linux-modules-5.4.0-105-generic 5.4.0-105.119 amd64 Linux kernel extra modules for version 5.4.0 on 64 bit x86 SMP ii linux-modules-extra-5.4.0-104-generic 5.4.0-104.118 amd64 Linux kernel extra modules for version 5.4.0 on 64 bit x86 SMP ii linux-modules-extra-5.4.0-105-generic 5.4.0-105.119 amd64 Linux kernel extra modules for version 5.4.0 on 64 bit x86 SMP ii mlnx-ofed-kernel-dkms 5.4-OFED.5.4.3.0.3.1 all DKMS support for mlnx-ofed kernel modules ii mlnx-ofed-kernel-utils 5.4-OFED.5.4.3.0.3.1 amd64 Userspace tools to restart and tune mlnx-ofed kernel modules ii mlnx-tools 5.2.0-0.54303 amd64 Userspace tools to restart and tune MLNX_OFED kernel modules ii nvidia-kernel-common-470 470.103.01-0ubuntu0.20.04.1 amd64 Shared files used with the kernel module ii nvidia-kernel-source-470 470.103.01-0ubuntu0.20.04.1 amd64 NVIDIA kernel source package ii nvidia-peer-memory 1.2-0 all nvidia peer memory kernel module. ii nvidia-peer-memory-dkms 1.2-0 all DKMS support for nvidia-peer-memory kernel modules ii rsyslog 8.2001.0-1ubuntu1.1 amd64 reliable system and kernel logging daemon ii srp-dkms 5.4-OFED.5.4.3.0.1.1 all DKMS support fo srp kernel modulesCode block. Kernel, IB related package version check - Use the apt-mark command to hold the package update.Color mode
# apt-mark hold <package name># apt-mark hold <package name>Code block. Package update hold
Intel E810 Driver Update
Check the version of the Intel E810 driver and update it to the recommended version.
Notice
- Server manufacturer Intel E810 driver recommended version: 1.15.4
- Driver (ice-1.15.4.tar.gz) download
The driver update method is as follows.
- Move the basic driver tar file to the desired directory.
Example: /home/username/ice or /usr/local/src/ice
Untar / unzip the Archiver file.
- x.x.x is the version number of the driver tar file.Color mode
tar zxf ice-x.x.x.tar.gztar zxf ice-x.x.x.tar.gzCode block. Unzip file
- x.x.x is the version number of the driver tar file.
Change to the driver src directory.
- x.x.x is the version number of the driver tar file.Color mode
cd ice-x.x.x/src/cd ice-x.x.x/src/Code block. Directory change
- x.x.x is the version number of the driver tar file.
Compile the driver module.
Color modemake installmake installCode Block. Driver Module Compile After the update is complete, check the version.
Color modelsmod | grep ice modinfo ice | grep versionlsmod | grep ice modinfo ice | grep versionCode Block. Version Check
NVIDIA driver check
Note
nvidia-smi topo, IB nv_peer_mem status checkTo check the NVIDIA driver (nvidia-smi topo, IB nv_peer_mem status) and inspect the IaaS HW level, follow the next procedure.
Check the GPU driver and HW status.
Color modeuser@bm-dev-001:~$ nvidia-smi topo -m GPU0 GPU1 GPU2 GPU3 GPU4 GPU5 GPU6 GPU7 mlx5_0 mlx5_1 mlx5_2 mlx5_3 CPU Affinity NUMA Affinity GPU0 X NV12 NV12 NV12 NV12 NV12 NV12 NV12 SYS PXB SYS SYS 48-63 3 GPU1 NV12 X NV12 NV12 NV12 NV12 NV12 NV12 SYS PXB SYS SYS 48-63 3 GPU2 NV12 NV12 X NV12 NV12 NV12 NV12 NV12 PXB SYS SYS SYS 16-31 1 GPU3 NV12 NV12 NV12 X NV12 NV12 NV12 NV12 PXB SYS SYS SYS 16-31 1 GPU4 NV12 NV12 NV12 NV12 X NV12 NV12 NV12 SYS SYS SYS PXB 112-127 7 GPU5 NV12 NV12 NV12 NV12 NV12 X NV12 NV12 SYS SYS SYS PXB 112-127 7 GPU6 NV12 NV12 NV12 NV12 NV12 NV12 X NV12 SYS SYS PXB SYS 80-95 5 GPU7 NV12 NV12 NV12 NV12 NV12 NV12 NV12 X SYS SYS PXB SYS 80-95 5 mlx5_0 SYS SYS PXB PXB SYS SYS SYS SYS X SYS SYS SYS mlx5_1 PXB PXB SYS SYS SYS SYS SYS SYS SYS X SYS SYS mlx5_2 SYS SYS SYS SYS SYS SYS PXB PXB SYS SYS X SYS mlx5_3 SYS SYS SYS SYS PXB PXB SYS SYS SYS SYS SYS X Legend: X = Self SYS = Connection traversing PCIe as well as the SMP interconnect between NUMA nodes (e.g., QPI/UPI) NODE = Connection traversing PCIe as well as the interconnect between PCIe Host Bridges within a NUMA node PHB = Connection traversing PCIe as well as a PCIe Host Bridge (typically the CPU) PXB = Connection traversing multiple PCIe bridges (without traversing the PCIe Host Bridge) PIX = Connection traversing at most a single PCIe bridge NV# = Connection traversing a bonded set of # NVLinksuser@bm-dev-001:~$ nvidia-smi topo -m GPU0 GPU1 GPU2 GPU3 GPU4 GPU5 GPU6 GPU7 mlx5_0 mlx5_1 mlx5_2 mlx5_3 CPU Affinity NUMA Affinity GPU0 X NV12 NV12 NV12 NV12 NV12 NV12 NV12 SYS PXB SYS SYS 48-63 3 GPU1 NV12 X NV12 NV12 NV12 NV12 NV12 NV12 SYS PXB SYS SYS 48-63 3 GPU2 NV12 NV12 X NV12 NV12 NV12 NV12 NV12 PXB SYS SYS SYS 16-31 1 GPU3 NV12 NV12 NV12 X NV12 NV12 NV12 NV12 PXB SYS SYS SYS 16-31 1 GPU4 NV12 NV12 NV12 NV12 X NV12 NV12 NV12 SYS SYS SYS PXB 112-127 7 GPU5 NV12 NV12 NV12 NV12 NV12 X NV12 NV12 SYS SYS SYS PXB 112-127 7 GPU6 NV12 NV12 NV12 NV12 NV12 NV12 X NV12 SYS SYS PXB SYS 80-95 5 GPU7 NV12 NV12 NV12 NV12 NV12 NV12 NV12 X SYS SYS PXB SYS 80-95 5 mlx5_0 SYS SYS PXB PXB SYS SYS SYS SYS X SYS SYS SYS mlx5_1 PXB PXB SYS SYS SYS SYS SYS SYS SYS X SYS SYS mlx5_2 SYS SYS SYS SYS SYS SYS PXB PXB SYS SYS X SYS mlx5_3 SYS SYS SYS SYS PXB PXB SYS SYS SYS SYS SYS X Legend: X = Self SYS = Connection traversing PCIe as well as the SMP interconnect between NUMA nodes (e.g., QPI/UPI) NODE = Connection traversing PCIe as well as the interconnect between PCIe Host Bridges within a NUMA node PHB = Connection traversing PCIe as well as a PCIe Host Bridge (typically the CPU) PXB = Connection traversing multiple PCIe bridges (without traversing the PCIe Host Bridge) PIX = Connection traversing at most a single PCIe bridge NV# = Connection traversing a bonded set of # NVLinksCode Block. GPU Driver and HW Status Check Check the NVSwitch HW status.
Color modeuser@bm-dev-001:~$ nvidia-smi nvlink --status GPU 0: NVIDIA A100-SXM4-80GB (UUID: GPU-2c0d1d6b-e348-55fc-44cf-cd65a954b36c) Link 0: 25 GB/s Link 1: 25 GB/s Link 2: 25 GB/s Link 3: 25 GB/s Link 4: 25 GB/s Link 5: 25 GB/s Link 6: 25 GB/s Link 7: 25 GB/s Link 8: 25 GB/s Link 9: 25 GB/s Link 10: 25 GB/s Link 11: 25 GB/s GPU 1: NVIDIA A100-SXM4-80GB (UUID: GPU-96f429d8-893a-a9ea-deca-feffd90669e9) Link 0: 25 GB/s Link 1: 25 GB/s Link 2: 25 GB/s Link 3: 25 GB/s Link 4: 25 GB/s Link 5: 25 GB/s Link 6: 25 GB/s Link 7: 25 GB/s Link 8: 25 GB/s Link 9: 25 GB/s Link 10: 25 GB/s Link 11: 25 GB/s GPU 2: NVIDIA A100-SXM4-80GB (UUID: GPU-2e601952-b442-b757-a035-725cd320f589) Link 0: 25 GB/s Link 1: 25 GB/s Link 2: 25 GB/s Link 3: 25 GB/s Link 4: 25 GB/s Link 5: 25 GB/s Link 6: 25 GB/s Link 7: 25 GB/s Link 8: 25 GB/s Link 9: 25 GB/s Link 10: 25 GB/s Link 11: 25 GB/s GPU 3: NVIDIA A100-SXM4-80GB (UUID: GPU-bcbfd885-a9f8-ec8c-045b-c521472b4fed) Link 0: 25 GB/s Link 1: 25 GB/s Link 2: 25 GB/s Link 3: 25 GB/s Link 4: 25 GB/s Link 5: 25 GB/s Link 6: 25 GB/s Link 7: 25 GB/s Link 8: 25 GB/s Link 9: 25 GB/s Link 10: 25 GB/s Link 11: 25 GB/s GPU 4: NVIDIA A100-SXM4-80GB (UUID: GPU-30273090-2d78-fc7a-a360-ec5f871dd488) Link 0: 25 GB/s Link 1: 25 GB/s Link 2: 25 GB/s Link 3: 25 GB/s Link 4: 25 GB/s Link 5: 25 GB/s Link 6: 25 GB/s Link 7: 25 GB/s Link 8: 25 GB/s Link 9: 25 GB/s Link 10: 25 GB/s Link 11: 25 GB/s GPU 5: NVIDIA A100-SXM4-80GB (UUID: GPU-5ce7ef61-56dd-fb18-aa7c-be610c8d51c3) Link 0: 25 GB/s Link 1: 25 GB/s Link 2: 25 GB/s Link 3: 25 GB/s Link 4: 25 GB/s Link 5: 25 GB/s Link 6: 25 GB/s Link 7: 25 GB/s Link 8: 25 GB/s Link 9: 25 GB/s Link 10: 25 GB/s Link 11: 25 GB/s GPU 6: NVIDIA A100-SXM4-80GB (UUID: GPU-740a527b-b286-8b85-35eb-b6b41c0bb6d7) Link 0: 25 GB/s Link 1: 25 GB/s Link 2: 25 GB/s Link 3: 25 GB/s Link 4: 25 GB/s Link 5: 25 GB/s Link 6: 25 GB/s Link 7: 25 GB/s Link 8: 25 GB/s Link 9: 25 GB/s Link 10: 25 GB/s Link 11: 25 GB/s GPU 7: NVIDIA A100-SXM4-80GB (UUID: GPU-1fb6de95-60f6-dbf2-ffca-f7680577e37c) Link 0: 25 GB/s Link 1: 25 GB/s Link 2: 25 GB/s Link 3: 25 GB/s Link 4: 25 GB/s Link 5: 25 GB/s Link 6: 25 GB/s Link 7: 25 GB/s Link 8: 25 GB/s Link 9: 25 GB/s Link 10: 25 GB/s Link 11: 25 GB/suser@bm-dev-001:~$ nvidia-smi nvlink --status GPU 0: NVIDIA A100-SXM4-80GB (UUID: GPU-2c0d1d6b-e348-55fc-44cf-cd65a954b36c) Link 0: 25 GB/s Link 1: 25 GB/s Link 2: 25 GB/s Link 3: 25 GB/s Link 4: 25 GB/s Link 5: 25 GB/s Link 6: 25 GB/s Link 7: 25 GB/s Link 8: 25 GB/s Link 9: 25 GB/s Link 10: 25 GB/s Link 11: 25 GB/s GPU 1: NVIDIA A100-SXM4-80GB (UUID: GPU-96f429d8-893a-a9ea-deca-feffd90669e9) Link 0: 25 GB/s Link 1: 25 GB/s Link 2: 25 GB/s Link 3: 25 GB/s Link 4: 25 GB/s Link 5: 25 GB/s Link 6: 25 GB/s Link 7: 25 GB/s Link 8: 25 GB/s Link 9: 25 GB/s Link 10: 25 GB/s Link 11: 25 GB/s GPU 2: NVIDIA A100-SXM4-80GB (UUID: GPU-2e601952-b442-b757-a035-725cd320f589) Link 0: 25 GB/s Link 1: 25 GB/s Link 2: 25 GB/s Link 3: 25 GB/s Link 4: 25 GB/s Link 5: 25 GB/s Link 6: 25 GB/s Link 7: 25 GB/s Link 8: 25 GB/s Link 9: 25 GB/s Link 10: 25 GB/s Link 11: 25 GB/s GPU 3: NVIDIA A100-SXM4-80GB (UUID: GPU-bcbfd885-a9f8-ec8c-045b-c521472b4fed) Link 0: 25 GB/s Link 1: 25 GB/s Link 2: 25 GB/s Link 3: 25 GB/s Link 4: 25 GB/s Link 5: 25 GB/s Link 6: 25 GB/s Link 7: 25 GB/s Link 8: 25 GB/s Link 9: 25 GB/s Link 10: 25 GB/s Link 11: 25 GB/s GPU 4: NVIDIA A100-SXM4-80GB (UUID: GPU-30273090-2d78-fc7a-a360-ec5f871dd488) Link 0: 25 GB/s Link 1: 25 GB/s Link 2: 25 GB/s Link 3: 25 GB/s Link 4: 25 GB/s Link 5: 25 GB/s Link 6: 25 GB/s Link 7: 25 GB/s Link 8: 25 GB/s Link 9: 25 GB/s Link 10: 25 GB/s Link 11: 25 GB/s GPU 5: NVIDIA A100-SXM4-80GB (UUID: GPU-5ce7ef61-56dd-fb18-aa7c-be610c8d51c3) Link 0: 25 GB/s Link 1: 25 GB/s Link 2: 25 GB/s Link 3: 25 GB/s Link 4: 25 GB/s Link 5: 25 GB/s Link 6: 25 GB/s Link 7: 25 GB/s Link 8: 25 GB/s Link 9: 25 GB/s Link 10: 25 GB/s Link 11: 25 GB/s GPU 6: NVIDIA A100-SXM4-80GB (UUID: GPU-740a527b-b286-8b85-35eb-b6b41c0bb6d7) Link 0: 25 GB/s Link 1: 25 GB/s Link 2: 25 GB/s Link 3: 25 GB/s Link 4: 25 GB/s Link 5: 25 GB/s Link 6: 25 GB/s Link 7: 25 GB/s Link 8: 25 GB/s Link 9: 25 GB/s Link 10: 25 GB/s Link 11: 25 GB/s GPU 7: NVIDIA A100-SXM4-80GB (UUID: GPU-1fb6de95-60f6-dbf2-ffca-f7680577e37c) Link 0: 25 GB/s Link 1: 25 GB/s Link 2: 25 GB/s Link 3: 25 GB/s Link 4: 25 GB/s Link 5: 25 GB/s Link 6: 25 GB/s Link 7: 25 GB/s Link 8: 25 GB/s Link 9: 25 GB/s Link 10: 25 GB/s Link 11: 25 GB/sCode block. NVSwitch HW status check Check the InfiniBand(IB) HCA card HW status and Link.
Color modeuser@bm-dev-001:~$ ibdev2netdev -v cat: /sys/class/infiniband/mlx5_0/device/vpd: Permission denied 0000:45:00.0 mlx5_0 (MT4123 - ) fw 20.29.1016 port 1 (ACTIVE) ==> ibs18 (Down) cat: /sys/class/infiniband/mlx5_1/device/vpd: Permission denied 0000:0e:00.0 mlx5_1 (MT4123 - ) fw 20.29.1016 port 1 (ACTIVE) ==> ibs17 (Down) cat: /sys/class/infiniband/mlx5_2/device/vpd: Permission denied 0000:c5:00.0 mlx5_2 (MT4123 - ) fw 20.29.1016 port 1 (ACTIVE) ==> ibs20 (Down) cat: /sys/class/infiniband/mlx5_3/device/vpd: Permission denied 0000:85:00.0 mlx5_3 (MT4123 - ) fw 20.29.1016 port 1 (ACTIVE) ==> ibs19 (Down) user@bm-dev-001:~$ root@bm-dev-001:~# ibstat CA 'mlx5_0' CA type: MT4123 Number of ports: 1 Firmware version: 20.29.1016 Hardware version: 0 Node GUID: 0x88e9a4ffff5060ac System image GUID: 0x88e9a4ffff5060ac Port 1: State: Active Physical state: LinkUp Rate: 200 Base lid: 8 LMC: 0 SM lid: 1 Capability mask: 0x2651e848 Port GUID: 0x88e9a4ffff5060ac Link layer: InfiniBand CA 'mlx5_1' CA type: MT4123 Number of ports: 1 Firmware version: 20.29.1016 Hardware version: 0 Node GUID: 0x88e9a4ffff504080 System image GUID: 0x88e9a4ffff504080 Port 1: State: Active Physical state: LinkUp Rate: 200 Base lid: 5 LMC: 0 SM lid: 1 Capability mask: 0x2651e848 Port GUID: 0x88e9a4ffff504080 Link layer: InfiniBand CA 'mlx5_2' CA type: MT4123 Number of ports: 1 Firmware version: 20.29.1016 Hardware version: 0 Node GUID: 0x88e9a4ffff505038 System image GUID: 0x88e9a4ffff505038 Port 1: State: Active Physical state: LinkUp Rate: 200 Base lid: 2 LMC: 0 SM lid: 1 Capability mask: 0x2651e848 Port GUID: 0x88e9a4ffff505038 Link layer: InfiniBand CA 'mlx5_3' CA type: MT4123 Number of ports: 1 Firmware version: 20.29.1016 Hardware version: 0 Node GUID: 0x88e9a4ffff504094 System image GUID: 0x88e9a4ffff504094 Port 1: State: Active Physical state: LinkUp Rate: 200 Base lid: 7 LMC: 0 SM lid: 1 Capability mask: 0x2651e848 Port GUID: 0x88e9a4ffff504094 Link layer: InfiniBanduser@bm-dev-001:~$ ibdev2netdev -v cat: /sys/class/infiniband/mlx5_0/device/vpd: Permission denied 0000:45:00.0 mlx5_0 (MT4123 - ) fw 20.29.1016 port 1 (ACTIVE) ==> ibs18 (Down) cat: /sys/class/infiniband/mlx5_1/device/vpd: Permission denied 0000:0e:00.0 mlx5_1 (MT4123 - ) fw 20.29.1016 port 1 (ACTIVE) ==> ibs17 (Down) cat: /sys/class/infiniband/mlx5_2/device/vpd: Permission denied 0000:c5:00.0 mlx5_2 (MT4123 - ) fw 20.29.1016 port 1 (ACTIVE) ==> ibs20 (Down) cat: /sys/class/infiniband/mlx5_3/device/vpd: Permission denied 0000:85:00.0 mlx5_3 (MT4123 - ) fw 20.29.1016 port 1 (ACTIVE) ==> ibs19 (Down) user@bm-dev-001:~$ root@bm-dev-001:~# ibstat CA 'mlx5_0' CA type: MT4123 Number of ports: 1 Firmware version: 20.29.1016 Hardware version: 0 Node GUID: 0x88e9a4ffff5060ac System image GUID: 0x88e9a4ffff5060ac Port 1: State: Active Physical state: LinkUp Rate: 200 Base lid: 8 LMC: 0 SM lid: 1 Capability mask: 0x2651e848 Port GUID: 0x88e9a4ffff5060ac Link layer: InfiniBand CA 'mlx5_1' CA type: MT4123 Number of ports: 1 Firmware version: 20.29.1016 Hardware version: 0 Node GUID: 0x88e9a4ffff504080 System image GUID: 0x88e9a4ffff504080 Port 1: State: Active Physical state: LinkUp Rate: 200 Base lid: 5 LMC: 0 SM lid: 1 Capability mask: 0x2651e848 Port GUID: 0x88e9a4ffff504080 Link layer: InfiniBand CA 'mlx5_2' CA type: MT4123 Number of ports: 1 Firmware version: 20.29.1016 Hardware version: 0 Node GUID: 0x88e9a4ffff505038 System image GUID: 0x88e9a4ffff505038 Port 1: State: Active Physical state: LinkUp Rate: 200 Base lid: 2 LMC: 0 SM lid: 1 Capability mask: 0x2651e848 Port GUID: 0x88e9a4ffff505038 Link layer: InfiniBand CA 'mlx5_3' CA type: MT4123 Number of ports: 1 Firmware version: 20.29.1016 Hardware version: 0 Node GUID: 0x88e9a4ffff504094 System image GUID: 0x88e9a4ffff504094 Port 1: State: Active Physical state: LinkUp Rate: 200 Base lid: 7 LMC: 0 SM lid: 1 Capability mask: 0x2651e848 Port GUID: 0x88e9a4ffff504094 Link layer: InfiniBandCode block. InfiniBand(IB) HCA card HW status and Link check
IB bandwidth communication check
To check the IB bandwidth communication status (ib_send_bw) and inspect the IaaS HW level, follow these steps.
Check the name of the IB HCA interface.
Color modeuser@bm-dev-001:~$ ibdev2netdev mlx5_0 port 1 ==> ibs18 (Down) mlx5_1 port 1 ==> ibs17 (Down) mlx5_2 port 1 ==> ibs20 (Down) mlx5_3 port 1 ==> ibs19 (Down)user@bm-dev-001:~$ ibdev2netdev mlx5_0 port 1 ==> ibs18 (Down) mlx5_1 port 1 ==> ibs17 (Down) mlx5_2 port 1 ==> ibs20 (Down) mlx5_3 port 1 ==> ibs19 (Down)Code block. Check the name of IB HCA interface Check the HCA interface that can communicate with IB Switch#1.
Color modemlx5_0 port 1 ==> ibs18 (Down) mlx5_2 port 1 ==> ibs20 (Down)mlx5_0 port 1 ==> ibs18 (Down) mlx5_2 port 1 ==> ibs20 (Down)Code Block. HCA Interface Check Check the HCA interface that can communicate with IB Switch#2.
Color modemlx5_1 port 1 ==> ibs17 (Down) mlx5_3 port 1 ==> ibs19 (Down)mlx5_1 port 1 ==> ibs17 (Down) mlx5_3 port 1 ==> ibs19 (Down)Code Block. HCA Interface Check Use SERVER Side commands to check the communication status.
Client Sidecommand is entered secondarily for mutual communicationColor modeuser@bm-dev-001:~$ ib_send_bw -d mlx5_3 -i 1 –F ************************************ * Waiting for client to connect... * ************************************ --------------------------------------------------------------------------------------- Send BW Test Dual-port : OFF Device : mlx5_3 Number of qps : 1 Transport type : IB Connection type : RC Using SRQ : OFF PCIe relax order: ON ibv_wr* API : ON RX depth : 512 CQ Moderation : 1 Mtu : 4096[B] Link type : IB Max inline data : 0[B] rdma_cm QPs : OFF Data ex. method : Ethernet --------------------------------------------------------------------------------------- local address: LID 0x07 QPN 0x002e PSN 0xa86622 remote address: LID 0x0a QPN 0x002d PSN 0xfc58dd --------------------------------------------------------------------------------------- #bytes #iterations BW peak[MB/sec] BW average[MB/sec] MsgRate[Mpps] 65536 1000 0.00 19827.40 0.317238 ---------------------------------------------------------------------------------------user@bm-dev-001:~$ ib_send_bw -d mlx5_3 -i 1 –F ************************************ * Waiting for client to connect... * ************************************ --------------------------------------------------------------------------------------- Send BW Test Dual-port : OFF Device : mlx5_3 Number of qps : 1 Transport type : IB Connection type : RC Using SRQ : OFF PCIe relax order: ON ibv_wr* API : ON RX depth : 512 CQ Moderation : 1 Mtu : 4096[B] Link type : IB Max inline data : 0[B] rdma_cm QPs : OFF Data ex. method : Ethernet --------------------------------------------------------------------------------------- local address: LID 0x07 QPN 0x002e PSN 0xa86622 remote address: LID 0x0a QPN 0x002d PSN 0xfc58dd --------------------------------------------------------------------------------------- #bytes #iterations BW peak[MB/sec] BW average[MB/sec] MsgRate[Mpps] 65536 1000 0.00 19827.40 0.317238 ---------------------------------------------------------------------------------------Code Block. Communication Status Check
Use the
CLIENT Sidecommand to check the communication status.SERVER Sidecommand is entered first for mutual communicationColor moderoot@bm-dev-003:~# ib_send_bw -d mlx5_3 -i 1 -F <SERVER Side IP> --------------------------------------------------------------------------------------- Send BW Test Dual-port : OFF Device : mlx5_3 Number of qps : 1 Transport type : IB Connection type : RC Using SRQ : OFF PCIe relax order: ON ibv_wr* API : ON TX depth : 128 CQ Moderation : 1 Mtu : 4096[B] Link type : IB Max inline data : 0[B] rdma_cm QPs : OFF Data ex. method : Ethernet --------------------------------------------------------------------------------------- local address: LID 0x0a QPN 0x002a PSN 0x98a48e remote address: LID 0x07 QPN 0x002c PSN 0xe68304 --------------------------------------------------------------------------------------- #bytes #iterations BW peak[MB/sec] BW average[MB/sec] MsgRate[Mpps] 65536 1000 19008.49 19006.37 0.304102 ---------------------------------------------------------------------------------------root@bm-dev-003:~# ib_send_bw -d mlx5_3 -i 1 -F <SERVER Side IP> --------------------------------------------------------------------------------------- Send BW Test Dual-port : OFF Device : mlx5_3 Number of qps : 1 Transport type : IB Connection type : RC Using SRQ : OFF PCIe relax order: ON ibv_wr* API : ON TX depth : 128 CQ Moderation : 1 Mtu : 4096[B] Link type : IB Max inline data : 0[B] rdma_cm QPs : OFF Data ex. method : Ethernet --------------------------------------------------------------------------------------- local address: LID 0x0a QPN 0x002a PSN 0x98a48e remote address: LID 0x07 QPN 0x002c PSN 0xe68304 --------------------------------------------------------------------------------------- #bytes #iterations BW peak[MB/sec] BW average[MB/sec] MsgRate[Mpps] 65536 1000 19008.49 19006.37 0.304102 ---------------------------------------------------------------------------------------Code Block. Communication Status Check
Check IB Service Related Kernel Modules
Check the IB service-related kernel modules (lsmod) to inspect the IaaS HW level.
Color mode
user@bm-dev-001:~$ lsmod | grep nv_peer_mem
nv_peer_mem 16384 0
ib_core 315392 9 rdma_cm,ib_ipoib,nv_peer_mem,iw_cm,ib_umad,rdma_ucm,ib_uverbs,mlx5_ib,ib_cm
nvidia 35315712 156 nvidia_uvm,nv_peer_mem,nvidia_modesetuser@bm-dev-001:~$ lsmod | grep nv_peer_mem
nv_peer_mem 16384 0
ib_core 315392 9 rdma_cm,ib_ipoib,nv_peer_mem,iw_cm,ib_umad,rdma_ucm,ib_uverbs,mlx5_ib,ib_cm
nvidia 35315712 156 nvidia_uvm,nv_peer_mem,nvidia_modesetColor mode
user@bm-dev-001:~$ service nv_peer_mem status
nv_peer_mem.service - LSB: Activates/Deactivates nv_peer_mem to \ start at boot time.
Loaded: loaded (/etc/init.d/nv_peer_mem; generated)
Active: active (exited) since Mon 2023-03-13 16:21:33 KST; 2 days ago
Docs: man:systemd-sysv-generator(8)
Process: 4913 ExecStart=/etc/init.d/nv_peer_mem start (code=exited, status=0/SUCCESS)user@bm-dev-001:~$ service nv_peer_mem status
nv_peer_mem.service - LSB: Activates/Deactivates nv_peer_mem to \ start at boot time.
Loaded: loaded (/etc/init.d/nv_peer_mem; generated)
Active: active (exited) since Mon 2023-03-13 16:21:33 KST; 2 days ago
Docs: man:systemd-sysv-generator(8)
Process: 4913 ExecStart=/etc/init.d/nv_peer_mem start (code=exited, status=0/SUCCESS)Color mode
user@bm-dev-001:~$ lsmod | grep ib
libiscsi_tcp 32768 1 iscsi_tcp
libiscsi 57344 2 libiscsi_tcp,iscsi_tcp
scsi_transport_iscsi 110592 4 libiscsi_tcp,iscsi_tcp,libiscsi
ib_ipoib 131072 0
ib_cm 57344 2 rdma_cm,ib_ipoib
ib_umad 24576 8
mlx5_ib 380928 0
ib_uverbs 135168 18 rdma_ucm,mlx5_ib
ib_core 315392 9 rdma_cm,ib_ipoib,nv_peer_mem,iw_cm,ib_umad,rdma_ucm,ib_uverbs,mlx5_ib,ib_cm
libcrc32c 16384 2 btrfs,raid456
mlx5_core 1458176 1 mlx5_ib
auxiliary 16384 2 mlx5_ib,mlx5_core
mlx_compat 65536 12 rdma_cm,ib_ipoib,mlxdevm,iw_cm,auxiliary,ib_umad,ib_core,rdma_ucm,ib_uverbs,mlx5_ib,ib_cm,mlx5_coreuser@bm-dev-001:~$ lsmod | grep ib
libiscsi_tcp 32768 1 iscsi_tcp
libiscsi 57344 2 libiscsi_tcp,iscsi_tcp
scsi_transport_iscsi 110592 4 libiscsi_tcp,iscsi_tcp,libiscsi
ib_ipoib 131072 0
ib_cm 57344 2 rdma_cm,ib_ipoib
ib_umad 24576 8
mlx5_ib 380928 0
ib_uverbs 135168 18 rdma_ucm,mlx5_ib
ib_core 315392 9 rdma_cm,ib_ipoib,nv_peer_mem,iw_cm,ib_umad,rdma_ucm,ib_uverbs,mlx5_ib,ib_cm
libcrc32c 16384 2 btrfs,raid456
mlx5_core 1458176 1 mlx5_ib
auxiliary 16384 2 mlx5_ib,mlx5_core
mlx_compat 65536 12 rdma_cm,ib_ipoib,mlxdevm,iw_cm,auxiliary,ib_umad,ib_core,rdma_ucm,ib_uverbs,mlx5_ib,ib_cm,mlx5_coreStorage Physical Disk Resources and Multi-Path Check
Check the IaaS HW level by checking the storage physical disk resources and Multi-Path.
Color mode
root@bm-dev-002:/tmp# fdisk –lroot@bm-dev-002:/tmp# fdisk –lColor mode
root@bm-dev-002:/tmp# multipath –llroot@bm-dev-002:/tmp# multipath –llMulti-node GPU Cluster new deployment after checking Service Network
Use the following command to check if the MII Status of Bonding and Slave Interface is up.
command
Color moderoot@mngc-001:~# cat /proc/net/bonding/bond-srv Ethernet Channel Bonding Driver: v5.15.0-25-genericroot@mngc-001:~# cat /proc/net/bonding/bond-srv Ethernet Channel Bonding Driver: v5.15.0-25-genericCode Block. Service Network Check Command confirmation result
Color modeBonding Mode: fault-tolerance (active-backup) Primary Slave: None Currently Active Slave: ens9f0 MII Status: up MII Polling Interval (ms): 100 Up Delay (ms): 0 Down Delay (ms): 0 Peer Notification Delay (ms): 0 Slave Interface: ens9f0 MII Status: up Speed: 100000 Mbps Duplex: full Link Failure Count: 0 Permanent HW addr: 30:3e:a7:02:35:70 Slave queue ID: 0 Slave Interface: ens11f0 MII Status: up Speed: 100000 Mbps Duplex: full Link Failure Count: 0 Permanent HW addr: 30:3e:a7:02:2f:e8 Slave queue ID: 0Bonding Mode: fault-tolerance (active-backup) Primary Slave: None Currently Active Slave: ens9f0 MII Status: up MII Polling Interval (ms): 100 Up Delay (ms): 0 Down Delay (ms): 0 Peer Notification Delay (ms): 0 Slave Interface: ens9f0 MII Status: up Speed: 100000 Mbps Duplex: full Link Failure Count: 0 Permanent HW addr: 30:3e:a7:02:35:70 Slave queue ID: 0 Slave Interface: ens11f0 MII Status: up Speed: 100000 Mbps Duplex: full Link Failure Count: 0 Permanent HW addr: 30:3e:a7:02:2f:e8 Slave queue ID: 0Code Block. Service Network Check Command Result
Reference
If some Slave Interface is in a down state, please use the Support Center’s Contact Us to report the abnormal situation and take action.
Multi-node GPU Cluster new deployment after checking Time Server and time synchronization
The OS image has the chrony daemon installed and set to synchronize with the SCP NTP server. Use the following command to check if there are any lines marked with ^* in the MS Name column.
command
Color moderoot@mngc-001:~# chronyc sources -Vroot@mngc-001:~# chronyc sources -VCode Block. chrony daemon installation command confirmation result
Color modeMS Name/IP address Stratum Poll Reach LastRx Last sample =============================================================================== ^+ 198.19.1.53 4 10 377 1040 -16us[ -37us] +/- 9982us ^* 198.19.1.54 4 10 377 312 -367us[ -388us] +/- 13msMS Name/IP address Stratum Poll Reach LastRx Last sample =============================================================================== ^+ 198.19.1.53 4 10 377 1040 -16us[ -37us] +/- 9982us ^* 198.19.1.54 4 10 377 312 -367us[ -388us] +/- 13msCode block. chrony daemon installation check result
GPU MIG/ECC Setting Initialization Check Guide
When applying for a multi-node GPU cluster product, the GPU MIG/ECC setting is initialized. However, to apply the exact setting value, please restart it once at the beginning, and then check and use it according to the inspection guide to see if the setting value is applied.
Reference
- MIG: Multi-Instance GPU
- ECC: Error Correction Code
MIG Setup Initialization
Refer to the following for how to check and initialize MIG settings.
Use the following command to check if the status value of MIG M is Disabled.
command
Color moderoot@bm-dev-001:~#nvidia-smiroot@bm-dev-001:~#nvidia-smiCode Block. MIG M. Initialize Settings confirmation result
Color mode+-----------------------------------------------------------------------------------------+ | NVIDIA-SMI 470.129.06 Driver version: 470.129.06 CUDA Version: 11.4 | |----------------------------------+-----------------------------+------------------------| | GPU Name Persistence-M | Bus-Id Disp.A | Volatile Uncorr. ECC | | Fan Temp Perf Pwr:Usage/Cap | Memory-Usage | GPU-Util Compute M. | | | | MIG M. | |==================================+=============================+========================| | 0 NVIDIA A100-SXM... Off | 00000000:03:00.0 Off | Off | | N/A 29C P0 57W / 400W | 0MiB / 81251MiB | 0% Default | | | | Disabled | +----------------------------------+-----------------------------+------------------------+ | 0 NVIDIA A100-SXM... Off | 00000000:0C:00.0 Off | Off | | N/A 30C P0 58W / 400W | 0MiB / 81251MiB | 18% Default | | | | Disabled | +-----------------------------------------------------------------------------------------++-----------------------------------------------------------------------------------------+ | NVIDIA-SMI 470.129.06 Driver version: 470.129.06 CUDA Version: 11.4 | |----------------------------------+-----------------------------+------------------------| | GPU Name Persistence-M | Bus-Id Disp.A | Volatile Uncorr. ECC | | Fan Temp Perf Pwr:Usage/Cap | Memory-Usage | GPU-Util Compute M. | | | | MIG M. | |==================================+=============================+========================| | 0 NVIDIA A100-SXM... Off | 00000000:03:00.0 Off | Off | | N/A 29C P0 57W / 400W | 0MiB / 81251MiB | 0% Default | | | | Disabled | +----------------------------------+-----------------------------+------------------------+ | 0 NVIDIA A100-SXM... Off | 00000000:0C:00.0 Off | Off | | N/A 30C P0 58W / 400W | 0MiB / 81251MiB | 18% Default | | | | Disabled | +-----------------------------------------------------------------------------------------+Code Block. MIG M. Initialization Setting Check Result If MIG M.’s status value is not Disabled, use the following command to initialize MIG.
Color moderoot@bm-dev-001:~# nvidia-smi -mig 0 root@bm-dev-001:~# nvidia-smi --gpu-resetroot@bm-dev-001:~# nvidia-smi -mig 0 root@bm-dev-001:~# nvidia-smi --gpu-resetCode Block. MIG M. Status Value Initialization
ECC Setting Initialization
Refer to the following for how to check and initialize the ECC settings.
Use the following command to check if the status value of Volatile Uncorr. ECC is Off.
command
Color moderoot@bm-dev-001:~#nvidia-smiroot@bm-dev-001:~#nvidia-smiCode Block. ECC Setting Command confirmation result
Color mode+-----------------------------------------------------------------------------------------+ | NVIDIA-SMI 470.129.06 Driver version: 470.129.06 CUDA Version: 11.4 | |----------------------------------+-----------------------------+------------------------| | GPU Name Persistence-M | Bus-Id Disp.A | Volatile Uncorr. ECC | | Fan Temp Perf Pwr:Usage/Cap | Memory-Usage | GPU-Util Compute M. | | | | MIG M. | |==================================+=============================+========================| | 0 NVIDIA A100-SXM... Off | 00000000:03:00.0 Off | Off | | N/A 29C P0 57W / 400W | 0MiB / 81251MiB | 0% Default | | | | Disabled | +----------------------------------+-----------------------------+------------------------+ | 0 NVIDIA A100-SXM... Off | 00000000:0C:00.0 Off | Off | | N/A 30C P0 61W / 400W | 0MiB / 81251MiB | 18% Default | | | | Disabled | +-----------------------------------------------------------------------------------------++-----------------------------------------------------------------------------------------+ | NVIDIA-SMI 470.129.06 Driver version: 470.129.06 CUDA Version: 11.4 | |----------------------------------+-----------------------------+------------------------| | GPU Name Persistence-M | Bus-Id Disp.A | Volatile Uncorr. ECC | | Fan Temp Perf Pwr:Usage/Cap | Memory-Usage | GPU-Util Compute M. | | | | MIG M. | |==================================+=============================+========================| | 0 NVIDIA A100-SXM... Off | 00000000:03:00.0 Off | Off | | N/A 29C P0 57W / 400W | 0MiB / 81251MiB | 0% Default | | | | Disabled | +----------------------------------+-----------------------------+------------------------+ | 0 NVIDIA A100-SXM... Off | 00000000:0C:00.0 Off | Off | | N/A 30C P0 61W / 400W | 0MiB / 81251MiB | 18% Default | | | | Disabled | +-----------------------------------------------------------------------------------------+Code Block. ECC Setting Check Result Volatile Uncorr. ECC’s status value is On*, please proceed with rebooting.
Volatile Uncorr. ECC status value is not On* or Off, use the following command to initialize ECC. After initialization, reboot and check if the status value is Off.
Color mode
root@bm-dev-001:~# nvidia-smi --ecc-config=0root@bm-dev-001:~# nvidia-smi --ecc-config=05.3 - Release Note
Multi-node GPU Cluster
2025.07.01
FEATURE
New feature added and monitoring linked- You can cancel multiple resources at the same time from the GPU Node list.
- The nodes must use the same DataSet and Cluster Fabric.
- It has been linked with Cloud Monitoring.
- You can check major performance items in real-time in Cloud Monitoring.
2025.02.27
NEW
Multi-node GPU Cluster Service Official Version Release- Multi-node GPU Cluster service has been launched.
- Provides a service that offers physical GPU servers without virtualization for large-scale high-performance AI computing.
6 - Cloud Functions
6.1 - Overview
Service Overview
Cloud Functions is a serverless computing-based FaaS (Function as a Service) that allows you to run applications in the form of functions without the need for server provisioning. The user does not need to manage servers or containers cumbersomely for scale adjustment, and can focus on writing and deploying code for application development.
Features
- Easy and convenient development environment: Developers can easily create Function resources connected to events in various environments using a Code Editor suitable for the chosen runtime, and can write and call code easily.
- Serverless Computing: You can use a serverless type of code execution service for development in the Samsung Cloud Platform environment. The resources required to call and execute function-type applications are allocated and managed by Samsung Cloud Platform according to the scale of execution.
- Efficient Cost Management: The called Function is charged only for the actual application runtime by aggregating usage (total number of calls, total call time). Functions with low usage are adjusted to Scale-to-zero state by Cloud Functions’ Scaler, preventing resource consumption, thus enabling efficient cost management.
Service Composition Diagram
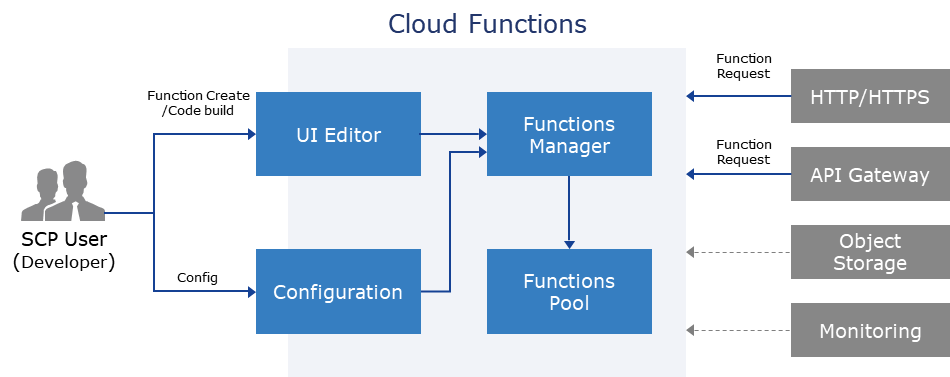
Provided Features
Cloud Functions provides the following features.
- Code Writing Environment: Runtime-optimized Function creation, Code writing and editing
- Supported Runtime refers to Component > Runtime
- Function execution, environment management, monitoring: endpoint definition, Token management, access control setting, trigger setting, etc., definition and modification of operating environment/variables, calling/testing output for Deploy/Test, service deployment, progress status monitoring/logging
- Serverless Computing: all elements required for code writing and deployment are managed by Samsung Cloud Platform, with automatic scale adjustment according to deployment
- Sample Code Provided: Provides various sample codes through Blueprint, allowing for easy and quick start
Component
Runtime
Cloud Functions currently supports the following Runtime, and more supported Runtime will be added continuously.
| Runtime | Version |
|---|---|
| GO | 1.21, 1.23 |
| java | 17 |
| Node.js | 18, 20 |
| PHP | 8.1 |
| Python | 3.9, 3.10, 3.11 |
Table. Supported Runtime Items
Regional Provision Status
Cloud Functions service is available in the following environments.
| Region | Availability |
|---|---|
| Korea West 1(kr-west1) | Provided |
| Korean East 1 (kr-east1) | Provided |
| South Korea (kr-south1) | Not provided |
| South Korea southern region 2(kr-south2) | Not provided |
| South Korea southern region 3(kr-south3) | Not provided |
Table. Cloud Functions Region-wise Availability
Preceding Service
This is a list of services that can be configured as optional before creating the service. Please refer to the guide provided for each service and prepare in advance for more information.
| Service Category | Service | Detailed Description |
|---|---|---|
| Application Service | API Gateway | A service that easily manages and monitors APIs |
Fig. Preceding Cloud Functions Service
6.2 - How-to guides
The user can enter the required information for Cloud Functions through the Samsung Cloud Platform Console, select detailed options, and create the service.
Cloud Functions Create
Click the All Services > Compute > Cloud Functions menu. Navigate to the Service Home page of Cloud Functions.
Click the Create Cloud Functions button on the Service Home page. It navigates to the Create Cloud Functions page.
Create Cloud Functions page, enter the information required to create the service.
Category RequiredDetailed description Funtion name Required Enter the Funtion name to create - Start with a lowercase English letter and use lowercase English letters, numbers, and special characters (
-) to input within 3 ~ 64 characters
Runtime Required Select Runtime creation method - Create new: Create a new Runtime
- Start with Blueprint: Create using the Runtime source code provided by the service
Runtime & Vesion Required Select Runtime and Version - Create New을 선택한 경우
- Runtime & Version 목록은 Components > Runtime 참고
- For Java runtime, UI code editing is not supported, but you can run by fetching a Jar file from Object Storage
- Start with Blueprint를 선택한 경우
- You can view source code examples by clicking the View Source Code button for the selected Runtime & Version
- Refer to the Blueprint Detailed Guide for more details on Blueprint settings
Table. Cloud Functions Service Information Input Items- Start with a lowercase English letter and use lowercase English letters, numbers, and special characters (
Summary Check the detailed information and estimated billing amount generated in the panel, and click the Complete button.
- When creation is complete, check the created resource on the Cloud Functions list page.
Cloud Functions Check Detailed Information
Cloud Functions Details page consists of Detail Information, Monitoring, Log, Code, Configuration, Trigger, Tag, Job History tabs.
To view detailed information about the Cloud Functions service, follow these steps.
- All Services > Compute > Cloud Functions Click the menu. Go to the Service Home page of Cloud Functions.
- Click the Function menu on the Service Home page. Move to the Function List page.
- Click the resource to view detailed information on the Function list page. Go to the Function detail page.
- Function Details The page displays status information and additional feature information, and consists of the Details, Monitoring, Log, Code, Configuration, Trigger, Tag, Task History tabs.
Category Detailed description Cloud Functions status Cloud Functions status information - Ready: green icon, state where normal function calls are possible
- Not Ready: gray icon, state where normal function calls are not possible
- Deploying: yellow icon, state where function is being created or changed, triggered by the following actions
- function creation and modification
- modify code with editor in the Code tab
- inspect jar file in the Code tab
- add and modify in the Trigger tab
- modify in the Configuration tab
- Running: blue icon, state where normal function calls are possible and cold start prevention policy is applied
Service cancellation Button to cancel the service Table. Cloud Functions status information and additional features
Detailed Information
Function list page, you can view detailed information of the selected resource and, if necessary, edit the information.
| Category | Detailed description |
|---|---|
| service | service name |
| Resource Type | Resource Type |
| SRN | Unique resource ID in Samsung Cloud Platform |
| Resource Name | Resource Name
|
| Resource ID | Unique resource ID of the service |
| Creator | User who created the service |
| Creation time | Date/time the service was created |
| Editor | User who modified the service |
| Modification Date and Time | Date and time the service was modified |
| Function name | Name of Cloud Function |
| Runtime | Runtime types and versions |
| LLM Endpoint | Click User Guide to view LLM Endpoint information and usage instructions |
Table. Cloud Functions Details - Detailed Information Tab Items
Reference
For detailed information on how to use LLM by integrating AIOS, please refer to Integrate AIOS.
Monitoring
You can view the Cloud Functions usage information of the selected resource on the Function List page.
| Category | Detailed description |
|---|---|
| Number of calls | Average number of times the function was called during the unit time (instances) |
| Execution Time | Average execution time (seconds) of the function during the unit time |
| Memory usage | Average memory usage (kb) used during the execution of the function per unit time |
| Current task count | If the function is called multiple times simultaneously, the average number of tasks generated per unit time for concurrent processing (count) |
| Successful call count | Average number of times (cases) the runtime code operated normally and delivered a response code per unit time when the function is called |
| Failed call count | Average number of calls with errors per unit time when the function is invoked
|
Table. Cloud Functions Details - Monitoring Tab Items
Log
You can view the Cloud Functions logs of the selected resource on the Function list page.
| Category | Detailed description |
|---|---|
| Unit period | Select the period to view Cloud Functions log information
|
| Log Message | Displayed in order from the most recent occurring function. |
Table. Cloud Functions Details - Log Tab Items
Reference
Log messages can be viewed up to the previous 1,000 messages based on the most recent occurrence.
Code
Function list page allows you to view and edit the Cloud Functions code of the selected resource.
Reference
The way to view and edit source code changes depending on the runtime used.
- Inline Editor: Node.js, Python, PHP, Go
- Run compressed file (.jar/.zip): Java
| Category | Detailed description |
|---|---|
| Source Code | Inline Editor Mode |
| Code Information | Display code information |
| Edit | Edit After clicking the button, you can edit the code in the inline editor |
Table. Cloud Functions Details - Inline Editor Items in Code Tab
| Category | Detailed description |
|---|---|
| Source code | Compressed file (.jar/.zip) execution method |
| Code Information | Compressed File Information Display
|
| Edit | Jar file can be changed
|
Table. Cloud Functions Details - Execution Items of Compressed Files (.jar/.zip) in Code Tab
Reference
- In the case of Java Runtime, it does not provide UI code editing functionality, and you must select a compressed file (.jar/.zip) from the bucket of the Object Storage service.
- In case of users whose Object Storage service authentication key has not been generated, Import from Object Storage cannot be executed, so you must generate the authentication key in advance.
- For detailed information on creating authentication keys, refer to Create Authentication Key.
- Cloud Functions service’s Object Storage bucket’s access control must be changed to allow state.
- For detailed information about Object Storage access control, please refer to Allow Cloud Functions Service Access.
Composition
Function list page allows you to view the Cloud Functions configuration of the selected resource.
| Category | Detailed description |
|---|---|
| General Configuration | Cloud Function memory and timeout settings
|
| Environment Variable | Set runtime environment variables
|
| Function URL | Issue an HTTPS URL address that can access the function
|
| Private connection configuration | Can be used in conjunction with PrivateLink Service
|
Table. Cloud Functions Details - Configuration Tab Items
Caution
If you disable Access Control, the registered access information will be deleted, making function access control impossible, so it may be exposed to security attacks such as external scanning and hacking.
Reference
- General Configuration’s memory allocation proportionally determines the number of CPU cores that are automatically assigned.
- General configuration’s minimum execution count of 1 or more prevents Cold Start, but costs are incurred continuously.
Trigger
Function List page allows you to view and configure trigger information of the selected resource. If you set a trigger, the Function can be automatically executed when an event occurs.
| Category | Detailed description |
|---|---|
| Cronjob | Use Cronjob as a trigger
|
| API Gateway | Use API Gateway as a trigger
|
Table. Cloud Functions Details - Trigger Tab Items
Caution
If you call the Cronjob trigger before the function timeout, the function will run nestedly, increasing the execution count and duration. Consequently, continuous additional costs can accrue, leading to high expenses, so be careful.
Reference
- Deploying If in this state, cannot be edited.
- About trigger settings, please refer to Trigger Setup.
Tag
In the Tag tab, you can view the resource’s tag information, and add, modify, or delete it.
| Category | Detailed description |
|---|---|
| Tag List | Tag List
|
Table. Cloud Functions Details - Tag Tab Items
Work History
You can check the work history of resources on the Work History page.
| Category | Detailed description |
|---|---|
| Work History List | Resource Change History
|
Table. Cloud Functions Details - Job History Tab Items
Java Runtime Code Change
If you are using Java Runtime, you cannot modify the code directly, so you need to select and change the compressed file (.jar/.zip) in the bucket of the Object Storage service.
Follow the steps below to change the compressed file.
To cancel the Cloud Functions service, follow the steps below.
- Click the All Services > Compute > Cloud Functions menu. Go to the Service Home page of Cloud Functions.
- Service Home on the page click the Function menu. Navigate to the Function list page.
- Click the resource to change the compressed file within the code on the Function List page. Navigate to the Function Details page.
- Click the Edit button on the Code tab of the Function Details page. It moves to the Function Code Edit page.
- Import from Object Storage Click the button. Import from Object Storage popup opens.
| Category | Detailed description |
|---|---|
| Java Runtime | Java Runtime information |
| Handler Information | Handler Information
|
| Compressed file (.jar/.zip) | Set the compressed file to modify
|
Table. Cloud Functions Details - Function Code Modification Items
- Object Storage URL After entering the URL information of the Object Storage from which to retrieve the compressed file, click the Confirm button. A notification popup will open.
- The URL information can be found in the Folder List tab of the detailed page of the Object Storage to be retrieved, under the File Information > Private URL item.
- Click the Confirm button. The name of the imported archive file is displayed in the Function code edit page’s Archive file name (.jar/.zip).
- Click the Save button.
Caution
- In case of a user whose authentication key has not been generated, Import from Object Storage cannot be executed.
- If the URL does not exist or the compressed file corresponds to the following, it cannot be changed.
- When using an unsupported extension
- If there is a harmful file in the compressed file
- If it exceeds the supported size
Cloud Functions Cancel
To cancel the Cloud Functions service, follow the steps below.
- All Services > Compute > Cloud Functions Click the menu. Navigate to the Service Home page of Cloud Functions.
- Click the Function menu on the Service Home page. Go to the Function List page.
- Function list page, click the resource to be terminated and click the Cancel Service button.
- When the termination is completed, check whether the resource has been terminated on the Function List page.
6.2.1 - Set Trigger
Set up trigger
Reference
- By default, all triggers can be added in Cloud Functions.
- If triggered from a specific product, it must be passed to Cloud Functions.
Cronjob Trigger Setup
To set up a Cronjob trigger, follow these steps.
- All Services > Compute > Cloud Functions Click the menu. Navigate to the Service Home page of Cloud Functions.
- Click the Function menu on the Service Home page. It moves to the Function List page.
- Function List 페이지에서 트리거를 설정할 자원을 클릭하세요. Function Details 페이지로 이동합니다.
- After clicking the Trigger tab, click the Add Trigger button. Set it. The Add Trigger popup opens.
- Add Trigger In the popup window, select Trigger Type Cronjob. The required information input area appears at the bottom.
Category Detailed description Cronjob Settings Set the trigger’s repeat frequency - Can be set in minutes, hours, days, months, and weekdays
Timezone setting Set the trigger’s reference time zone Table. Cronjob Trigger Required Information Items - After entering the required information, click the Confirm button.
- When the pop-up window notifying addition opens, click the Confirm button.
API Gateway Trigger Setup
To set up an API Gateway trigger, follow these steps.
- All Services > Compute > Cloud Functions Click the menu. Go to the Service Home page of Cloud Functions.
- Click the Function menu on the Service Home page. Go to the Function List page.
- Function List on the page, click the resource to set the trigger. Function Details go to the page.
- After clicking the Trigger tab, click the Add Trigger button. Set it. The Add Trigger popup window opens.
- Add Trigger In the popup window, select Trigger Type API Gateway. A required information input area appears at the bottom.
Category Detailed description API name API selection - You can select an existing API or create a new one
Stage Select deployment target - You can select an existing stage or create a new one
Table. API Gateway Trigger Required Information Items - After entering the required information, click the Confirm button.
- When the popup notifying addition opens, click the Confirm button.
Setting up Multi Trigger
You can connect multiple triggers to a single function and use them.
Edit Trigger
To modify the added trigger, follow the steps below.
- All Services > Compute > Cloud Functions Click the menu. Go to the Service Home page of Cloud Functions.
- Click the Function menu on the Service Home page. Navigate to the Function List page.
- On the Function List page, click the resource to edit the trigger. It moves to the Function Details page.
- After clicking the Trigger tab, click the Edit button of the trigger whose settings you want to modify in the trigger list. The Edit Trigger popup window opens.
- Trigger Edit After modifying the setting values in the popup window, click the Confirm button.
- The setting values vary depending on the type of trigger (see Cronjob Trigger, API Gateway Trigger).
- When the popup notifying the edit opens, click Confirm.
Delete Trigger
To delete the trigger, follow the steps below.
Caution
Triggers linked to a specific product only manage the product delivered at the time of linking in that product, and when Functions are terminated, a deletion status must be delivered to that product.
- All Services > Compute > Cloud Functions Click the menu. Navigate to the Service Home page of Cloud Functions.
- Click the Function menu on the Service Home page. Navigate to the Function List page.
- Function List page, click the resource to set the trigger. Function Details page will be navigated.
- In the Trigger tab’s trigger list, after selecting the trigger to delete, click the Delete button.
- Click the Confirm button when the popup notifying trigger deletion opens.
6.2.2 - AIOS Connect
AIOS Linking
You can use LLM by linking Cloud Functions with AIOS.
AIOS LLM Private Endpoint
The URL of the AIOS LLM private endpoint is as follows.
- Samsung Cloud Platform for Samsung: https://aios.private.kr-west1.s.samsungsdscloud.com
- Samsung Cloud Platform for Enterprize: https://aios.private.kr-west1.e.samsungsdscloud.com
Reference
Refer to the following for detailed information on the availability and provision model of AIOS services by region.
- Availability of AIOS services by region: AIOS Service - Regional Availability Reference
- AIOS service provided LLM model: AIOS Service - LLM Provided Model reference
Blueprint Change Source Code
To integrate Cloud Functions with AIOS, you need to change the URL address in the Blueprint to match the LLM Endpoint used in each region. To change the Blueprint source code, follow the steps below.
- All Services > Compute > Cloud Functions Click the menu. Go to the Service Home page of Cloud Functions.
- Service Home on the page click the Cloud Functions menu. Navigate to the Function list page.
- On the Function List page, click the resource to be called via URL. You will be taken to the Function Detail page.
- After clicking the Code tab, click the Edit button. Navigate to the Function Code Edit page.
- After modifying the Blueprint using Python, Node.js, Go Runtime source code, click the Save button.
Python source code
Color modeimport json import requests def handle_request(params): # User writing area (Function details) url = "{AIOS LLM private endpoint}/{API}" # Destination URL data = { "model": "openai/gpt-oss-120b" , "prompt" : "Write a haiku about recursion in programming." , "temperature": 0 , "max_tokens": 100 , "stream": False } try: response = requests.post(url, json=data, verify=True) return { 'statusCode': response.status_code, 'body': json.dumps(response.text) } except requests.exceptions.RequestException as e: return str(e)import json import requests def handle_request(params): # User writing area (Function details) url = "{AIOS LLM private endpoint}/{API}" # Destination URL data = { "model": "openai/gpt-oss-120b" , "prompt" : "Write a haiku about recursion in programming." , "temperature": 0 , "max_tokens": 100 , "stream": False } try: response = requests.post(url, json=data, verify=True) return { 'statusCode': response.status_code, 'body': json.dumps(response.text) } except requests.exceptions.RequestException as e: return str(e)Python source code Node.js source code
Color modeconst request = require('request'); /** * @description User writing area (Function details) */ exports.handleRequest = async function (params) { return await sendRequest(params); }; async function sendRequest(req) { return new Promise((resolve, reject) => { url = "{AIOS LLM private endpoint}/{API}" data = { model: 'openai/gpt-oss-120b' , prompt : 'Write a haiku about recursion in programming.' , temperature: 0 , max_tokens: 100 , stream: false } const options = { uri: url, method:'POST', body: data, json: true, strictSSL: false, rejectUnauthorized: false } request(options, (error, response, body) => { if (error) { reject(error); } else { resolve({ statusCode: response.statusCode, body: JSON.stringify(body) }); } }); }); }const request = require('request'); /** * @description User writing area (Function details) */ exports.handleRequest = async function (params) { return await sendRequest(params); }; async function sendRequest(req) { return new Promise((resolve, reject) => { url = "{AIOS LLM private endpoint}/{API}" data = { model: 'openai/gpt-oss-120b' , prompt : 'Write a haiku about recursion in programming.' , temperature: 0 , max_tokens: 100 , stream: false } const options = { uri: url, method:'POST', body: data, json: true, strictSSL: false, rejectUnauthorized: false } request(options, (error, response, body) => { if (error) { reject(error); } else { resolve({ statusCode: response.statusCode, body: JSON.stringify(body) }); } }); }); }Node.js Source Code GO source code
Color modepackage gofunction import ( "bytes" "net/http" "encoding/json" "io/ioutil" ) type PostData struct { Model string `json:"model"` Prompt string `json:"prompt"` Temperature int `json:"temperature"` MaxTokens int `json:"max_tokens"` Stream bool `json:"stream"` } func HandleRequest(r *http.Request)(string, error) { url := "{AIOS LLM private endpoint}/{API}" data := PostData { Model: "openai/gpt-oss-120b", Prompt: "Write a haiku about recursion in programming.", Temperature: 0, MaxTokens: 100, Stream: false, } jsonData, err := json.Marshal(data) if err != nil { panic(err) } req, err := http.NewRequest("POST", url, bytes.NewBuffer(jsonData)) if err != nil { panic(err) } req.Header.Set("Content-Type", "application/json") client := &http.Client{} resp, err := client.Do(req) if err != nil { panic(err) } defer resp.Body.Close() // Read response body body, err := ioutil.ReadAll(resp.Body) if err != nil { panic(err) } return string(body), nil "}package gofunction import ( "bytes" "net/http" "encoding/json" "io/ioutil" ) type PostData struct { Model string `json:"model"` Prompt string `json:"prompt"` Temperature int `json:"temperature"` MaxTokens int `json:"max_tokens"` Stream bool `json:"stream"` } func HandleRequest(r *http.Request)(string, error) { url := "{AIOS LLM private endpoint}/{API}" data := PostData { Model: "openai/gpt-oss-120b", Prompt: "Write a haiku about recursion in programming.", Temperature: 0, MaxTokens: 100, Stream: false, } jsonData, err := json.Marshal(data) if err != nil { panic(err) } req, err := http.NewRequest("POST", url, bytes.NewBuffer(jsonData)) if err != nil { panic(err) } req.Header.Set("Content-Type", "application/json") client := &http.Client{} resp, err := client.Do(req) if err != nil { panic(err) } defer resp.Body.Close() // Read response body body, err := ioutil.ReadAll(resp.Body) if err != nil { panic(err) } return string(body), nil "}GO source code
6.2.3 - Blueprint Detailed Guide
Blueprint Overview
When creating Cloud Functions, you can set the Blueprint to utilize the Runtime source code provided by Cloud Functions. Refer to the following for Blueprint items provided by Cloud Functions.
| Category | Detailed Description | Remarks |
|---|---|---|
| Hello World | When the function is called, it responds with Hello Serverless World! | |
| Execution after timeout | Outputs code that should be executed after the function call time has exceeded, but does not execute. | PHP, Python not supported |
| HTTP request body | Parses the request body. | PHP not supported |
| Send HTTP requests | Send HTTP requests from Cloud functions. | PHP not supported |
| Print logs | Outputs the user’s Samsung Cloud Platform Console Request to the log. | PHP not supported |
| Throw a custom error | Enter the error logic directly to handle the error. | |
| Using Environment Variable | Configure environment variables within the Cloud function and execute. |
Table. Blueprint Items
Hello World
Hello World explains how to set up receiving responses and an example of function call (using function URL).
Hello World Setting
To set Hello World, follow the steps below.
All Services > Compute > Cloud Functions Click the menu. Navigate to the Service Home page of Cloud Functions.
Click the Function menu on the Service Home page. Go to the Function list page.
Function list page, click the resource to be called via URL. Navigate to the Function detail page.
Click the Configuration tab, then click the Edit button of the Function URL item. The Edit Function URL popup opens.
Edit Function URL in the popup window, after setting Activation Status to Enabled, click the Confirm button.
Category Detailed description Activation status Set whether to use function URL Authentication Type Select whether to use IAM authentication when requesting the function URL Access Control Can manage by adding accessible IPs - After setting to Use, public access IP can be entered and added
Table. Required input fields when adding a triggerAfter moving to the Code tab, click the Edit button. You will be taken to the Function Code Edit page.
After adding the processing logic for success and failure cases, click the Save button.
- Node.js source codeColor mode
exports.handleRequest = async function (params) { /** * @description User writing area (Function details) */ const response = { statusCode: 200, body: JSON.stringify('Hello Serverless World!'), };" return response; };exports.handleRequest = async function (params) { /** * @description User writing area (Function details) */ const response = { statusCode: 200, body: JSON.stringify('Hello Serverless World!'), };" return response; };Hello World - Node.js source code - Python source codeColor mode
import json def handle_request(params): # User writing area (Function details) return { 'statusCode': 200, 'body': json.dumps('Hello Serverless World!') }import json def handle_request(params): # User writing area (Function details) return { 'statusCode': 200, 'body': json.dumps('Hello Serverless World!') }Hello World - Python source code - PHP source codeColor mode
<?php function handle_request() { # User writing area (Function details) $res = array( 'statusCode' => 200, 'body' => 'Hello Serverless World!', ); return $res; } ?><?php function handle_request() { # User writing area (Function details) $res = array( 'statusCode' => 200, 'body' => 'Hello Serverless World!', ); return $res; } ?>Hello World - PHP source code
- Node.js source code
Check function call
After calling the function URL in the Configuration tab of the Function Details page, verify the response.
Hello Serverless World!
# Execution after timeout
Explain the setting for execution after timeout and an example of function call (using function URL).
## Execution after timeout Setting
To set Execution after timeout, follow the steps below.
1. **All Services > Compute > Cloud Functions** Click the menu. Go to the **Service Home** page of Cloud Functions.
2. Click the **Function** menu on the **Service Home** page. Navigate to the **Function List** page.
3. **Function List** page, click the resource to set the trigger. **Function Details** page will be opened.
4. After clicking the **Trigger** tab, click the **Add Trigger** button. The **Add Trigger** popup opens.
5. **Add Trigger** In the popup window, after selecting the **Trigger Type** item, enter the required information displayed at the bottom and click the **Confirm** button.
* Required information varies depending on the trigger type.
Trigger Type
Input Item
API Gateway
- API name: You can select an existing API or create a new one
- Stage: You can select an existing stage or create a new one
Cronjob
- Refer to the example and enter the trigger’s repeat frequency (minute, hour, day, month, day of week)
- Timezone setting: select the reference time zone to apply
Table. Required input items when adding a trigger
6. **Code** after moving to the tab, click the **Edit** button. You will be taken to the **Function Code Edit** page.
7. After adding the processing logic for success and failure cases, click the **Save** button.
* Node.js source code
Color mode
exports.handleRequest = async function (params) {
/**
* @description User writing area (Function details)
*/
console.log("Hello world 3");
await delay(3000);
const response = {
statusCode: 200,
body: JSON.stringify('Hello Serverless World!'),
};;
return response;
};
const delay = (ms) => {
return new Promise(resolve=>{
setTimeout(resolve,ms)
})
}
Execution after timeout - Node.js source code ## Check function call
**Function Details** page's **configuration** tab call the **function URL** and after a certain amount of time, check the response.Hello Serverless World!
# HTTP request body
Explains the Request Body parsing settings and function call example (using function URL).
## Setting HTTP request body
To set the HTTP request body, follow these steps.
1. Click the **All Services > Compute > Cloud Functions** menu. Go to the **Service Home** page of Cloud Functions.
2. Click the **Function** menu on the **Service Home** page. Navigate to the **Function** list page.
3. **Function List** page, click the resource to set the trigger. **Function Details** page will be opened.
4. After clicking the **Trigger** tab, click the **Add Trigger** button. The **Add Trigger** popup opens.
5. **Add Trigger** in the popup window, after selecting the **Trigger Type** item, enter the required information displayed at the bottom and click the **Confirm** button.
* Required information varies depending on the trigger type.
Trigger Type
Input Item
API Gateway
- API name: You can select an existing API or create a new one
- Stage: You can select an existing stage or create a new one
Cronjob
- Refer to the example and enter the trigger’s repeat frequency (minute, hour, day, month, day of week)
- Timezone setting: select the time zone to apply
Table. Required input items when adding a trigger
6. After moving to the **Code** tab, click the **Edit** button. You will be taken to the **Function Code Edit** page.
7. After adding processing logic for success and failure cases, click the **Save** button.
* Node.js source code
Color mode
exports.handleRequest = async function (params) {
/**
* @description User writing area (Function details)
*/
const response = {
statusCode: 200,
body: JSON.stringify(params.body),
};;
return response;
};
exports.handleRequest = async function (params) {
/**
* @description User writing area (Function details)
*/
const response = {
statusCode: 200,
body: JSON.stringify(params.body),
};;
return response;
};
Execution after timeout - Node.js source code * Python source codeColor modeimport json
def handle_request(params):
# User writing area (Function details)
return {
'statusCode': 200,
'body': json.dumps(params.json)
}
import json
def handle_request(params):
# User writing area (Function details)
return {
'statusCode': 200,
'body': json.dumps(params.json)
}
Execution after timeout - Python source code ## Check function call
**Function Details** page's **Configuration** tab after calling the **function URL**, check the Body data, request Body value, and response Body value.
* request Body valueColor mode{
"testKey" :"cloud-001",
"testNames": ["
{
"name": "Son"
},
{
"name": "Kim"
}
],
"testCode":"test"
}
{
"testKey" :"cloud-001",
"testNames": ["
{
"name": "Son"
},
{
"name": "Kim"
}
],
"testCode":"test"
}
Request Body Value * Response Body valueColor mode{
"testKey" :"cloud-001",
"testNames": [
{
"name": "Son"
},
{
"name": "Kim"
}
],
"testCode":"test"
}
{
"testKey" :"cloud-001",
"testNames": [
{
"name": "Son"
},
{
"name": "Kim"
}
],
"testCode":"test"
}
Response Body Value # Send HTTP requests
Explains the HTTP request settings and function call example (using function URL).
## Send HTTP requests Setup
To configure Send HTTP requests, follow the steps below.
1. **All Services > Compute > Cloud Functions** Click the menu. Go to the **Service Home** page of Cloud Functions.
2. Click the **Function** menu on the **Service Home** page. Go to the **Function List** page.
3. Click the resource to set the trigger on the **Function List** page. It navigates to the **Function Details** page.
4. After clicking the **Trigger** tab, click the **Add Trigger** button. The **Add Trigger** popup opens.
5. **Add Trigger** In the popup window, after selecting the **Trigger Type** item, enter the required information displayed at the bottom and click the **Confirm** button.
* Required information varies depending on the type of trigger.Trigger Type Input Item API Gateway - API name: You can select an existing API or create a new one
- Stage: You can select an existing stage or create a new one
Cronjob - Refer to the example and enter the trigger’s repeat frequency (minute, hour, day, month, day of week)
- Timezone setting: select the reference time zone to apply
Table. Required input items when adding a trigger
6. After moving to the **Code** tab, click the **Edit** button. You will be taken to the **Function Code Edit** page.
7. After adding the processing logic for success and failure cases, click the **Save** button.
* Node.js source codeColor modeconst request = require('request');
/**
* @description User writing area (Function details)
*/
exports.handleRequest = async function (params) {
return await sendRequest(params);
};
async function sendRequest(req) {
return new Promise((resolve, reject) => {
// Port 80 and Port 443 are available
url = "https://example.com"; // Destination URL
const options = {
uri: url,
method:'GET',
json: true,
strictSSL: false,
rejectUnauthorized: false
}
request(options, (error, response, body) => {
if (error) {
reject(error);
} else {
resolve({
statusCode: response.statusCode,
body: JSON.stringify(body)
});
}
});
});
}
const request = require('request');
/**
* @description User writing area (Function details)
*/
exports.handleRequest = async function (params) {
return await sendRequest(params);
};
async function sendRequest(req) {
return new Promise((resolve, reject) => {
// Port 80 and Port 443 are available
url = "https://example.com"; // Destination URL
const options = {
uri: url,
method:'GET',
json: true,
strictSSL: false,
rejectUnauthorized: false
}
request(options, (error, response, body) => {
if (error) {
reject(error);
} else {
resolve({
statusCode: response.statusCode,
body: JSON.stringify(body)
});
}
});
});
}
Send HTTP requests - Node.js source code * Python source codeColor modeimport json
import requests
def handle_request(params):
# User writing area (Function details)
# Port 80 and Port 443 are available
url = "https://example.com" # Destination URL
try:
response = requests.get(url, verify=True)
return {
'statusCode': response.status_code,
'body': json.dumps(response.text)
}
except requests.exceptions.RequestException as e:
return str(e)
import json
import requests
def handle_request(params):
# User writing area (Function details)
# Port 80 and Port 443 are available
url = "https://example.com" # Destination URL
try:
response = requests.get(url, verify=True)
return {
'statusCode': response.status_code,
'body': json.dumps(response.text)
}
except requests.exceptions.RequestException as e:
return str(e)
Send HTTP requests - Python source code ## Check function call
**Function Details** page's **Configuration** tab, after calling the **function URL**, check the response.Color mode<!doctype html>
<html>
<head>
<title>Example Domain</title>
<meta charset="utf-8" />
<meta http-equiv="Content-type" content="text/html; charset=utf-8" />
<meta name="viewport" content="width=device-width, initial-scale=1" />
<style type="text/css">
body {
background-color: #f0f0f2;
margin: 0;
padding: 0;
font-family: -apple-system, system-ui, BlinkMacSystemFont, "Segoe UI", "Open Sans", "Helvetica Neue", Helvetica, Arial, sans-serif;
}
div {
width: 600px;
margin: 5em auto;
padding: 2em;
background-color: #fdfdff;
border-radius: 0.5em;
box-shadow: 2px 3px 7px 2px rgba(0,0,0,0.02);
}
a:link, a:visited {
color: #38488f;
text-decoration: none;
}
@media (max-width: 700px) {
div {
margin: 0 auto;
width: auto;
}
}
</style>
</head>
<body>
<div>
<h1>Example Domain</h1>
<p>This domain is for use in illustrative examples in documents. You may use this
domain in literature without prior coordination or asking for permission.</p>
<p><a href="https://www.iana.org/domains/example">More information...</a></p>
</div>
</body>
</html>
<!doctype html>
<html>
<head>
<title>Example Domain</title>
<meta charset="utf-8" />
<meta http-equiv="Content-type" content="text/html; charset=utf-8" />
<meta name="viewport" content="width=device-width, initial-scale=1" />
<style type="text/css">
body {
background-color: #f0f0f2;
margin: 0;
padding: 0;
font-family: -apple-system, system-ui, BlinkMacSystemFont, "Segoe UI", "Open Sans", "Helvetica Neue", Helvetica, Arial, sans-serif;
}
div {
width: 600px;
margin: 5em auto;
padding: 2em;
background-color: #fdfdff;
border-radius: 0.5em;
box-shadow: 2px 3px 7px 2px rgba(0,0,0,0.02);
}
a:link, a:visited {
color: #38488f;
text-decoration: none;
}
@media (max-width: 700px) {
div {
margin: 0 auto;
width: auto;
}
}
</style>
</head>
<body>
<div>
<h1>Example Domain</h1>
<p>This domain is for use in illustrative examples in documents. You may use this
domain in literature without prior coordination or asking for permission.</p>
<p><a href="https://www.iana.org/domains/example">More information...</a></p>
</div>
</body>
</html>
Check function call response # Print logs
Explains the log output settings and function call example (using function URL).
## Print logs Setup
Print logs To set up receiving responses, follow the steps below.
1. Click the **All Services > Compute > Cloud Functions** menu. Navigate to the **Service Home** page of Cloud Functions.
2. Click the **Function** menu on the **Service Home** page. Move to the **Function List** page.
3. **Function List** page, click the resource to set the trigger. **Function Details** page will be opened.
4. Click the **Trigger** tab, then click the **Add Trigger** button. The **Add Trigger** popup opens.
5. **Add Trigger** In the popup window, after selecting the **Trigger Type** item, enter the required information displayed at the bottom and click the **Confirm** button.
* Required information varies depending on the trigger type.Trigger Type Input Item API Gateway - API name: You can select an existing API or create a new one
- Stage: You can select an existing stage or create a new one
Cronjob - Refer to the example and enter the trigger’s repeat frequency (minute, hour, day, month, day of week)
- Timezone setting: select the reference time zone to apply
Table. Required input items when adding a trigger
6. After moving to the **Code** tab, click the **Edit** button. You will be taken to the **Function Code Edit** page.
7. After adding the processing logic for success and failure cases, click the **Save** button.
* Node.js source codeColor modeconst winston = require('winston');
// Log module setting
const logger = winston.createLogger({
format: winston.format.combine(
winston.format.timestamp(),
winston.format.printf(info => info.timestamp + ' ' + info.level + ': ' + info.message)
),
transports: [
new winston.transports.Console()
]
});
exports.handleRequest = async function (params) {
/**
* @description User writing area (Function details)
*/
const response = {
statusCode: 200,
body: JSON.stringify(params.body),
};"
logger.info(JSON.stringify(response, null, 2));
return response;
};
const winston = require('winston');
// Log module setting
const logger = winston.createLogger({
format: winston.format.combine(
winston.format.timestamp(),
winston.format.printf(info => info.timestamp + ' ' + info.level + ': ' + info.message)
),
transports: [
new winston.transports.Console()
]
});
exports.handleRequest = async function (params) {
/**
* @description User writing area (Function details)
*/
const response = {
statusCode: 200,
body: JSON.stringify(params.body),
};"
logger.info(JSON.stringify(response, null, 2));
return response;
};
Print logs - Node.js source code * Python source codeColor modeimport json
import logging
# Log module setting
logging.basicConfig(level=logging.INFO)
def handle_request(params):
# User writing area (Function details)
response = {
'statusCode': 200,
'body': json.dumps(params.json)
}
logging.info(response)
return response
import json
import logging
# Log module setting
logging.basicConfig(level=logging.INFO)
def handle_request(params):
# User writing area (Function details)
response = {
'statusCode': 200,
'body': json.dumps(params.json)
}
logging.info(response)
return response
Print logs - Python source code ## Check function call
**Function Details** page's **Configuration** tab after calling the **function URL**, check the log in the **Log** tab.Color mode[2023-09-07] 12:06:23] "host": "scf-xxxxxxxxxxxxxxxxxxxxx",
[2023-09-07] 12:06:23] "ce-id": "xxxxxxxxxxxxxxxxxxxxx",
[2023-09-07] 12:06:23] "ce-source": "xxxxxxxxxxxxxxxxxxxxx",
[2023-09-07] 12:06:23] "host": "scf-xxxxxxxxxxxxxxxxxxxxx",
[2023-09-07] 12:06:23] "ce-id": "xxxxxxxxxxxxxxxxxxxxx",
[2023-09-07] 12:06:23] "ce-source": "xxxxxxxxxxxxxxxxxxxxx",
Check function call response # Throw a custom error
Custom error occurrence (Throw a custom error) setting and function call example (function URL usage) is explained.
## Throw a custom error Setting
To set Throw a custom error, follow the steps below.
1. **All Services > Compute > Cloud Functions** Click the menu. Go to the **Service Home** page of Cloud Functions.
2. Click the **Function** menu on the **Service Home** page. Move to the **Function List** page.
3. **Function List** page, click the resource to set the trigger. **Function Details** page will be navigated.
4. **Trigger** tab after clicking, click the **Add Trigger** button. The **Add Trigger** popup window opens.
5. **Add Trigger** In the popup window, after selecting the **Trigger Type** item, enter the required information displayed at the bottom and click the **Confirm** button.
* Required information varies depending on the trigger type.Trigger Type Input Item API Gateway - API name: You can select an existing API or create a new one
- Stage: You can select an existing stage or create a new one
Cronjob - Refer to the example and enter the trigger’s repeat frequency (minute, hour, day, month, day of week)
- Timezone setting: select the time zone to apply
Table. Required input items when adding a trigger6. After moving to the **Code** tab, click the **Edit** button. You will be taken to the **Function Code Edit** page.
7. After adding the processing logic for success and failure cases, click the **Save** button.
* Node.js source codeColor modeclass CustomError extends Error {
constructor(message) {
super(message);
this.name = 'CustomError';
}
}
exports.handleRequest = async function (params) {
/**
* @description User writing area (Function details)
*/
throw new CustomError('This is a custom error!');
};
class CustomError extends Error {
constructor(message) {
super(message);
this.name = 'CustomError';
}
}
exports.handleRequest = async function (params) {
/**
* @description User writing area (Function details)
*/
throw new CustomError('This is a custom error!');
};
Throw a custom error - Node.js source code * Python source codeColor modeclass CustomError(Exception):
def __init__(self, message):
self.message = message
def handle_request(parmas):
raise CustomError('This is a custom error!')
class CustomError(Exception):
def __init__(self, message):
self.message = message
def handle_request(parmas):
raise CustomError('This is a custom error!')
Throw a custom error - Python source code * PHP source codeColor mode<?php
class CustomError extends Exception {
public function __construct($message) {
parent::__construct($message);
$this->message = $message;
}
}
function handle_request() {
throw new CustomError('This is a custom error!');
}
?>
<?php
class CustomError extends Exception {
public function __construct($message) {
parent::__construct($message);
$this->message = $message;
}
}
function handle_request() {
throw new CustomError('This is a custom error!');
}
?>
Throw a custom error - PHP source code ## Check function call
**Function Details** page's **Configuration** tab after calling the **function URL**, check for errors in the **Log** tab.
# Using Environment Variable
Using Environment Variable (Using Environment Variable) configuration and function call example (using function URL) is explained.
## Using Environment Variable Setup
To set Using Environment Variable, follow the steps below.
1. **All Services > Compute > Cloud Functions** Click the menu. Go to the **Service Home** page of Cloud Functions.
2. Click the **Function** menu on the **Service Home** page. Navigate to the **Function List** page.
3. **Function List** Click the resource to set the trigger on the page. **Function Details** Navigate to the page.
4. After clicking the **Trigger** tab, click the **Add Trigger** button. The **Add Trigger** popup opens.
5. **Add Trigger** In the popup window, after selecting the **Trigger Type** item, enter the required information displayed at the bottom and click the **Confirm** button.
* Required information varies depending on the type of trigger.Trigger Type Input Item API Gateway - API name: You can select an existing API or create a new one
- Stage: You can select an existing stage or create a new one
Cronjob - Refer to the example and enter the trigger’s repeat frequency (minute, hour, day, month, day of week)
- Timezone setting: select the reference time zone to apply
Table. Required input items when adding a trigger6. After moving to the **Code** tab, click the **Edit** button. You will be taken to the **Function Code Edit** page.
7. After adding the processing logic for success and failure cases, click the **Save** button.
* Node.js source codeColor modeexports.handleRequest = async function (params) {
/**
* @description User writing area (Function details)
*/
return process.env.test;
};
exports.handleRequest = async function (params) {
/**
* @description User writing area (Function details)
*/
return process.env.test;
};
Using Environment Variable - Node.js source code * Python source codeColor modeimport json
import os
def handle_request(params):
# User writing area (Function details)
return os.environ.get("test")
import json
import os
def handle_request(params):
# User writing area (Function details)
return os.environ.get("test")
Using Environment Variable - Python source code * PHP source codeColor modeimport json
def handle_request(params):
# User writing area (Function details)
return os.environ.get("test")
import json
def handle_request(params):
# User writing area (Function details)
return os.environ.get("test")
Using Environment Variable - PHP source code 9. After moving to the **Configuration** tab, click the **Edit** button in the **Environment Variable** area. The **Edit Environment Variable** popup window opens.
10. After entering the environment variable information, click the **Confirm** button.Category Detailed description Name Enter Key value value ValueEnter value
Table. Environment Variable Input Items## Check function call
**Function Details** page's **Configuration** tab, after calling the **Function URL**, check the environment variable values in the **Log** tab.6.2.4 - PrivateLink Service Integration
By linking Cloud Functions and PrivateLink services, you can connect VPCs within the Samsung Cloud Platform and VPCs to services without external internet.
The data uses only the internal network, which enhances security, and does not require a public IP, NAT, VPN, internet gateway, etc.
PrivateLink Service Integration
You can expose the function via PrivateLink Service so that it can be accessed privately from another VPC.
To integrate the PrivateLink service, follow the steps below.
- All Services > Compute > Cloud Functions Click the menu. Navigate to the Service Home page of Cloud Functions.
- Click the Cloud Functions menu on the Service Home page. You will be taken to the Function list page.
- Click the resource to associate PrivateLink on the Function List page. It moves to the Function Details page.
- Click the Configuration tab on the Function Details page.
- Click the Edit button of PrivateLink Service in Private connection configuration. Edit PrivateLink Service popup window opens.
- PrivateLink Service Edit in the popup window, after checking the Use item of Activation Status, click the Confirm button. In the Configuration tab’s Private Connection Configuration, the PrivateLink Service information is displayed.
| Category | Detailed description |
|---|---|
| Private URL | PrivateLink Service URL information |
| PrivateLink Service ID | PrivateLink Service ID information |
| Request Endpoint Management | List of PrivateLink Endpoints that requested connection to PrivateLink Service
|
Table. PrivateLink Service Detailed Information Items
PrivateLink Endpoint Create
Create an entry point to access the user’s VPC PrivateLink Service.
Caution
Additional costs may be incurred when creating an endpoint.
To create a PrivateLink Endpoint, follow these steps.
- All Services > Compute > Cloud Functions Click the menu. Go to the Service Home page of Cloud Functions.
- On the Service Home page, click the Cloud Functions menu. It navigates to the Function list page.
- Click the resource to associate with PrivateLink on the Function List page. You will be taken to the Function Details page.
- Click the Configuration tab on the Function Details page.
- Click the Add button of PrivateLink Endpoint in Configure Private Connection. Add PrivateLink Endpoint popup opens.
- PrivateLink Service Add in the popup window, after entering PrivateLink Service ID and Alias information, click the Confirm button.
- When the popup notifying creation opens, click the Confirm button. In the Configuration tab’s Private connection configuration, the PrivateLink Endpoint information is displayed.
| Category | Detailed description |
|---|---|
| PrivateLink Endpoint ID | PrivateLink Endpoint ID information |
| PrivateLink Service ID | PrivateLink Service ID information |
| Alias | Alias information |
| Status | Approval status of PrivateLink Endpoint
|
Table. PrivateLink Endpoint detailed information items
6.3 - Release Note
Cloud Functions
2025.12.16
FEATURE
AIOS, PrivateLink service integration- You can use functions in conjunction with the AIOS service.
- Cloud Functions can be linked with AIOS to utilize LLM.
- You can use functions in conjunction with the PrivateLink service.
- Through Private connection (PrivateLink), you can internally connect Samsung Cloud Platform’s VPC to VPC, and VPC to services without going through the Internet.
2025.10.23
FEATURE
Java Runtime executable file upload feature added- The feature to upload Java Runtime executable files has been added.
- You can fetch and configure a Java Runtime executable archive file (.jar/.zip) to Object Storage.
2025.07.01
NEW
Cloud Functions Service Official Version Release- Cloud Functions service has been officially launched.
- It is a serverless computing-based FaaS (Function as a Service) that easily runs function-style applications without the need for server provisioning.
7 - Virtual Server DR
In the event of a system disruption due to various disasters and risk factors, the Block Storage connected to the Virtual Server in another region can be replicated to restore normal operating conditions in a short period of time.
7.1 - Overview
Service Overview
Virtual Server DR is a service that can quickly recover the system by replicating Virtual Server and connected Block Storage in a different region from the currently used region. Even in the event of various disasters and unexpected situations that interrupt the system, Virtual Server DR can be used to quickly recover to a normal operating state.
Notice
- Virtual Server DR service can be configured through a partner solution sold in the Samsung Cloud Platform’s Marketplace.
- For more information about using Marketplace, please refer to Marketplace.
Caution
- When purchasing and using services sold on the Marketplace, a separate contract with the Marketplace software supplier is issued in accordance with a separate tax invoice.
- If you have applied for a partner solution product for Virtual Server DR on the Marketplace, the application information will be sent to the person in charge by email. Please coordinate the product details and schedule with the person in charge. The software installation and cost will be charged based on the confirmed date.
- Services sold in the Samsung Cloud Platform’s Marketplace are services sold by individual sellers, and SamsungSDS is an intermediary of electronic commerce and is not a party to the electronic commerce. Therefore, SamsungSDS does not guarantee or take responsibility for the service information and transactions sold by individual sellers.
Features
- Easy DR Environment Configuration: You can easily configure a Virtual Server for DR configuration through partner solutions in Samsung Cloud Platform’s Marketplace.
- Various Environment Configuration: Using partner solutions, you can configure various environments such as physical to virtual environment (P2V), virtual to virtual environment (V2V), and support multiple operating systems (Windows, Linux).
Service Composition Diagram
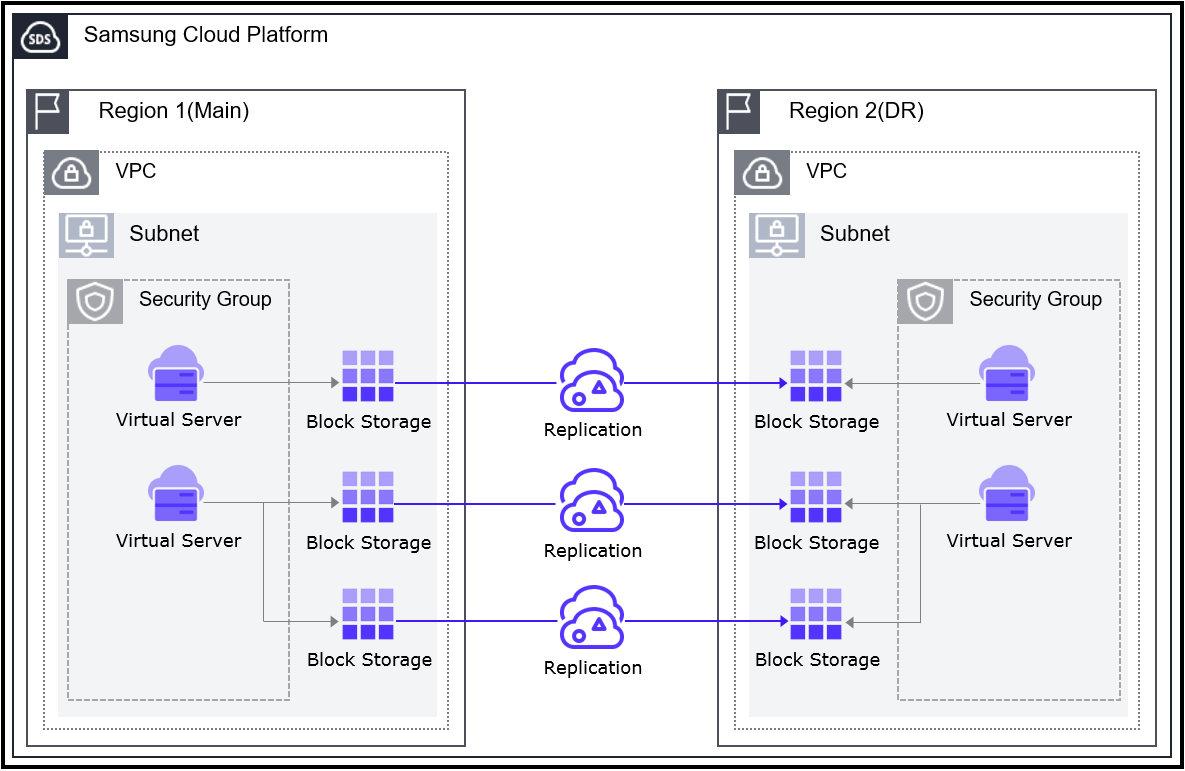
Provided Features
The main feature is to refer to the product catalog details page of the partner solution being sold in the Samsung Cloud Platform’s Marketplace.
Note
For more information on using the Marketplace, please refer to Marketplace.
Preceding Service
This is a list of services that must be pre-configured before creating this service. Please refer to the guide provided for each service and prepare in advance for more details.
| Service Category | Service | Detailed Description |
|---|---|---|
| Networking | VPC | A service that provides an independent virtual network in a cloud environment |
| Networking | Security Group | A virtual firewall that controls the server’s traffic |
| Compute | Virtual Server | Cloud computing-optimized virtual server |
Fig. Virtual Server DR Pre-service
7.2 - Release Note
Virtual Server DR
2025.07.01
NEW
Official Launch of Virtual Server DR Service- Virtual Server DR service has been officially released.
- The system can be restored to normal operating conditions in a short period of time when it is interrupted by various disasters and risk factors.
8 - Block Storage
8.1 - Overview
Service Overview
Block Storage is a high-performance storage that stores data in block units sorted by a certain size and arrangement.
It is suitable for large-scale, high-performance requirements such as databases and mail servers, and users can directly allocate volumes on the server for use.
Features
- Large volume provision: OS configuration volumes are created with at least the minimum size per image and can be expanded up to 12TB, and data storage volumes outside the OS can be created and expanded from a minimum of 8GB to a maximum of 12TB. Volume expansion is performed reliably while online.
- Providing high performance based on Full SSD: Provides high durability and availability based on redundant Controller and Disk Array Raid. Since Full SSD disks are provided by default, it is suitable for high-speed data processing tasks such as database workloads.
- Snapshot Backup: Through the image snapshot feature, recovery of changed and deleted data is possible. Users select a snapshot created at the point in time they wish to recover from the list and perform the recovery.
Service Architecture Diagram
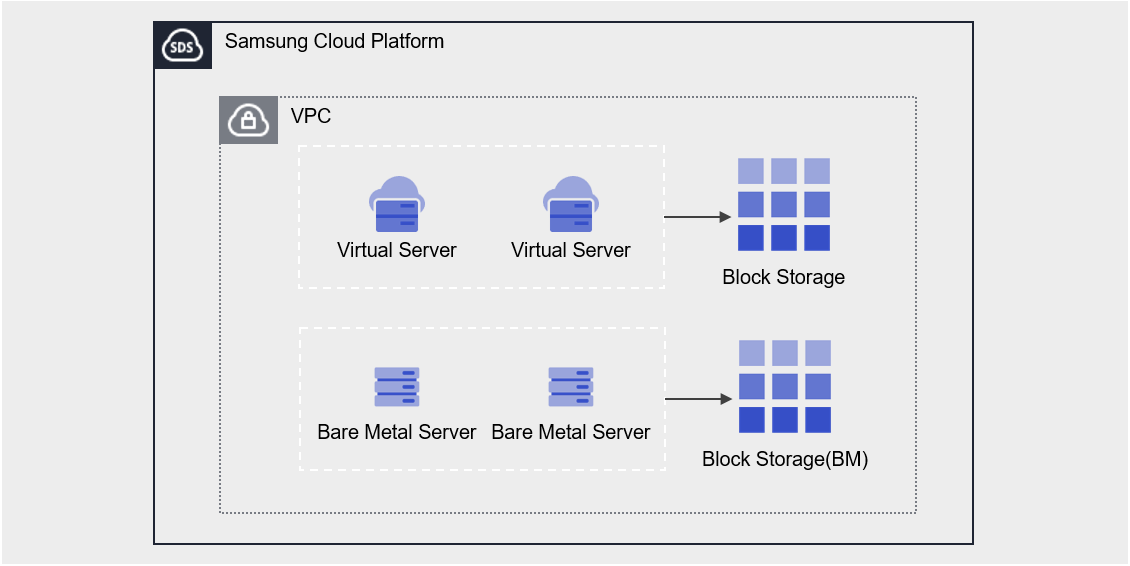
Provided Features
Block Storage provides the following features.
- Volume Name: Users can set or edit names for each volume.
- Capacity: Volumes can be created with capacities ranging from a minimum of 8 GB up to a maximum of 12 TB, and can be expanded during use. The OS default volume can be created with at least the minimum capacity for each image.
- Connection Server: You can select a Virtual Server to connect or disconnect.
- Multi-Server Connection (Multi Attach): Connect to two or more servers, no limit on the number of servers per volume, and a Virtual Server can connect up to 26 volumes
- Encryption: All volumes of Block Storage have AES-256 algorithm encryption applied by default, and if the volume is HDD/SSD_KMS disk type, it additionally provides transmission encryption for the Block Storage segment connected to the instance and the instance.
- Snapshot: Through the image snapshot feature, recovery of changed and deleted data is possible. Users select a snapshot created at the point in time they wish to recover from the list and recover it.
- Volume Transfer: Through the volume transfer feature, you can transfer the volume to another Account.
- Monitoring: IOPS, Latency, Throughput, usage, etc. Monitoring information can be checked through the Cloud Monitoring service.
Components
You can enter the capacity and select the disk type to create a volume according to the user’s service scale and performance requirements. When using the snapshot feature, you can restore data to the point in time you want to recover.
Volume
Volume (Volume) is the basic creation unit of the Block Storage service and is used as data storage space. Users select name, capacity, and disk type to create a volume, then attach it to a Virtual Server for use.
The volume name creation rules are as follows.
Reference
Use English letters, numbers, spaces, and special characters (
-, _) and enter within 255 characters.Snapshot
A snapshot is an image backup of a volume at a specific point in time. Users can view the snapshot name and creation date in the snapshot list to select the snapshot they want to restore, and can recover data that was changed or deleted using that snapshot.
The notes for using snapshots are as follows.
Reference
- The snapshot creation time is based on Asia/Seoul (GMT +09:00).
- Select the snapshot recovery button to restore the Block Storage volume to the latest snapshot.
- If you select a specific snapshot from the snapshot list, you can recover by creating a new volume based on the snapshot.
- Snapshots are charged based on the size of the original Block Storage, so please delete unnecessary snapshots.
Preceding Service
This is a list of services that must be pre-configured before creating the service. For details, refer to the guide provided for each service and prepare in advance.
| Service Category | Service | Detailed Description |
|---|---|---|
| Compute | Virtual Server | Virtual server optimized for cloud computing |
Table. Block Storage Preceding Service
8.1.1 - Monitoring Metrics
Block Storage monitoring metrics
The table below shows the monitoring metrics of Block Storage that can be checked through Cloud Monitoring. For detailed usage of Cloud Monitoring, refer to the Cloud Monitoring guide.
| Performance Item Name | Description | Unit |
|---|---|---|
| Volume Total | Total Bytes | bytes |
| IOPS [Read] | iops(reading) | iops |
| IOPS [Write] | iops(writing) | iops |
| Latency Time [Read] | Delay Time (Read) | usec |
| Latency Time [write] | Delay Time (write) | usec |
| Throughput [Read] | Throughput (Read) | bytes/s |
| Throughput [Write] | Throughput (Write) | bytes/s |
Table. Block Storage monitoring metrics
8.2 - How-to guides
The user can enter the required information for Block Storage through the Samsung Cloud Platform Console, select detailed options, and create the service.
Create Block Storage
You can create and use the Block Storage service in the Samsung Cloud Platform Console.
To create Block Storage, follow the steps below.
All Services > Compute > Virtual Server Click the menu. Navigate to the Service Home page of Virtual Server.
Block Storage Click the menu. Navigate to the Block Storage List page.
Click the Create Service button on the Block Storage page. You will be taken to the Create Block Storage page.
Block Storage Creation On the page, enter the information required to create the service, and select detailed options.
Category RequiredDetailed description Volume Name Required Volume Name - Enter up to 255 characters using English letters, numbers, spaces, and special characters (
-,_)
Snapshot Name Select Select a snapshot to use when creating a volume via snapshot - Provide the recovery snapshot name when creating a service through snapshot recovery volume creation
- If not selected, an empty volume is created
- After selection, can delete by clicking the X button next to the name
Disk Type Required Select Disk Type - HDD: Standard volume
- SSD: High-performance standard volume
- HDD/SSD_KMS: Volume that additionally provides in-transit encryption between the instance and Block Storage
- HDD/SSD_MultiAttach: Volume that can be attached to two or more servers
- Cannot be modified after service creation
- When creating the service via snapshot recovery volume creation, it is set identical to the original and cannot be modified
Capacity Select Capacity Settings - Can be created within 8~12,228 GB
- Enter the number of units provided in 8 GB increments
- When creating a service via snapshot recovery volume creation, input a capacity that is equal to or larger than the original
Table. Block Storage Service Information Input Items- Enter up to 255 characters using English letters, numbers, spaces, and special characters (
Summary Check the detailed information and estimated billing amount generated in the panel, and click the Complete button.
- Once creation is complete, check the created resource on the Block Storage List page.
Reference
- All volumes of Block Storage have AES-256 AES-256 algorithm encryption applied by default.
- Windows-based Virtual Server cannot use MultiAttach disks. Use a separate replication method or solution.
- If the volume is HDD/SSD_KMS disk type, it additionally provides transmission encryption for the block storage segment connected to the instance and the instance.
Caution
HDD/SSD_KMS Using this disk type may result in about a 60% performance degradation.
Block Storage Check Detailed Information
Block Storage 서비스는 전체 자원 목록과 상세 정보를 확인하고 수정할 수 있습니다. Block Storage 상세 페이지는 상세 정보, 스냅샷 목록, 태그, 작업 이력 탭으로 구성되어 있습니다.
To view detailed information about the Block Storage service, follow these steps.
- All Services > Compute > Virtual Server Click the menu. Navigate to the Service Home page of Virtual Server.
- Click the Block Storage menu. Go to the Block Storage List page.
- Click the resource to view detailed information on the Block Storage List page. It moves to the Block Storage Details page.
- Block Storage Details page displays status information and additional feature information, and consists of Details, Snapshot List, Tags, Operation History tabs.
Category Detailed description Volume Status Status of the volume - Creating: Creating
- Downloading: Creating (applying OS image)
- Available: Creation completed, server connection possible
- Reserved: Waiting for server connection
- Attaching: Connecting to server
- Detaching: Server connection released
- In Use: Server connection completed
- Deleting: Service termination in progress
- Awaiting Transfer: Waiting for volume transfer
- Extending: Capacity expansion
- Error Extending: Abnormal state during capacity expansion
- Backing Up: Volume backup in progress
- Restoring Backup: Volume backup restoration in progress
- Error Backing Up: Abnormal state of volume backup
- Error Restoring: Abnormal state of volume backup restoration
- Error Deleting: Abnormal state during deletion
- Error Managing: Abnormal state
- Error: Abnormal state
- Maintenance: Temporary maintenance state
- Reverting: Snapshot restoration in progress
Volume Transfer Transfer the volume to another account - For detailed information about volume transfer, refer to Volume Transfer
Snapshot Creation Immediately create a snapshot at the time of creation - For detailed information on snapshot creation, see Create Snapshot
Snapshot Recovery Recover the volume with the latest snapshot in Available state - For detailed information about snapshot recovery, see Snapshot Recovery
Service Cancellation Button to cancel the service Table. Status Information and Additional Functions
- Block Storage Details page displays status information and additional feature information, and consists of Details, Snapshot List, Tags, Operation History tabs.
Detailed Information
Block Storage list page, you can view detailed information of the selected resource and edit the information if needed.
| Category | Detailed Description |
|---|---|
| service | service group |
| Resource Type | Resource Type |
| SRN | Unique resource ID in Samsung Cloud Platform
|
| Resource Name | Resource Name
|
| Resource ID | Unique resource ID of the service |
| Creator | User who created the service |
| Creation time | Time when the service was created |
| Editor | User who modified the service |
| Modification Date/Time | Date/Time the service was modified |
| Volume Name | Volume Name
|
| Volume ID | Volume Unique ID |
| Disk type | Disk type |
| Type | Classification by volume creation method and usage |
| Capacity | Volume Capacity
|
| Connected Server | Connected Virtual Server
|
Table. Block Storage detailed information items
Reference
A volume that includes vProtect is a temporary volume created when using the Backup service, and no charges are applied.
Snapshot List
Block Storage List page allows you to view the snapshot of the selected resource.
| Category | Detailed description |
|---|---|
| Snapshot name | Snapshot name |
| Description | Snapshot description |
| Volume Capacity | Capacity of the original Block Storage volume targeted for snapshot
|
| Creation Time | Snapshot Creation Time |
| Status | Snapshot status
|
| Additional Features > More | Snapshot Management Button
|
Table. Snapshot List Tab Detailed Information Items
Caution
- Snapshots can affect volume capacity management. Delete unnecessary snapshots after use.
- Snapshot recovery is possible when not connected to the server.
Reference
- The snapshot creation time is based on Asia/Seoul (GMT +09:00).
- When the snapshot recovery button is clicked, the volume is restored to the latest snapshot in Available state.
- When selecting to create a recovery volume on the snapshot list page, a new volume based on the snapshot is created without modifying the existing volume.
- Snapshots containing vProtect are temporary snapshots created when using the Backup service and are not charged.
Tag
Block Storage List page allows you to view the tag information of selected resources, and you can add, modify, or delete them.
| Category | Detailed Description |
|---|---|
| Tag List | Tag List
|
Table. Block Storage Tag Tab Items
Work History
You can view the operation history of the selected resource on the Block Storage List page.
| Category | Detailed description |
|---|---|
| Work History List | Resource Change History
|
Table. Work History Tab Detailed Information Items
Block Storage Resource Management
If you need to modify the settings of a created Block Storage or add or delete a connected server, you can perform the tasks on the Block Storage Details page.
Edit Volume Name
You can edit the name of the volume. To edit the volume name, follow the steps below.
- All Services > Compute > Virtual Server menu, click it. Navigate to the Virtual Server’s Service Home page.
- Block Storage Click the menu. Navigate to the Block Storage List page.
- Block Storage List page, click the resource to edit the volume name. Block Storage Details page, navigate.
- Click the Volume name Edit button. The Volume name Edit popup opens.
- Enter the volume name and click the Confirm button.
Reference
Enter within 255 characters using letters, numbers, spaces, and special characters (
-, _).Increase Capacity
You can increase the volume capacity. To increase the capacity, follow the steps below.
- All Services > Compute > Virtual Server Click the menu. Navigate to the Service Home page of Virtual Server.
- Click the Block Storage menu. Go to the Block Storage List page.
- Block Storage List page, click the resource to expand the capacity. Block Storage Details page, navigate.
- Click the Capacity Edit button. The Capacity Edit popup window opens.
- Enter the capacity and click the Confirm button.
Caution
- We do not provide size reduction.
- After capacity expansion, it cannot be restored from a snapshot taken before the expansion.
- Only recovery using the new volume creation method is possible with snapshots created before capacity expansion.
Reference
- Within 8~12,228GB, it can be expanded to a larger capacity than the existing capacity.
- Enter the number of Units provided in 8GB increments.
Edit Connected Server
You can connect or disconnect the server. To modify the connected server, follow the steps below.
- All Services > Compute > Virtual Server Click the menu. Navigate to the Service Home page of Virtual Server.
- Click the Block Storage menu. You will be taken to the Block Storage List page.
- Click the resource to edit the connected server on the Block Storage List page. You will be taken to the Block Storage Detail page.
- When adding a Virtual Server connection, click the Connection Server item’s Add button. The Add Connection Server popup window opens.
- After selecting the Virtual Server you want to connect to, click the Confirm button.
- When disconnecting the Virtual Server, click the Connection Server Disconnect button.
- Please perform the disconnection after the disconnect operation (Umount, Disk Offline) on the server.
Caution
Connect to the server and be sure to perform the disconnect operation (Umount, Disk Offline) before releasing the connected server. If you release without OS operations, a status error (Hang) may occur on the connected server. For detailed information on disconnecting the server, refer to Disconnect Server.
Reference
- You can connect a Virtual Server created in the same location as Block Storage.
- Virtual Server that uses Partition with Server Group policy cannot be connected.
- For HDD/SSD_MultiAttach disk type, it can be connected to more than two Virtual Servers, and there is no limit on the number of connections.
- Windows-based Virtual Server cannot use MultiAttach disks and must use a separate replication method or solution.
- Virtual Server can connect up to 26 volumes, including the OS default.
- OS basic volume cannot be modified on the connected server nor can the service be terminated.
- When adding a connected server, you can use it after performing connection tasks (Mount, Disk Online) on the server. For detailed information about server connection, refer to Server Connection.
Block Storage Cancel
You can reduce operating costs by terminating unused Block Storage. However, if you terminate the service, the running service may be stopped immediately, so you should consider the impact of service interruption sufficiently before proceeding with the termination.
Caution
- Be careful as data cannot be recovered after termination.
- In the following case, the Block Storage volume cannot be terminated.
- Connecting to server
- OS default volume
- Connect Virtual Server’s Custom Image
- If the volume status is not Available, Error, Error Extending, Error Restoring, Error Managing
- If you select and cancel more than one volume, only the volumes that can be cancelled will be cancelled.
To cancel Block Storage, follow the steps below.
- All Services > Compute > Virtual Server Click the menu. Navigate to the Service Home page of Virtual Server.
- Click the Block Storage menu. You will be taken to the Block Storage List page.
- On the Block Storage List page, select the resource to cancel and click the Cancel Service button.
- When termination is complete, check on the Block Storage list page whether the resource has been terminated.
8.2.1 - Connecting to the Server
When using a volume on a server, connection or disconnection work is required.
From the Block Storage Details page, add the connection server and then connect to the server to perform the connection work (Mount, Disk Online). After use, perform the disconnection work (Umount, Disk Offline) and then remove the connection server.
Connecting to the Server (Mount, Disk Online)
To use the volume added to the connection server, you must connect to the server and perform the connection work (Mount, Disk Online). Follow the procedure below.
Linux Operating System
Server Connection Example Configuration
- Server OS: LINUX
- Mount location: /data
- Volume capacity: 24 GB
- File system: ext3, ext4, xfs etc
- Additional allocated disk: /dev/vdb
- Click the All Services > Compute > Virtual Server menu. Move to the Service Home page of Virtual Server.
- Click the Block Storage menu. Move to the Block Storage List page.
- On the Block Storage List page, click the resource to be used by the connection server. Move to the Block Storage Details page.
- Check the server in the Connection Server section and connect to it.
- Refer to the procedure below to connect (Mount) the volume.
Switch to root privileges
$ sudo -iCheck the disk
# lsblk NAME MAJ:MIN RM SIZE RO TYPE MOUNTPOINT vda 252:0 0 24G 0 disk ├─vda1 252:1 0 23.9G 0 part [SWAP] └─vda14 252:14 0 4M 0 part / └─vda15 252:15 0 106M 0 part /boot/efi vdb 252:16 0 24G 0 diskCreate a partition
# fdisk /dev/vdb Command (m for help): n Partition type: p primary (0 primary, 0 extended, 4 free) e extended Select (default p): p Partition number (1-4, default 1): 1 First sector (2048-50331646, default 2048): Last sector, +/-sectors or +/-size{K,M,G,T,P} (2048-50331646, default 50331646): Created a new partition 1 of type 'Linux' and of size 24 GiB. Command (m for help): w The partition table has been altered! Calling ioctl() to re-read partition table. Syncing disks.Set the partition format (e.g., ext4)
# lsblk NAME MAJ:MIN RM SIZE RO TYPE MOUNTPOINT vda 252:0 0 24G 0 disk ├─vda1 252:1 0 23.9G 0 part [SWAP] └─vda14 252:14 0 4M 0 part / └─vda15 252:15 0 106M 0 part /boot/efi vdb 252:16 0 24G 0 disk └─vdb1 252:17 0 24G 0 part # mkfs.ext4 /dev/vdb1 mke2fs 1.46.5 (30-Dec-2021) ... Writing superblocks and filesystem accounting information: doneMount the volume
# mkdir /data # mount /dev/vdb1 /data # lsblk NAME MAJ:MIN RM SIZE RO TYPE MOUNTPOINT vda 252:0 0 24G 0 disk ├─vda1 252:1 0 23.9G 0 part [SWAP] └─vda14 252:14 0 4M 0 part / └─vda15 252:15 0 106M 0 part /boot/efi vdb 252:16 0 24G 0 disk └─vdb1 252:17 0 24G 0 part /data # vi /etc/fstab (add) /dev/vdb1 /data ext4 defaults 0 0
| Item | Description |
|---|---|
| cat /etc/fstab | File system information file
|
| df -h | Check the total disk usage of the mounted disk |
| fdisk -l | Check partition information
|
Table. Mount Command Reference
| Command | Description |
|---|---|
| m | Check the usage of the fdisk command |
| n | Create a new partition |
| p | Check the changed partition information |
| t | Change the system ID of the partition |
| w | Save the partition information and exit the fdisk settings |
Table. Partition Creation Command (fdisk) Reference
Windows Operating System
- Click the All Services > Compute > Virtual Server menu. Move to the Service Home page of Virtual Server.
- Click the Block Storage menu. Move to the Block Storage List page.
- On the Block Storage List page, click the resource to be used by the connection server. Move to the Block Storage Details page.
- Check the server in the Connection Server section and connect to it.
- Refer to the procedure below to connect (Disk Online) the volume.
Right-click the Windows start icon and run Computer Management
In the Computer Management tree structure, select Storage > Disk Management
Check the disk
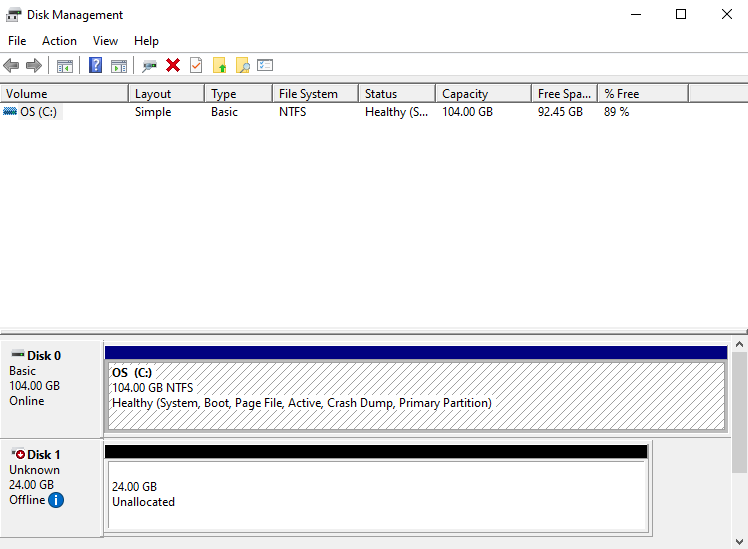
Bring the disk online
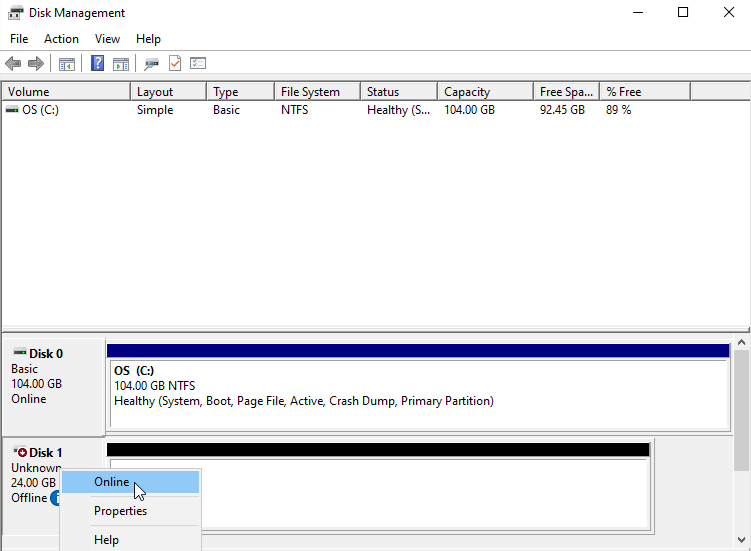
Initialize the disk
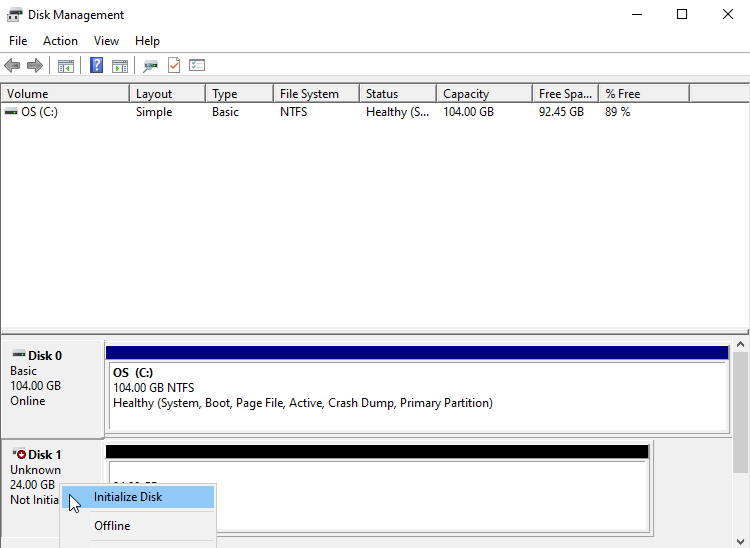
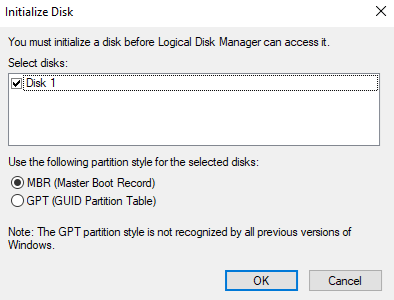
Format the partition
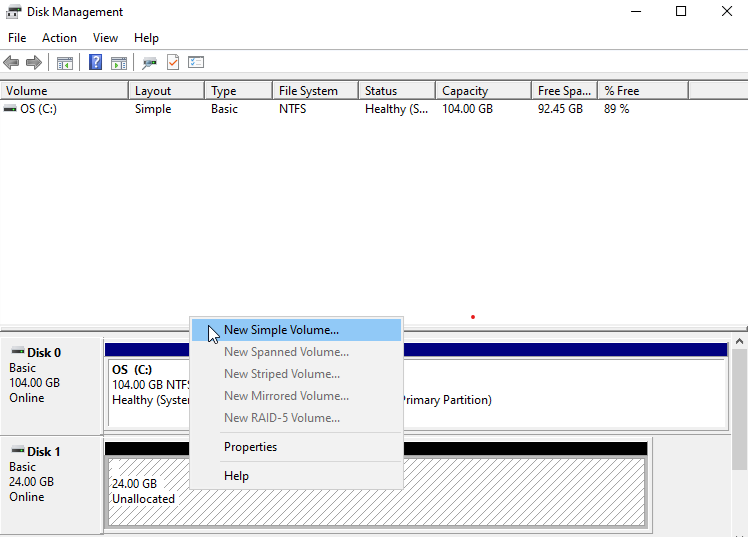
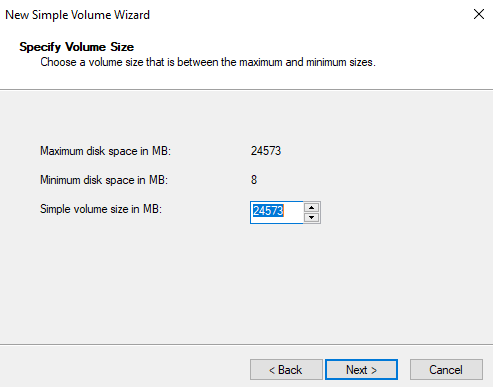

Check the volume
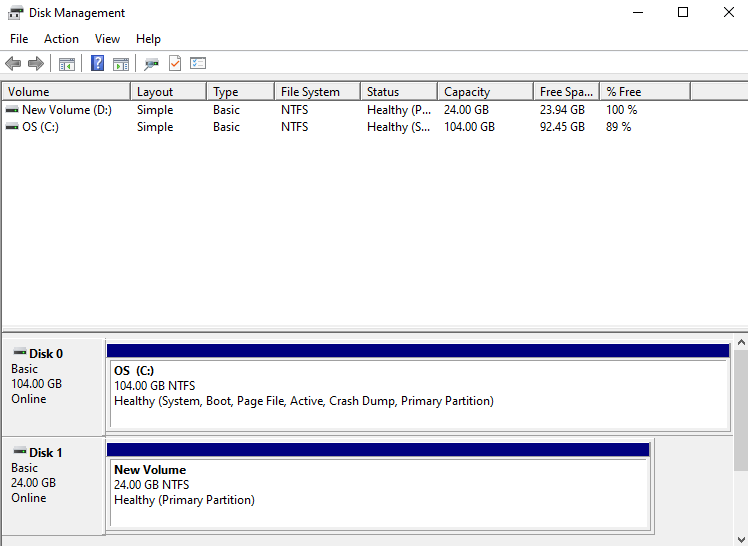
Disconnecting from the Server (Umount, Disk Offline)
Connect to the server and perform the disconnection work (Umount, Disk Offline), and then remove the connection server from the console.
Follow the procedure below.
Note
- If you disconnect the server from the console without performing the disconnection work (Umount, Disk Offline) on the server, a server status error (Hang) may occur.
- Be sure to perform the OS work first.
- For the OS basic volume, connection server modification and service termination are not allowed.
Linux Operating System
- Click the All Services > Compute > Virtual Server menu. Move to the Service Home page of Virtual Server.
- Click the Block Storage menu. Move to the Block Storage List page.
- On the Block Storage List page, click the resource to be disconnected from the connection server. Move to the Block Storage Details page.
- Check the server in the Connection Server section and connect to it.
- Refer to the procedure below to disconnect (Umount) the volume.
- Umount the volume
# umount /dev/vdb1 /data
# lsblk
NAME MAJ:MIN RM SIZE RO TYPE MOUNTPOINT
vda 252:0 0 24G 0 disk
├─vda1 252:1 0 23.9G 0 part [SWAP]
└─vda14 252:14 0 4M 0 part /
└─vda15 252:15 0 106M 0 part /boot/efi
vdb 252:16 0 24G 0 disk
└─vdb1 252:17 0 24G 0 part
# vi /etc/fstab
(delete) /dev/vdb1 /data ext4 defaults 0 0
Windows Operating System
Click the All Services > Compute > Virtual Server menu. Move to the Service Home page of Virtual Server.
Click the Block Storage menu. Move to the Block Storage List page.
On the Block Storage List page, click the resource to be disconnected from the connection server. Move to the Block Storage Details page.
Check the server in the Connection Server section and connect to it.
Unmount the file system.
Refer to the procedure below to disconnect (Disk Offline) the volume.
Right-click the Windows start icon and run Computer Management
In the Computer Management tree structure, select Storage > Disk Management
Right-click the disk to be removed and run Offline
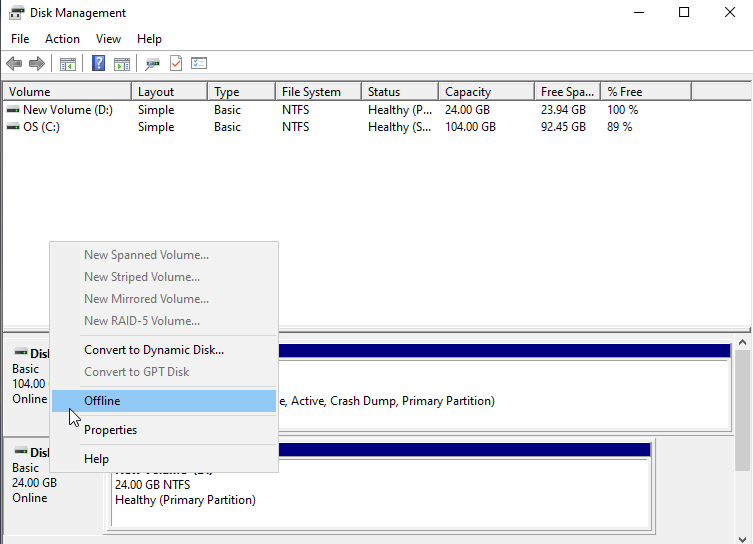
Check the disk status
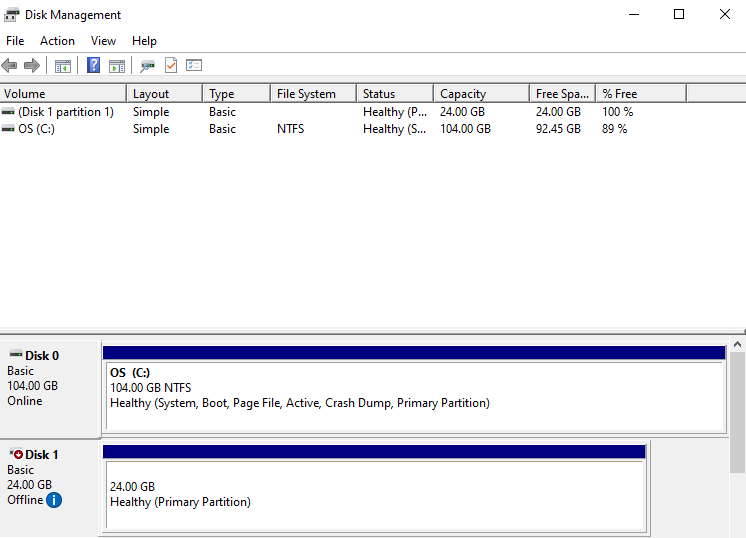
8.2.2 - Using Snapshots
You can create, delete, or restore snapshots of the created Block Storage using snapshots. You can perform actions on the Block Storage Details page and Snapshot List page.
Create Snapshot
You can create a snapshot of the current point in time. To create a snapshot, follow these steps.
- All Services > Compute > Virtual Server Click the menu. Navigate to the Service Home page of Virtual Server.
- Click the Block Storage menu. Go to the Block Storage List page.
- Block Storage List On the page, click the resource to create a snapshot. Block Storage Details Go to the page.
- Click the Create Snapshot button. The Create Snapshot popup window opens.
- Enter Snapshot Name and Description, then click the Confirm button. It creates a snapshot of the current point in time.
- Snapshot List Click the button. Block Storage Snapshot List Navigate to the page.
- Check the generated snapshot.
Caution
Snapshots are charged based on the size of the original Block Storage, so please delete unnecessary snapshots.
Reference
The snapshot creation time is based on Asia/Seoul (GMT +09:00).
Edit Snapshot
You can edit snapshot information. To edit the snapshot name or description, follow the steps below.
- All Services > Compute > Virtual Server Click the menu. Navigate to the Service Home page of Virtual Server.
- Block Storage Click the menu. Navigate to the Block Storage List page.
- Block Storage List page, click the resource to edit the snapshot information. You will be taken to the Block Storage Details page.
- Snapshot List Click the button. Block Storage Snapshot List Navigate to the page.
- After confirming the snapshot to edit, click the More button.
- Click the Edit button. The Edit Snapshot popup opens.
- Enter Snapshot name or Description and click the Confirm button.
Recover Snapshot
You can restore a Block Storage volume to the latest snapshot in Available state. To perform snapshot restoration, follow the steps below.
- All Services > Compute > Virtual Server Click the menu. Navigate to Virtual Server’s Service Home page.
- Click the Block Storage menu. Navigate to the Block Storage List page.
- Click the resource to recover from a snapshot on the Block Storage List page. You will be taken to the Block Storage Details page.
- Connection Server If there is a server added in the item, after connecting to the server, perform the disconnect operation (Umount, Disk Offline).
- For detailed information about server disconnection, please refer to Disconnect Server.
- Block Storage Details page, click the Disconnect button in the Connected Server item to remove the server. The connected server will be removed.
- For details on disconnecting the connection server, see Edit Connection Server.
- Snapshot List Click the button. Block Storage Snapshot List Navigate to the page.
- Check the latest snapshot in Available state. The volume will be restored with that snapshot.
- Click the Snapshot Recovery button. The Snapshot Recovery popup opens.
- After checking the Snapshot name and creation date/time, click the Confirm button.
- When recovery starts, it becomes Reverting, and when completed, it becomes Available.
- Detailed Information Click the page button. Block Storage Detailed Page will navigate to.
- Click the Add button of the Connected Server. Reconnect the Virtual Server.
- For detailed information about adding a connection server, please refer to Modify Connection Server.
- After connecting to the added server, perform the connection tasks (Mount, Disk Online) according to the operating system.
- For detailed information about server connection, please refer to Connect to Server.
Caution
- Snapshot recovery is possible when not connected to the server.
- If you want to recover using a snapshot that is not the latest snapshot, recovery is possible by creating a recovery volume.
- In the situation below, recovery is not possible.
- Block Storage when the volume is not in Available state
- Block Storage if there is a server connected to the volume
- If there are no recoverable snapshots
- If the latest snapshot changes during recovery creation
- If the latest snapshot is not in Available state
- If the snapshot’s volume size differs from the Block Storage volume size (when the volume has been expanded)
Create snapshot recovery volume
You can create a volume using a snapshot. To create a snapshot recovery volume, follow the steps below.
- All Services > Compute > Virtual Server Click the menu. Navigate to the Service Home page of Virtual Server.
- Click the Block Storage menu. You will be taken to the Block Storage list page.
- Click the resource to create a snapshot recovery volume on the Block Storage List page. You will be taken to the Block Storage Details page.
- Snapshot List Click the button. Block Storage Snapshot List Navigate to the page.
- After checking Snapshot name, description and Creation date/time, click the More button of the snapshot you want to restore.
- Click Create Recovery Volume. The Create Snapshot Recovery Volume popup opens.
- Click the Confirm button. You will be taken to the Create Block Storage page.
- Block Storage creation On the page, enter the information required to create the service, and select detailed options.
- Please enter the volume name and size. You can enter a size that is greater than or equal to the original volume.
- Disk type is set the same as the original and cannot be modified.
Category RequiredDetailed description Volume Name Required Volume Name - Enter up to 255 characters using English letters, numbers, spaces, and special characters (
-,_)
Disk Type Required Select Disk Type - HDD: Standard volume
- SSD: High-performance standard volume
- HDD/SSD_KMS: Volume that additionally provides transmission encryption between the instance and Block Storage
- HDD/SSD_MultiAttach: Volume that can be attached to more than one server
- Cannot be modified after service creation
- When creating a service via snapshot recovery volume creation, it is set identical to the original and cannot be modified
Capacity Select Capacity Setting - Can be created within 8~12,228GB
- Enter the number of units provided in 8GB increments
- When creating a service via snapshot recovery volume creation, input a capacity equal to or larger than the original
Recovery Snapshot Name Optional Name of the recovery snapshot used when creating the volume - Provides the recovery snapshot name when creating a service through snapshot recovery volume creation
Table. Block Storage Service Information Input Items - Enter up to 255 characters using English letters, numbers, spaces, and special characters (
- Summary Check the detailed information and estimated billing amount generated in the panel, and click the Complete button.
- Once creation is complete, check the created resource on the Block Storage List page.
Delete Snapshot
You can select a snapshot to delete. To delete a snapshot, follow these steps.
- All Services > Compute > Virtual Server Click the menu. Go to the Service Home page of Virtual Server.
- Click the Block Storage menu. Go to the Block Storage List page.
- Block Storage List on the page, click the resource to delete the snapshot. Block Storage Details navigate to the page.
- Snapshot List button, click it. Block Storage Snapshot List page, navigate to it.
- After checking the snapshot name, description and creation date/time, click the more button of the snapshot you want to delete.
- Delete Click the button. Snapshot List page, the snapshot will be removed.
8.2.3 - Move Volume
You can move the volume to a different Account, and if you move it, the volume will be removed from the existing location. You can perform volume migration from the Block Storage list or Block Storage detail page.
Volume previous
You can move a volume to a different account within the region. To move a volume, follow these steps.
- Click All services > Compute > Virtual Server menu. It moves to the Service Home page of Virtual Server.
- Block Storage menu is clicked. It moves to the Block Storage list page.
- Block Storage list page, select the resource to be moved, and then click the More > Move Volume button at the top left of the list.
- or click the Volume Migration button at the top of the Block Storage details page of the resource to be migrated.
- When the pop-up window for volume migration appears, check the volume name you want to migrate and click the Confirm button.
- When the popup window for previous completion opens, click the Confirm button. The Volume Transfer ID and Approval Key information will be downloaded as a text file.
- The volume will be changed to Awaiting Transfer status.
Caution
- Volume migration is possible within the same region.
- Volume migration is only possible when the volume is in the Available state. If it is in the In Use state, release all connected servers.
Volume rollback cancel
The volume move can be cancelled after it is created. To cancel the volume move, follow these steps.
- Click All services > Compute > Virtual Server menu. It moves to the Service Home page of Virtual Server.
- Block Storage menu is clicked. It moves to the Block Storage list page.
- Block Storage list page, click the resource to cancel the volume move. It moves to the Block Storage detail page.
- You can cancel if the volume is in the Awaiting Transfer state.
- Click the Volume Move Cancel button. The Volume Move Cancel popup window will open.
- Check the volume name you want to cancel the volume move and click the Confirm button.
- The volume will be changed to Available status.
Get previous volume
You can receive volumes from other accounts within the region. To receive a volume, follow these steps.
- Click All Services > Compute > Virtual Server menu. It moves to the Service Home page of Virtual Server.
- Block Storage menu is clicked. It moves to the Block Storage list page.
- On the Block Storage list page, click the More > Receive Volume Transfer button in the upper left corner of the list. The Receive Volume Transfer popup window opens.4. Volume Migration Enter the Volume Migration ID and Approval Key provided when creating the volume migration.
- Block Storage list page will have the volume created.
Notice
- It may take some time for the changes to be reflected.
- The account that created the volume transfer will have the transferred volume removed.
8.3 - API Reference
API Reference
8.4 - CLI Reference
CLI Reference
8.5 - Release Note
Block Storage
2025.07.01
FEATURE
Snapshot Billing Policy Change and Monitoring Linkage- The snapshot is charged based on the size of the original Block Storage.
- It has been linked with Cloud Monitoring.
- You can check IOPS, Latency, Throughput information in Cloud Monitoring.
2025.02.27
FEATURE
Block Storage disk type added- Block Storage feature change
- The HDD disk type has been added, and you can select the added type (HDD, HDD_MultiAttach, HDD_KMS) according to the purpose.
- Samsung Cloud Platform common feature changes
- Account, IAM and Service Home, tags, etc. reflected common CX changes.
2024.10.01
NEW
Block Storage Service Official Version Release- SSD_KMS disk type has been added.
- When SSD_KMS is selected, encryption through the KMS (Key Management Service) encryption key is added.
- Released a high-performance storage service suitable for handling large-scale data and database workloads.
2024.07.02
NEW
Beta version release- Released a high-performance storage service suitable for handling large-scale data and database workloads.