This is the multi-page printable view of this section. Click here to print.
Vertica(DBaaS)
- 1: Overview
- 1.1: Server type
- 1.2: Monitoring metrics
- 1.3: ServiceWatch metric
- 2: How-to guides
- 3: API Reference
- 4: CLI Reference
- 5: Release Note
1 - Overview
Service Overview
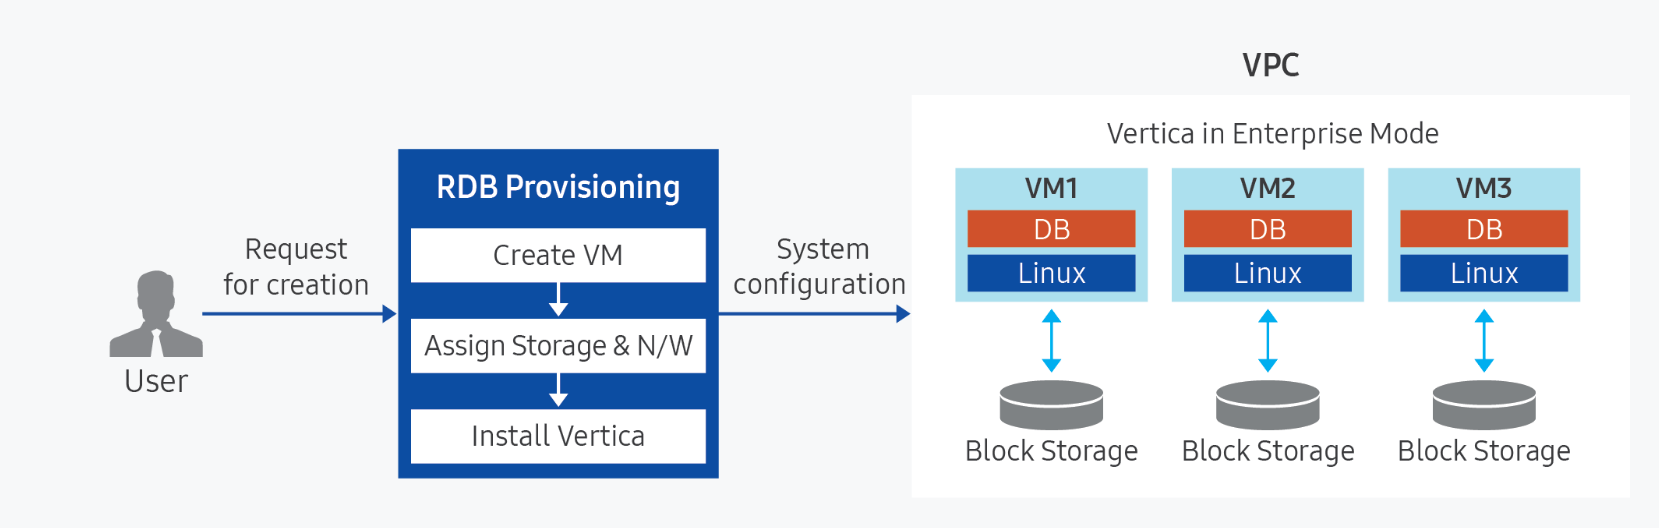
Vertica(DBaaS) is a high-availability enterprise database built on a Data Warehouse for large-scale data analysis and processing. Through a single engine, it serves as a data analytics platform that can perform basic analyses such as querying data from various sources without moving them, as well as AI analyses like machine learning. In the Samsung Cloud Platform, DB management functions such as high‑availability configuration, backup/recovery, patching, parameter management, and monitoring are added to ensure stable management of single instances or critical data, enabling automation of tasks throughout the database lifecycle. Additionally, it provides an automatic backup feature at user‑specified times to support data recovery at the desired point in case of DB server or data issues.
Service Architecture Diagram
Provided features
Vertica(DBaaS) provides the following features.
- Auto Provisioning (Auto Provisioning): Automatically installs the standard version of the Samsung Cloud Platform database based on Virtual Servers of various specifications.
- Cluster Configuration: Provides a self-high-availability architecture in a masterless form.
- Operation Control Management: Provides functionality to control the status of running servers. You can start or stop a server, and it can be restarted if there is a database issue or to apply configuration changes.
- Backup and Recovery: Provides data backup functionality based on proprietary backup commands. Users can set the backup retention period and start time, and additional fees apply based on backup size. It also offers a recovery feature for backed‑up data; when a user initiates recovery, a separate database is created and restored to the point selected by the user (backup creation time or a custom point). For database recovery, you can choose to install the Management Console for use.
- Service Status Query: You can view the final status of the current DB service.
- Monitoring: CPU, memory, DB performance monitoring information can be accessed through the Cloud Monitoring service.
- High-Performance Processing of Large-Scale Data: It guarantees stable performance in a Mixed Workload environment of massive parallel processing (MPP, Massively Parallel Processing) and SQL queries. Vertica processes queries through distributed processing and is designed so that queries can be initiated from any node, eliminating a Single Point of Failure where queries would not execute if a specific node fails.
Component
Vertica(DBaaS) provides pre‑validated engine versions and various server types. Users can select and use them according to the scale of the service they wish to configure.
Engine version
The engine versions supported by Vertica (DBaaS) are as follows.
Technical support can be used until the supplier’s EoTS (End of Technical Service) date, and the EOS date when new creation is halted is set to six months before the EoTS date.
The EOS and EoTS dates may change according to the supplier’s policy, so please refer to the supplier’s license management policy page for details.
| Provided version | EOS date (Samsung Cloud Platform new creation stop date) | EoTS date (supplier technical support end date) |
|---|---|---|
| 24.2.0-2 | 2026-09 (planned) | 2027-04-30 |
Server type
The server types supported by Vertica (DBaaS) are as follows.
For detailed information about the server types provided by Vertica (DBaaS), see Vertica Server Types.
| Category | example | Detailed description |
|---|---|---|
| Server type | Standard | Provided server types
|
| Server specifications | Db1 | Provided server specifications
|
| Server specifications | V2 | Number of vCores
|
| Server specifications | M4 | Memory capacity
|
Preliminary Service
This is a list of services that must be pre-configured before creating the service. Please refer to the guide provided for each service and prepare in advance.
| Service Category | service | Detailed description |
|---|---|---|
| Networking | VPC | A service that provides an isolated virtual network in a cloud environment |
1.1 - Server type
Vertica(DBaaS) server type
Vertica (DBaaS) provides server types composed of various combinations of CPU, memory, and network bandwidth. When creating Vertica(DBaaS), the Database Engine is installed based on the server type chosen for the intended use.
The server types supported by Vertica (DBaaS) are as follows.
Standard db1v2m4
Category | Example | Detailed description |
|---|---|---|
| Server type | Standard | Provided server type categories
|
| Server specifications | db1 | Provided server type classification and generation
|
| 서버 사양 | v2 | Number of vCores
|
| Server specifications | m4 | Memory capacity
|
db1 server type
The db1 server type of Vertica (DBaaS) is offered with standard specifications (vCPU, Memory) and is suitable for various database workloads.
- Intel 3rd Generation (Ice Lake) Xeon Gold 6342 Processor up to 3.3 GHz
- Supports up to 16 vCPUs and 256 GB of memory
- Maximum networking speed of 12.5 Gbps
| Category | Server type | vCPU | Memory | Network Bandwidth |
|---|---|---|---|---|
| Standard | db1v1m2 | 1 vCore | 2 GB | Up to 10 Gbps |
| Standard | db1v2m4 | 2 vCore | 4 GB | Up to 10 Gbps |
| Standard | db1v2m8 | 2 vCore | 8 GB | Up to 10 Gbps |
| Standard | db1v2m16 | 2 vCore | 16 GB | Up to 10 Gbps |
| Standard | db1v2m24 | 2 vCore | 24 GB | Up to 10 Gbps |
| Standard | db1v2m32 | 2 vCore | 32 GB | Up to 10 Gbps |
| Standard | db1v4m8 | 4 vCore | 8 GB | Up to 10 Gbps |
| Standard | db1v4m16 | 4 vCore | 16 GB | Up to 10 Gbps |
| Standard | db1v4m32 | 4 vCore | 32 GB | Up to 10 Gbps |
| Standard | db1v4m48 | 4 vCore | 48 GB | Up to 10 Gbps |
| Standard | db1v4m64 | 4 vCore | 64 GB | Up to 10 Gbps |
| Standard | db1v6m12 | 6 vCore | 12 GB | Up to 10 Gbps |
| Standard | db1v6m24 | 6 vCore | 24 GB | Maximum 10 Gbps |
| Standard | db1v6m48 | 6 vCore | 48 GB | Up to 10 Gbps |
| Standard | db1v6m72 | 6 vCore | 72 GB | Up to 10 Gbps |
| Standard | db1v6m96 | 6 vCore | 96 GB | Up to 10 Gbps |
| Standard | db1v8m16 | 8 vCore | 16 GB | Up to 10 Gbps |
| Standard | db1v8m32 | 8 vCore | 32 GB | Up to 10 Gbps |
| Standard | db1v8m64 | 8 vCore | 64 GB | Up to 10 Gbps |
| Standard | db1v8m96 | 8 vCore | 96 GB | Up to 10 Gbps |
| Standard | db1v8m128 | 8 vCore | 128 GB | Up to 10 Gbps |
| Standard | db1v10m20 | 10 vCore | 20 GB | Up to 10 Gbps |
| Standard | db1v10m40 | 10 vCore | 40 GB | Up to 10 Gbps |
| Standard | db1v10m80 | 10 vCore | 80 GB | Up to 10 Gbps |
| Standard | db1v10m120 | 10 vCore | 120 GB | Up to 10 Gbps |
| Standard | db1v10m160 | 10 vCore | 160 GB | Up to 10 Gbps |
| Standard | db1v12m24 | 12 vCore | 24 GB | Up to 12.5 Gbps |
| Standard | db1v12m48 | 12 vCore | 48 GB | Up to 12.5 Gbps |
| Standard | db1v12m96 | 12 vCore | 96 GB | Up to 12.5 Gbps |
| Standard | db1v12m144 | 12 vCore | 144 GB | Up to 12.5 Gbps |
| Standard | db1v12m192 | 12 vCore | 192 GB | Maximum 12.5 Gbps |
| Standard | db1v14m28 | 14 vCore | 28 GB | Up to 12.5 Gbps |
| Standard | db1v14m56 | 14 vCore | 56 GB | Up to 12.5 Gbps |
| Standard | db1v14m112 | 14 vCore | 112 GB | Up to 12.5 Gbps |
| Standard | db1v14m168 | 14 vCore | 168 GB | Up to 12.5 Gbps |
| Standard | db1v14m224 | 14 vCore | 224 GB | Up to 12.5 Gbps |
| Standard | db1v16m32 | 16 vCore | 32 GB | Up to 12.5 Gbps |
| Standard | db1v16m64 | 16 vCore | 64 GB | Up to 12.5 Gbps |
| Standard | db1v16m128 | 16 vCore | 128 GB | Up to 12.5 Gbps |
| Standard | db1v16m192 | 16 vCore | 192 GB | Up to 12.5 Gbps |
| Standard | db1v16m256 | 16 vCore | 256 GB | Up to 12.5 Gbps |
db2 server type
Vertica(DBaaS) provides the db2 server type with standard specifications (vCPU, Memory) and is suitable for various database workloads.
- Intel 4th‑generation (Sapphire Rapids) Xeon Gold 6448H Processor up to 3.2 GHz
- Supports up to 16 vCPUs and 256 GB of memory
- Maximum networking speed of 12.5 Gbps
| Category | Server type | vCPU | Memory | Network Bandwidth |
|---|---|---|---|---|
| Standard | db2v1m2 | 1 vCore | 2 GB | Maximum 10 Gbps |
| Standard | db2v2m4 | 2 vCore | 4 GB | Up to 10 Gbps |
| Standard | db2v2m8 | 2 vCore | 8 GB | Up to 10 Gbps |
| Standard | db2v2m16 | 2 vCore | 16 GB | Up to 10 Gbps |
| Standard | db2v2m24 | 2 vCore | 24 GB | Up to 10 Gbps |
| Standard | db2v32m32 | 2 vCore | 32 GB | Maximum 10 Gbps |
| Standard | db2v4m8 | 4 vCore | 8 GB | Up to 10 Gbps |
| Standard | db2v4m16 | 4 vCore | 16 GB | Up to 10 Gbps |
| Standard | db2v4m32 | 4 vCore | 32 GB | Up to 10 Gbps |
| Standard | db2v4m48 | 4 vCore | 48 GB | Up to 10 Gbps |
| Standard | db2v4m64 | 4 vCore | 64 GB | Up to 10 Gbps |
| Standard | db2v6m12 | 6 vCore | 12 GB | Up to 10 Gbps |
| Standard | db2v6m24 | 6 vCore | 24 GB | Up to 10 Gbps |
| Standard | db2v6m48 | 6 vCore | 48 GB | Up to 10 Gbps |
| Standard | db2v6m72 | 6 vCore | 72 GB | Up to 10 Gbps |
| Standard | db2v6m96 | 6 vCore | 96 GB | Up to 10 Gbps |
| Standard | db2v8m16 | 8 vCore | 16 GB | Up to 10 Gbps |
| Standard | db2v8m32 | 8 vCore | 32 GB | Up to 10 Gbps |
| Standard | db2v8m64 | 8 vCore | 64 GB | Up to 10 Gbps |
| Standard | db2v8m96 | 8 vCore | 96 GB | Up to 10 Gbps |
| Standard | db2v8m128 | 8 vCore | 128 GB | Up to 10 Gbps |
| Standard | db2v10m20 | 10 vCore | 20 GB | Up to 10 Gbps |
| Standard | db2v10m40 | 10 vCore | 40 GB | Up to 10 Gbps |
| Standard | db2v10m80 | 10 vCore | 80 GB | Up to 10 Gbps |
| Standard | db2v10m120 | 10 vCore | 120 GB | Up to 10 Gbps |
| Standard | db2v10m160 | 10 vCore | 160 GB | Up to 10 Gbps |
| Standard | db2v12m24 | 12 vCore | 24 GB | Up to 12.5 Gbps |
| Standard | db2v12m48 | 12 vCore | 48 GB | Up to 12.5 Gbps |
| Standard | db2v12m96 | 12 vCore | 96 GB | Up to 12.5 Gbps |
| Standard | db2v12m144 | 12 vCore | 144 GB | Up to 12.5 Gbps |
| Standard | db2v12m192 | 12 vCore | 192 GB | Up to 12.5 Gbps |
| Standard | db2v14m28 | 14 vCore | 28 GB | Up to 12.5 Gbps |
| Standard | db2v14m56 | 14 vCore | 56 GB | Up to 12.5 Gbps |
| Standard | db2v14m112 | 14 vCore | 112 GB | Up to 12.5 Gbps |
| Standard | db2v14m168 | 14 vCore | 168 GB | Up to 12.5 Gbps |
| Standard | db2v14m224 | 14 vCore | 224 GB | Up to 12.5 Gbps |
| Standard | db2v16m32 | 16 vCore | 32 GB | Up to 12.5 Gbps |
| Standard | db2v16m64 | 16 vCore | 64 GB | Up to 12.5 Gbps |
| Standard | db2v16m128 | 16 vCore | 128 GB | Up to 12.5 Gbps |
| Standard | db2v16m192 | 16 vCore | 192 GB | Up to 12.5 Gbps |
| Standard | db2v16m256 | 16 vCore | 256 GB | Up to 12.5 Gbps |
dbh2 server type
The dbh2 server type of Vertica (DBaaS) is provided with high-capacity server specifications and is suitable for database workloads that require large-scale data processing.
- Intel 4th‑generation (Sapphire Rapids) Xeon Gold 6448H Processor up to 3.2 GHz
- Supports up to 128 vCPUs and 1,536 GB of memory
- Maximum networking speed of 25 Gbps
| Server type | vCPU | Memory | Network Bandwidth | |
|---|---|---|---|---|
| High Capacity | dbh2v24m48 | 24 vCore | 48 GB | Maximum 25 Gbps |
| High Capacity | dbh2v24m96 | 24 vCore | 96 GB | Maximum 25 Gbps |
| High Capacity | dbh2v24m192 | 24 vCore | 192 GB | Maximum 25 Gbps |
| High Capacity | dbh2v24m288 | 24 vCore | 288 GB | Maximum 25 Gbps |
| High Capacity | dbh2v32m64 | 32 vCore | 64 GB | Maximum 25 Gbps |
| High Capacity | dbh2v32m128 | 32 vCore | 128 GB | Maximum 25 Gbps |
| High Capacity | dbh2v32m256 | 32 vCore | 256 GB | Maximum 25 Gbps |
| High Capacity | dbh2v32m384 | 32 vCore | 384 GB | Maximum 25 Gbps |
| High Capacity | dbh2v48m192 | 48 vCore | 192 GB | Maximum 25 Gbps |
| High Capacity | dbh2v48m576 | 48 vCore | 576 GB | Maximum 25 Gbps |
| High Capacity | dbh2v64m256 | 64 vCore | 256 GB | Maximum 25 Gbps |
| High Capacity | dbh2v64m768 | 64 vCore | 768 GB | Maximum 25 Gbps |
| High Capacity | dbh2v72m288 | 72 vCore | 288 GB | Maximum 25 Gbps |
| High Capacity | dbh2v72m864 | 72 vCore | 864 GB | Maximum 25 Gbps |
| High Capacity | dbh2v96m384 | 96 vCore | 384 GB | Maximum 25 Gbps |
| High Capacity | dbh2v96m1152 | 96 vCore | 1152 GB | Maximum 25 Gbps |
| High Capacity | dbh2v128m512 | 128 vCore | 512 GB | Maximum 25 Gbps |
| High Capacity | dbh2v128m1536 | 128 vCore | 1536 GB | Maximum 25 Gbps |
db3 server type
The db3 server type of Vertica (DBaaS) is offered with standard specifications (vCPU, Memory) and is suitable for various database workloads.
- Intel 6th‑generation (Granite Rapids) Xeon 6737P Processor up to 4.0 GHz
- Supports up to 16 vCPUs and 256 GB of memory
- Maximum networking speed of 12.5 Gbps
| Server type | vCPU | Memory | Network Bandwidth | |
|---|---|---|---|---|
| Standard | db3v2m4 | 2 vCore | 4 GB | Up to 10 Gbps |
| Standard | db3v2m8 | 2 vCore | 8 GB | Up to 10 Gbps |
| Standard | db3v2m16 | 2 vCore | 16 GB | Up to 10 Gbps |
| Standard | db3v24 | 2 vCore | 24 GB | Up to 10 Gbps |
| Standard | db3v2m32 | 2 vCore | 32 GB | Up to 10 Gbps |
| Standard | db3v4m8 | 4 vCore | 8 GB | Up to 10 Gbps |
| Standard | db3v4m16 | 4 vCore | 16 GB | Up to 10 Gbps |
| Standard | db3v4m32 | 4 vCore | 32 GB | Up to 10 Gbps |
| Standard | db3v4m48 | 4 vCore | 48 GB | Up to 10 Gbps |
| Standard | db3v4m64 | 4 vCore | 64 GB | Up to 10 Gbps |
| Standard | db3v6m12 | 6 vCore | 12 GB | Up to 10 Gbps |
| Standard | db3v6m24 | 6 vCore | 24 GB | Up to 10 Gbps |
| Standard | db3v6m48 | 6 vCore | 48 GB | Up to 10 Gbps |
| Standard | db3v6m72 | 6 vCore | 72 GB | Up to 10 Gbps |
| Standard | db3v6m96 | 6 vCore | 96 GB | Up to 10 Gbps |
| Standard | db3v8m16 | 8 vCore | 16 GB | Up to 10 Gbps |
| Standard | db3v8m32 | 8 vCore | 32 GB | Up to 10 Gbps |
| Standard | db3v8m64 | 8 vCore | 64 GB | Up to 10 Gbps |
| Standard | db3v8m96 | 8 vCore | 96 GB | Maximum 10 Gbps |
| Standard | db3v8m128 | 8 vCore | 128 GB | Up to 10 Gbps |
| Standard | db3v10m20 | 10 vCore | 20 GB | Maximum 10 Gbps |
| Standard | db3v10m40 | 10 vCore | 40 GB | Up to 10 Gbps |
| Standard | db3v10m80 | 10 vCore | 80 GB | Up to 10 Gbps |
| Standard | db3v10m120 | 10 vCore | 120 GB | Up to 10 Gbps |
| Standard | db3v10m160 | 10 vCore | 160 GB | Up to 10 Gbps |
| Standard | db3v12m24 | 12 vCore | 24 GB | Up to 12.5 Gbps |
| Standard | db3v12m48 | 12 vCore | 48 GB | Up to 12.5 Gbps |
| Standard | db3v12m96 | 12 vCore | 96 GB | Up to 12.5 Gbps |
| Standard | db3v12m144 | 12 vCore | 144 GB | Up to 12.5 Gbps |
| Standard | db3v12m192 | 12 vCore | 192 GB | Up to 12.5 Gbps |
| Standard | db3v14m28 | 14 vCore | 28 GB | Up to 12.5 Gbps |
| Standard | db3v14m56 | 14 vCore | 56 GB | Up to 12.5 Gbps |
| Standard | db3v14m112 | 14 vCore | 112 GB | Up to 12.5 Gbps |
| Standard | db3v14m168 | 14 vCore | 168 GB | Up to 12.5 Gbps |
| Standard | db3v14m224 | 14 vCore | 224 GB | Up to 12.5 Gbps |
| Standard | db3v16m32 | 16 vCore | 32 GB | Up to 12.5 Gbps |
| Standard | db3v16m64 | 16 vCore | 64 GB | Up to 12.5 Gbps |
| Standard | db3v16m128 | 16 vCore | 128 GB | Up to 12.5 Gbps |
| Standard | db3v16m192 | 16 vCore | 192 GB | Up to 12.5 Gbps |
| Standard | db3v16m256 | 16 vCore | 256 GB | Up to 12.5 Gbps |
dbh3 server type
The dbh3 server type of Vertica (DBaaS) is provided with high-capacity server specifications and is suitable for database workloads that require large-scale data processing.
- Intel 6th‑generation (Granite Rapids) Xeon 6738P Processor up to 4.1 GHz
- Supports up to 96 vCPUs and 1,152 GB of memory
- Maximum networking speed of 25 Gbps
| Category | Server type | vCPU | Memory | Network Bandwidth |
|---|---|---|---|---|
| High Capacity | dbh3v24m48 | 24 vCore | 48 GB | Maximum 25 Gbps |
| High Capacity | dbh3v24m96 | 24 vCore | 96 GB | Maximum 25 Gbps |
| High Capacity | dbh3v24m192 | 24 vCore | 192 GB | Maximum 25 Gbps |
| High Capacity | dbh3v24m288 | 24 vCore | 288 GB | Maximum 25 Gbps |
| High Capacity | dbh3v32m64 | 32 vCore | 64 GB | Maximum 25 Gbps |
| High Capacity | dbh3v32m128 | 32 vCore | 128 GB | Maximum 25 Gbps |
| High Capacity | dbh3v32m256 | 32 vCore | 256 GB | Maximum 25 Gbps |
| High Capacity | dbh3v32m384 | 32 vCore | 384 GB | Maximum 25 Gbps |
| High Capacity | dbh3v48m192 | 48 vCore | 192 GB | Maximum 25 Gbps |
| High Capacity | dbh3v48m576 | 48 vCore | 576 GB | Maximum 25 Gbps |
| High Capacity | dbh3v64m256 | 64 vCore | 256 GB | Maximum 25 Gbps |
| High Capacity | dbh3v64m768 | 64 vCore | 768 GB | Maximum 25 Gbps |
| High Capacity | dbh3v72m288 | 72 vCore | 288 GB | Maximum 25 Gbps |
| High Capacity | dbh3v72m864 | 72 vCore | 864 GB | Maximum 25 Gbps |
| High Capacity | dbh3v96m384 | 96 vCore | 384 GB | Maximum 25 Gbps |
| High Capacity | dbh3v96m1152 | 96 vCore | 1152 GB | Maximum 25 Gbps |
1.2 - Monitoring metrics
According to Samsung Cloud Platform’s policy, the Cloud Monitoring service is scheduled to be terminated.
Accordingly, services whose monitoring metrics are linked in Cloud Monitoring will no longer be able to monitor resources through Cloud Monitoring after the service improvement work in November 2026.
After that, resource monitoring can be continuously performed through the ServiceWatch service released in October 2025.
To ensure smooth service usage, proceed with the migration work according to the service termination schedule below.
Guide to Applying Monitoring Services by Resource
- New Resources: Resources created after the service improvement work in July 2026 are monitored by default using the ServiceWatch service.
- Existing resources: After the service improvement work in September 2026 We provide concurrent monitoring through Cloud Monitoring and ServiceWatch services.
- During the parallel operation period, we must prepare for the Servicewatch transition. *
Performance and log data backup, user-configured settings integrated with existing Cloud Monitoring (e. You must verify items such as event policies and perform tasks such as resetting the ServiceWatch service, then complete them.
Notice of the phased termination schedule for the Cloud Monitoring service
- Console menu termination (September 2026 service improvement work)
- You cannot access the Cloud Monitoring Console through the Console menu; you can only connect via the separate URLs for each region listed below.
- Console menu termination (September 2026 service improvement work)
| Offering | Region | Cloud Monitoring console URL |
|---|---|---|
| Enterprise | kr-west1 | https://console.kr-west1.e.samsungsdscloud.com/console/monitoring |
| Enterprise | kr-east1 | https://console.kr-east1.e.samsungsdscloud.com/console/monitoring |
| Samsung | kr-west1 | https://console.kr-west1.s.samsungsdscloud.com/console/monitoring |
| Samsung | kr-east1 | https://console.kr-east1.s.samsungsdscloud.com/console/monitoring |
| Sovereign | kr-south1 | https://console.kr-south1.g.samsungsdscloud.com/console/monitoring |
| Sovereign | kr-south2 | https://console.kr-south2.g.samsungscloud.com/console/monitoring |
| Sovereign | kr-south3 | https://console.kr-south3.g.samsungsdscloud.com/console/monitoring |
- Service termination (service improvement work in November 2026)
- All services of Cloud Monitoring, including the API, will be permanently discontinued.
- After the service ends in November, Cloud Monitoring data cannot be accessed. * Be sure to complete the ServiceWatch migration work within the parallel operation period**.
- All services of Cloud Monitoring, including the API, will be permanently discontinued.
Detailed information about ServiceWatch can be found in the ServiceWatch 개요.
Vertica(DBaaS) Monitoring Metrics
The table below shows the performance monitoring metrics for Vertica (DBaaS) that can be viewed through Cloud Monitoring. For detailed Cloud Monitoring usage, see the Cloud Monitoring guide.
The server monitoring metrics for Vertica (DBaaS) are described in the Virtual Server Monitoring Metrics guide.
| Performance items | Detailed description | unit |
|---|---|---|
| Active Locks | Number of Active Locks | cnt |
| Active Sessions | Total number of Sessions in Active state | cnt |
| Instance Status | Node alive status | status |
| Tablespace Used | Tablespace usage | bytes |
1.3 - ServiceWatch metric
Vertica sends metrics to ServiceWatch. The metrics provided by basic monitoring are data collected at 1‑minute intervals.
Basic Metrics
The following are the basic metrics for the Vertica(DBaaS) namespace.
The indicators whose names are shown in bold below are the key indicators selected from the basic indicators provided by Vertica(DBaaS). The key metrics are used to build service dashboards that are automatically created for each service in ServiceWatch.
Each metric provides guidance in the user guide on which statistical values are meaningful when viewing that metric, and among the meaningful statistics, the values shown in bold are the primary statistics. In the service dashboard, you can view key metrics through primary statistical values.
OS Basic Metrics
Classification | Performance items | unit | Detailed description | meaningful statistics |
|---|---|---|---|---|
| CPU | CPU Usage | Percent | CPU usage |
|
| Disk | Disk Usage | Percent | Disk usage |
|
| Disk | Disk Write Bytes | Bytes/Second | Write capacity (bytes/second) of block device |
|
| Disk | Disk Read Bytes | Bytes/Second | Read throughput (bytes/second) from block device |
|
| Disk | Disk Write Requests | Count/Second | Number of write requests on block device (requests per second) |
|
| Disk | Disk Read Requests | Count/Second | Number of read requests on block device (requests per second) |
|
| Disk | Average Disk I/O Queue Size | None | Average queue length of requests issued to the block device |
|
| Disk | Disk I/O Utilization | Percent | The proportion of time the block device actually spent processing I/O operations. |
|
| Memory | Memory Usage | Percent | Memory usage |
|
| Memory | Swap Out Bytes | Bytes/Second | Amount of data transferred from memory to swap area (bytes/second) |
|
| Memory | Swap Used Bytes | Bytes | Size of the currently used swap space |
|
| Memory | Swap Cached Usage | Percent | Cached swap usage rate |
|
| Memory | Swap Total Bytes | Bytes | Total swap space size configured on the system |
|
| Memory | Swap In Bytes | Bytes/Second | Amount read from swap area into memory (bytes/second) |
|
| Memory | Swap Usage | Percent | Current usage ratio relative to total swap space |
|
| Memory | Swap Cached Bytes | Bytes | Size of pages that have been restored to memory but still have a copy in the swap area |
|
| Memory | Swap Free Bytes | Bytes | Size of swap space that remains unused |
|
| Network | Network In Bytes | Bytes/Second | Received capacity (bytes/second) on the network interface |
|
| Network | Network Out Bytes | Bytes/Second | Transmitted capacity (bytes/second) on the network interface |
|
| Network | TCP Connections | Count/Second | Total number of TCP connections currently established correctly |
|
| Network | Network In Packets | Count | Number of packets received on the network interface |
|
| Network | Network Out Packets | Count | Number of packets transmitted on the network interface |
|
| Network | Network In Dropped | Count | Number of packet drops received on the network interface |
|
| Network | Network Out Dropped | Count | Number of packet drops transmitted from the network interface |
|
| Network | Network In Errors | Count | Number of packet errors received on the network interface |
|
| Network | Network Out Errors | Count | Number of packet errors transmitted from the network interface |
|
| OS | OS Uptime | Seconds | Time elapsed (seconds) since the system was last booted |
|
Vertica(DBaaS) Basic Metrics
Classification | Performance items | unit | Detailed description | meaningful statistics |
|---|---|---|---|---|
| Locks & Latches | Active locks | Count | Number of Active Locks |
|
| Sessions | Active sessions | Count | Number of active sessions |
|
| State | Instance state | None | DB operational status
|
|
| Tablespace | Data Tablespace Used | Gigabytes | Data / Temp Tablespace usage |
|
| Tablespace | Catalog Tablespace Used | Gigabytes | Catalog Tablespace usage |
|
2 - How-to guides
Users can create the service by entering the required information for Vertica (DBaaS) and selecting detailed options through the Samsung Cloud Platform Console.
According to Samsung Cloud Platform’s policy, the Cloud Monitoring service is scheduled to be discontinued.
Accordingly, services whose monitoring metrics are linked in Cloud Monitoring will no longer be able to monitor resources through Cloud Monitoring after the service improvement work in November 2026.
After that, resource monitoring can be continuously performed through the ServiceWatch service released in October 2025.
To ensure smooth service usage, proceed with the migration work according to the service termination schedule below.
Guide to applying resource-specific monitoring service
- New Resources: Resources created after the July 2026 service improvement work are provided with default monitoring using the ServiceWatch service.
- Existing resources: After the service improvement work in September 2026 We provide monitoring concurrently through the Cloud Monitoring service and the ServiceWatch service.
- During the parallel operation period, we need to prepare for the Servicewatch transition *
Performance and log data backup, settings configured by users linked with existing Cloud Monitoring (e.g. Check the event policy, etc., and perform tasks such as resetting the ServiceWatch service, and complete them.
Cloud Monitoring Service Phased Termination Schedule Notice
- Console menu termination (September 2026 service improvement work)
- You cannot access the Cloud Monitoring Console through the Console menu; you can only connect via the separate URLs for each region listed below.
- Console menu termination (September 2026 service improvement work)
| Offering | Region | Cloud Monitoring console URL |
|---|---|---|
| Enterprise | kr-west1 | https://console.kr-west1.e.samsungsdscloud.com/console/monitoring |
| Enterprise | kr-east1 | https://console.kr-east1.e.samsungsdscloud.com/console/monitoring |
| Samsung | kr-west1 | https://console.kr-west1.s.samsungsdscloud.com/console/monitoring |
| Samsung | kr-east1 | https://console.kr-east1.s.samsungsdscloud.com/console/monitoring |
| Sovereign | kr-south1 | https://console.kr-south1.g.samsungsdscloud.com/console/monitoring |
| Sovereign | kr-south2 | https://console.kr-south2.g.samsungsdscloud.com/console/monitoring |
| Sovereign | kr-south3 | https://console.kr-south3.g.samsungscloud.com/console/monitoring |
- Service termination (service improvement work in November 2026)
- All services of Cloud Monitoring, including the API, will be permanently discontinued.
- After the service ends in November, Cloud Monitoring data cannot be viewed. * Complete the ServiceWatch migration within the parallel operation period**
- All services of Cloud Monitoring, including the API, will be permanently discontinued.
For detailed information about ServiceWatch, please refer to the ServiceWatch 개요.
Vertica(DBaaS) Create
You can create and use the Vertica (DBaaS) service from the Samsung Cloud Platform Console.
- Before creating the service, configure the VPC’s Subnet type as General.
- If the subnet type is Local, the creation of the corresponding Database service is not possible.
- When loading more than 2 TB of large data, backups may take a long time or the database’s performance may degrade. * To prevent this, it is necessary to consider operational aspects such as cleaning up unnecessary data or migrating old data to a statistical collection environment.
- This service is provided on a Single-AZ basis.
Follow these steps to create Vertica(DBaaS).
All Services > Data Analytics > Vertica(DBaaS) Click the menu. 1. Go to the Service Home page of Vertica(DBaaS).
On the Service Home page, click the Create Vertica (DBaaS) button. 2. Go to the Create page.
Vertica(DBaaS) Creation page: enter the information required to create the service and select detailed options.
- Image and Version Selection area, select the required information.
Category required statusDetailed description Image version Required Provide a list of Vertica (DBaaS) versions Table. Vertica(DBaaS) image and version input items - Enter or select the required information in the Service Information Input area.
Category Required statusDetailed description Server name Prefix Essential The server name where Vertica will be installed - must start with a lowercase English letter, and using lowercase letters, numbers, and special characters (
-) be entered with 3 ~ 13 characters
- Based on the server name, a postfix such as 001, 002 is appended to create the actual server name
Cluster name Required Cluster name composed of servers - Enter using English letters, 3 ~ 20 characters
- A cluster is a unit that groups multiple servers
Number of nodes Required Number of data nodes - Enter the number of nodes within the range of 1-10
- If you configure the cluster by entering a Node count of 2 or more, you achieve high availability (High Availability)
Service Type > Server Type Required Data node server type - Standard: Standard specification commonly used
- High Capacity: Large-capacity server with 24 vCores or more
- For detailed information about the server types provided by Vertica (DBaaS), refer to Vertica(DBaaS) 서버 타입
Service Type > Planned Compute Selection Status of resources with Planned Compute configured - In Use: Number of resources with Planned Compute configured that are currently in use
- Configured: Number of resources with Planned Compute configured
- Coverage Preview: Amount applied per resource by Planned Compute
- Apply for Planned Compute Service: Go to the Planned Compute service application page
- For more details, refer to Planned Compute 신청하기
Service Type > Block Storage Required Block Storage type to be used for data nodes - Base OS: Area where the engine is installed
- DATA: Data file storage area
- After selecting the storage type, enter the capacity (see Block Storage 생성하기 for details on each Block Storage type)
- SSD: Standard Block Storage
- SSD_KMS: Additional encrypted volume using KMS (Key Management System) encryption keys
- The configured storage type is applied identically to additional storage
- Capacity must be entered as a multiple of 8 within the range 16 to 5,120
- After selecting the storage type, enter the capacity (see Block Storage 생성하기 for details on each Block Storage type)
- Add: DATA, Backup data storage area
- After selecting Use, enter the storage purpose and capacity
- To add storage, click the Add button; to delete, click the x button. Up to 9 can be added
- Capacity can be entered as a multiple of 8 within the range 16 to 5,120, and up to 9 can be created
Management Console selection If you select Use, you can configure the Node’s server type and Block Storage for cluster management and monitoring. Management Console > Server Type Required Selecting a data node server type for cluster management and monitoring Management Console > Block Storage Required Select the Block Storage type to be used for data nodes for cluster management and monitoring Network > Common Settings Required Network settings where servers generated by the service are installed - Select when you want to apply the same settings to all installed servers
- Select a pre‑created VPC and Subnet
- Each server’s IP is generated automatically
- Public NAT setting is only available in per‑server settings
Network > Server-specific Settings Required Network settings where servers generated by the service are installed - Select when you want to apply different settings for each installed server
- Select a pre‑created VPC and Subnet
- IP: Enter the IP for each server
- Public NAT feature is available only when the VPC is connected to an Internet Gateway, if you check use, you can select a reserved IP from the VPC product’s Public IP pool. For more details, refer to Public IP 생성하기
IP access control Selection Service Access Policy Configuration - Since the access policy is set for the IP entered on the page, you do not need to configure a separate Security Group policy
- Enter in IP format (example:
192.168.10.1) or CIDR format (example:192.168.10.0/24,192.168.10.1/32) and click the Add button
- To delete an entered IP, click the x button next to the entered IP
Maintenance period Selection DB maintenance window - If you select Use, you can set the day, start time, and duration
- The maintenance window is a feature that lets the user define the time slot for patch operations, and any patch work within that period must be performed directly by the user.
- We ask you to set a maintenance window for the stable operation of the system, and we are not responsible for any issues arising from not setting it or from failure to perform tasks within the window.
Table. Vertica(DBaaS) Service Configuration Items - must start with a lowercase English letter, and using lowercase letters, numbers, and special characters (
- Enter required database configuration information In this area, enter or select the required information.Required status
Detailed description Database name Required Server name applied during DB installation - must start with an English letter and be entered using English letters and numbers, 3 to 20 characters long
Database username Required DB user name - An account with the same name is also created on the OS
- Enter using lowercase English letters, 2 to 20 characters
- Restricted database user names can be viewed in the Console
Database password Required Password to use when accessing the DB - Include letters, numbers, and special characters (
“‘excluded) and enter 8 to 30 characters
Check database password Required Re-enter the same password to use for DB access Database Port number Required Port number required for DB connection - Enter the DB port within the range 1200 ~ 65535
Backup > Use Selection Node backup usage - Use to select node backup retention period and backup start time
Backup > Retention period selection Backup retention period - Select the backup retention period. Set the file retention period from 7 days to 35 days
- Backup files incur additional charges based on size
Backup > Backup Start Time Selection Backup start time - Select backup start time
- The minutes when the backup runs (minutes) are set randomly, and the backup end time cannot be set
ServiceWatch log collection Selection ServiceWatch log collection status - Select Use to configure the ServiceWatch log collection feature
- It is provided free of charge up to 5 GB for all services within the Account, and charges apply based on storage size for usage exceeding 5 GB.
- When collected, log groups and log streams are created automatically, and they cannot be deleted until the resources are removed.
- To prevent exceeding 5 GB, it is recommended to delete log data directly or shorten the retention period.
License Key Required Enter the Vertica License Key owned by the customer - If the entered license key is invalid, service creation is not possible
DB Locale Required Settings related to string handling, numeric/currency/date/time display formats, etc., to be used in Vertica (DBaaS) - The database is created with default settings based on the selected locale
Time zone Required Standard time zone to use with Vertica (DBaaS) Table. Vertica (DBaaS) required configuration items - In the Additional Information Input area, enter or select the required information.Required
Detailed description tag Selection Add Tag - Up to 50 per resource can be added
- After clicking the Add Tag button, enter or select Key, Value values
Table. Vertica (DBaaS) additional information input fields
- Image and Version Selection area, select the required information.
Summary Review the detailed information and estimated charges generated in the panel, then click the Create button.
- When creation is complete, check the created resource on the Resource List page.
Vertica(DBaaS) Check detailed information
The Vertica (DBaaS) service allows you to view and edit the full list of resources and detailed information. The Vertica(DBaaS) Details page consists of Details, Tags, Job History tabs.
Follow the steps below to view detailed information about the Vertica (DBaaS) service.
- Click the All Services > Data Analytics > Vertica(DBaaS) menu. 1. Go to the Service Home page of Vertica(DBaaS).
- On the Service Home page, click the Vertica(DBaaS) menu. 2. Vertica(DBaaS) List Go to the page.
- Vertica(DBaaS) List Click the resource on the page to view detailed information. 3. Navigate to the Vertica(DBaaS) Details page.
- Vertica(DBaaS) Details At the top of the page, status information and additional feature information are displayed.
Detailed description The cluster is currently in a stopped state. It will be automatically started when a new job is submitted. If you want to start it manually, click the Start button. If you want to stop it, click the Stop button. If you want to delete the cluster, click the Delete button. If you want to edit the cluster, click the Edit button. If you want to view the cluster details, click the Details button. If you want to view the cluster logs, click the Logs button. If you want to view the cluster metrics, click the Metrics button. If you want to view the cluster configuration, click the Configuration button. If you want to view the cluster status, click the Status button. If you want to view the cluster health, click the Health button. If you want to view the cluster usage, click the Usage button. If you want to view the cluster cost, click the Cost button. If you want to view the cluster billing, click the Billing button. If you want to view the cluster usage history, click the Usage History button. If you want to view the cluster cost history, click the Cost History button. If you want to view the cluster billing history, click the Billing History button. If you want to view the cluster usage summary, click the Usage Summary button. If you want to view the cluster cost summary, click the Cost Summary button. If you want to view the cluster billing summary, click the Billing Summary button. If you want to view the cluster usage details, click the Usage Details button. If you want title: “Cluster Management” date: 2023-01-01 tags: [“cluster”, “management”]
cluster:
  name: "my-cluster"
  status: "stopped"
  nodes: 3
  type: "m5.large"
def start_cluster(): # code to start the cluster pass ``` | Cluster status: **Creating**: Creating the cluster<ul><li>**Error**: Error occurred while creating the cluster</li></ul>If it persists, contact the administrator<ul><li></li></ul><ul><li>**Failed**: Failed during cluster creation<ul><li></li></ul>**Restarting**: Restarting the cluster</li></ul><ul><li>**Running**: Cluster is running normally</li></ul><ul><li>**Starting**: Starting the cluster</li></ul><ul><li>**Stopped**: Cluster is stopped</li></ul><ul><li>**Stopping**: Stopping the cluster</li></ul><ul><li>**Synchronizing**: Synchronizing the cluster</li></ul><ul><li>**Terminating**: Terminating the cluster</li></ul><ul><li>**Unknown**: Unknown cluster status</li></ul>If it persists, contact the administrator<ul><li></li></ul><ul><li>**Upgrading**: Upgrading the cluster<ul><li></li> | | Cluster control | Buttons to change the cluster state<ul><li>**Start**: Start a stopped cluster</li></ul><ul><li>**Stop**: Stop a running cluster</li></ul><ul><li>**Restart**: Restart a running cluster</li></ul> | | View more features | Cluster management buttons<ul><li>**Service status synchronization**: Real-time DB service status lookup</li></ul><ul><li>**Backup history**: When backup is configured, check whether the backup runs correctly and view its history</li></ul><ul><li>**Database recovery**: Recover the DB based on a specific point in time</li></ul> | | Service cancellation | Button to cancel the service | <div class="figure-caption"> Table. Vertica (DBaaS) status information and additional features </div>
- Vertica(DBaaS) Details At the top of the page, status information and additional feature information are displayed.
Detailed Information
Vertica(DBaaS) List page lets you view detailed information of the selected resource and, if needed, modify the information.
| Detailed description | |
|---|---|
| Server Information | Server information configured in this cluster
|
| service | Service name |
| Resource Type | Resource Type |
| SRN | Unique resource ID in Samsung Cloud Platform
|
| Resource Name | resource name
|
| Resource ID | Unique resource ID in the service |
| Constructor | User who created the service |
| Creation Date/Time | Service creation date and time |
| Modifier | User who edited the service information |
| Modification date and time | Date and time the service information was modified |
| Image/Version | Installed DB image and version information |
| Cluster name | Cluster name of the configured servers |
| Database name | Server name applied during DB installation |
| Database username | DB user name |
| Planned Compute | Resource status with Planned Compute configured
|
| Maintenance period | DB Maintenance Period Status
|
| Backup | Backup Configuration Status
|
| ServiceWatch log collection | ServiceWatch Log Collection Configuration Status
|
| Managed Console | Managed Console resource status configured during DB installation |
| Network | Installed network information (VPC, Subnet) |
| IP access control | Service access policy configuration
|
| Time zone | Standard time zone where the Vertica (DBaaS) DB will be used |
| License | Vertica(DBaaS) license information |
| Server Information | Data/Console server type, default OS, additional Disk information
|
tag
Vertica(DBaaS) List page lets you view the tag information of the selected resource, and add, modify, or delete it.
| Category | Detailed description |
|---|---|
| Tag list | Tag list
|
Job History
On the Vertica(DBaaS) List page, you can view the operation history of the selected resource.
| Category | Detailed description |
|---|---|
| Task History List | Resource Change History
|
Vertica(DBaaS) Managing Resources
If you need to change the existing configuration options of a created Vertica(DBaaS) resource or add storage, you can perform the task on the Vertica(DBaaS) Details page.
Operation Control
If changes occur to a running Vertica (DBaaS) resource, you can start, stop, or restart it.
To control the operation of Vertica (DBaaS), follow the steps below.
- All Services > Data Analytics > Vertica(DBaaS) Click the menu. 1. Go to the Vertica(DBaaS) Service Home page.
- On the Service Home page, click the Vertica(DBaaS) menu. 2. Vertica(DBaaS) List Navigate to the page.
- Vertica(DBaaS) List On the page, click the resource you want to control. 3. Vertica(DBaaS) Details Navigate to the page.
- Check the Vertica (DBaaS) status and complete the change using the control button below.
- Start: Vertica(DBaaS) service is installed on the server and the Vertica(DBaaS) service is running (Running).
- Stop: The server on which the Vertica (DBaaS) service is installed and the Vertica (DBaaS) service will be stopped (Stopped).
- Restart: Only the Vertica(DBaaS) service will be restarted.
Synchronize service status
You can synchronize the real-time service status of Vertica (DBaaS).
To check the service status of Vertica (DBaaS), follow these steps.
- All Services > Data Analytics > Vertica(DBaaS) Click the menu. 1. Go to the Service Home page of Vertica(DBaaS).
- On the Service Home page, click the Vertica(DBaaS) menu. 2. Vertica(DBaaS) List Navigate to the page.
- Vertica(DBaaS) List Click the resource on the page to view the service status. 3. Navigate to the Vertica(DBaaS) Details page.
- Service status synchronization Click the button. 4. While it is being queried, the cluster changes to Synchronizing state.
- Once the query is complete, the status in the server information item is updated, and the cluster changes to Running state.
Change Server Type
You can change the configured server type.
- If the server type is configured as Standard, it cannot be changed to High Capacity. * If you want to change to High Capacity, create a new service.
- If you modify the server type, a server restart is required. * Please verify separately any software license modifications or software settings and their implementation due to server specification changes.
To change the server type, follow these steps.
- All Services > Data Analytics > Vertica(DBaaS) Click the menu. 1. Go to the Service Home page of Vertica(DBaaS).
- On the Service Home page, click the Vertica(DBaaS) menu. 2. Vertica(DBaaS) List Go to the page.
- Vertica(DBaaS) List On the page, click the resource to change the server type. 3. Vertica(DBaaS) Details Navigate to the page.
- Click the Edit icon of the server type you want to change at the bottom of the detailed information. 4. Edit Server Type The popup window opens.
- Edit Server Type After selecting the server type in the popup window, click the Confirm button.
Add storage
If you need more than 5 TB of data storage, you can add additional storage. In a high‑availability configuration (HA cluster), expanding or adding storage capacity is applied simultaneously to all databases.
To add storage, follow these steps.
- All Services > Data Analytics > Vertica(DBaaS) Click the menu. 1. Navigate to the Service Home page of Vertica (DBaaS).
- On the Service Home page, click the Vertica(DBaaS) menu. 2. Vertica(DBaaS) List Navigate to the page.
- Vertica(DBaaS) List On the page, click the resource to add storage. 3. Vertica(DBaaS) Details Go to the page.
- Click the Add Disk button at the bottom of the detailed information. 4. Additional Storage Request The popup window opens.
- Additional Storage Request In the popup window, after entering the purpose and capacity, click the Confirm button.
Expanding Storage
Storage added to the data area can be expanded up to a maximum of 5 TB based on the initially allocated capacity. You can expand storage without stopping Vertica (DBaaS), and if it is configured as a cluster, all nodes are expanded simultaneously.
To increase storage capacity, follow the steps below.
- All Services > Data Analytics > Vertica(DBaaS) Click the menu. 1. Navigate to the Service Home page of Vertica (DBaaS).
- On the Service Home page, click the Vertica(DBaaS) menu. 2. Vertica(DBaaS) List Navigate to the page.
- On the Vertica(DBaaS) List page, click the resource to change the server type. 3. Vertica(DBaaS) Details Navigate to the page.
- Click the Edit button for the additional Disk you want to add at the bottom of the detailed information. 4. Edit Additional Storage popup opens.
- Edit Additional Storage After entering the expansion capacity in the popup window, click the Confirm button.
Changing the Recovery DB instance type
After DB recovery is complete, you can change the instance type on the Recovery details screen.
To change the Recovery DB instance type, follow these steps.
- All Services > Data Analytics > Vertica(DBaaS) menu, click it. 1. Navigate to the Service Home page of Vertica (DBaaS).
- On the Service Home page, click the Vertica(DBaaS) menu. 2. Vertica(DBaaS) List Go to the page.
- On the Vertica(DBaaS) List page, click the resource to change the Recovery DB instance type. 3. Vertica(DBaaS) Details Go to the page.
- Click the Change Instance Type button. 4. Change Instance Type A confirmation dialog will appear.
- The DB instance type is changed from Recovery to Active to perform the same function as a single DB.
Vertica(DBaaS) Terminate
You can cancel the unused Vertica (DBaaS) to reduce operating costs. However, if you terminate the service, the running service may be discontinued immediately, so you should proceed with the termination only after fully considering the impact of the service interruption.
To cancel Vertica(DBaaS), follow the steps below.
- All Services > Data Analytics > Vertica(DBaaS) Click the menu. 1. Navigate to the Service Home page of Vertica (DBaaS).
- On the Service Home page, click the Vertica(DBaaS) menu. 2. Vertica(DBaaS) List Navigate to the page.
- On the Vertica(DBaaS) List page, select the resource to cancel, and click the Cancel Service button.
- When the termination is complete, check on the Vertica(DBaaS) list page whether the resource has been terminated.
2.1 - Backing up and restoring Vertica
Users can set up backups for Vertica (DBaaS) and restore from the backed‑up files via the Samsung Cloud Platform Console.
Vertica(DBaaS) Backup
You can configure the backup feature to ensure that user data is stored securely. Additionally, you can verify whether the backup was successful using the backup history feature, and you can also delete backed‑up files.
Configure Backup
For backup configuration of Vertica (DBaaS), refer to Vertica(DBaaS) 생성하기.
Follow the steps below to modify the backup settings of Vertica(DBaaS).
- When a backup is configured, it runs at the designated time after the set schedule, and additional fees are incurred based on the backup volume.
- If you change the backup setting to unused, backup execution stops immediately, and the stored backup data is deleted and can no longer be used.
- All Services > Data Analytics > Vertica(DBaaS) Click the menu. 1. Navigate to the Service Home page of Vertica (DBaaS).
- On the Service Home page, click the Vertica(DBaaS) menu. 2. Go to the Vertica(DBaaS) List page.
- Vertica(DBaaS) List page, click the resource for which you want to configure a backup. 3. Vertica(DBaaS) Details Go to the page.
- Click the Edit button of the backup item. 4. Backup Settings The popup window opens.
- When configuring a backup, click Use in the Backup Settings popup, select the retention period and backup start time, and click the Confirm button.
- If you want to stop the backup setting, deselect Backup Setting in the Use popup window and authenticate via the logged-in user’s mobile phone.
Once user authentication is completed, the backup setting is disabled and backup execution stops.
- If you want to stop the backup setting, deselect Backup Setting in the Use popup window and authenticate via the logged-in user’s mobile phone.
Check backup history
To view the backup history, follow these steps.
- All Services > Data Analytics > Vertica(DBaaS) Click the menu. 1. Go to the Service Home page of Vertica (DBaaS).
- On the Service Home page, click the Vertica(DBaaS) menu. 2. Vertica(DBaaS) List Navigate to the page.
- On the Vertica(DBaaS) List page, click the resource to view the backup history. 3. Navigate to the Vertica(DBaaS) Details page.
- Click the Backup History button. 4. Backup History The popup window opens.
- Backup History In the popup window, you can view the backup status, version, backup start time, backup completion time, and size.
Delete backup file
To delete the backup history, follow these steps.
- All Services > Data Analytics > Vertica(DBaaS) Click the menu. 1. Go to the Service Home page of Vertica (DBaaS).
- On the Service Home page, click the Vertica(DBaaS) menu. 2. Navigate to the Vertica(DBaaS) List page.
- Vertica(DBaaS) List page, click the resource to view the backup history. 3. Vertica(DBaaS) Details Navigate to the page.
- Click the Backup History button. 4. Backup History The popup window opens.
- Backup History In the popup window, check the files you want to delete, then authenticate using the logged-in user’s mobile phone.
- When user authentication is completed, the backup file is deleted.
Vertica(DBaaS) Recover
If a failure or data loss requires restoration from backup files, you can use the cluster recovery feature to recover based on a specific point in time.
To recover Vertica (DBaaS), follow the steps below.
- All Services > Data Analytics > Vertica(DBaaS) Click the menu. 1. Go to the Service Home page of Vertica(DBaaS).
- On the Service Home page, click the Vertica(DBaaS) menu. 2. Vertica(DBaaS) List Navigate to the page.
- Vertica(DBaaS) resource On the list page, click the resource you want to recover. 3. Vertica(DBaaS) Details Go to the page.
- Click the Database Recovery button. 4. Database(DBaaS) Recovery Go to the page.
- Database Recovery area, after entering the relevant information, click the Complete button.
구분 Required statusDetailed description Copy the restored file the restored file the restored file the restored file the restored file the restored file the restored file the restored file the restored file. Required Set the point in time the user wants to recover - Backup point (recommended): Recover based on the backup file. Select from the list of backup file timestamps displayed in the list
- Recovery point: Choose the date and time to recover. Can be selected from the start time of the backup history
Server name Prefix Required 복구 DB 서버 이름 - 영문 소문자로 시작하여 소문자, 숫자와 특수문자(
-)를 사용하여 3~16자로 입력
- 서버명 기반으로 001, 002와 같은 postfix 가 붙어 실제 서버명이 생성됨
Cluster name Required Recovery DB cluster name - Enter using English letters, 3 ~ 20 characters
- A cluster is a unit that groups multiple servers
Number of nodes Selection Number of data nodes - Set to be the same as the number of nodes configured in the original cluster
Service Type > Server Type Required Recovery DB server type - Standard: standard specifications commonly used
- High Capacity: large-capacity server of 24 vCore or more
Service Type > Planned Compute Selection Planned Compute가 설정된 자원 현황 - In Use: Number of resources with Planned Compute configured that are currently in use
- Configured: Number of resources with Planned Compute configured
- Coverage Preview: Amount applied per resource by Planned Compute
- Planned Compute Service Request: Go to the Planned Compute service request page
- For more details, see Planned Compute 신청하기.
Service Type > Block Storage Required Block Storage settings used by the recovery DB - Basic OS: Area where the DB engine is installed
- DATA: Storage area for table data, archive files, etc.
- Applied identically with the storage type set in the original cluster
- After selecting Use, enter the storage purpose and capacity
- To add storage, click the Add button; to delete, click the x button
- Capacity can be entered in multiples of 8 within the range 16 to 5,120, and up to 9 can be created
Management Console > Server Type Required Management Console server type - After selecting Use, choose the storage purpose and capacity
- Standard: standard specification commonly used
- High Capacity: large-capacity server with 24 vCore or more
Management Console > Block Storage Required Block Storage settings used by the Management Console - Select Use and then select Default OS
Database username Required Database username - Apply the same username set in the original cluster
Database password Required Database password - Apply the same password set in the original cluster
Database Port number Required Database Port number - Apply the same Port number as set in the original cluster
IP access control Selection Service Access Policy Configuration - Since the access policy is set for the IP entered on the page, you do not need to configure a separate Security Group policy
- Enter in IP format (example:
192.168.10.1) or CIDR format (example:192.168.10.0/24,192.168.10.1/32) and click the Add button
- To delete an entered IP, click the x button next to the entered IP
Maintenance period Selection DB maintenance window - If you select Use, you can set the day of the week, start time, and duration
- The maintenance window is a feature that allows the user to set the time slot for performing patch operations, and any patch tasks within that period must be carried out directly by the user.
- We ask you to set a maintenance window for the stable operation of the system, and we are not responsible for any issues arising from not setting it or from failure to perform tasks within the window.
License Key Required Enter the Vertica License Key to recover - If the entered license key is invalid, the service cannot be created
tag Selection Add Tag - Add Tag after clicking the button, enter or select Key, Value values
Table. Vertica (DBaaS) recovery configuration items