Service Overview
Quick Query is an interactive query service that allows you to easily and quickly analyze large-scale data using standard SQL. It is automatically installed on a standard Kubernetes cluster, and you can easily and quickly access various data sources such as Cloud Hadoop, Object Storage, and RDB for data retrieval and processing.
Features
- Easy and Fast Data Retrieval: After defining a schema for data stored in Object Storage and executing queries using standard SQL, you can retrieve data easily and quickly. Any user who can work with SQL can easily analyze large data sets, even without being a professional analyst.
- Fast Parallel Distributed Processing: Using the Trino engine capable of parallel distributed processing, queries are automatically split and processed in parallel across multiple nodes simultaneously, allowing rapid query results even for large-scale data.
- Various Service Architectures: We provide a public fixed-resource mode, a public resource-scaling mode, and a personal resource-scaling mode. The public fixed-resource mode supports stable response times for large-scale data queries, while the public resource-scaling mode can be used at a lower cost when usage frequency is irregular. Additionally, the personal resource-scaling mode enables each user to perform analysis tasks in an independent environment, allowing the use of Quick Query with a structure that meets user requirements.
Service Architecture Diagram
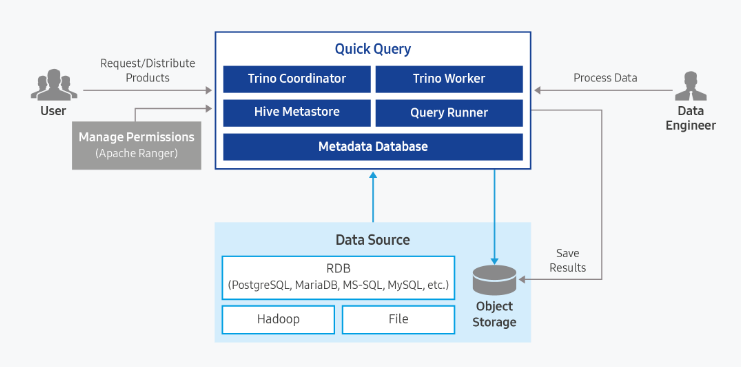
Provided features
Quick Query provides the following features.
- Support single access to various data sources (support for 11 types of data sources)
- Automatic saving of result data in Object Storage
- Result reuse feature for identical queries
- Access control feature through Ranger integration
- Data Usage Control Feature
| Category | type | Remarks |
|---|---|---|
| Cloud Hadoop | hive_on_cloud_hadoop iceberg_on_cloud_hadoop | Using Hive Metastore in Cloud Hadoop |
| Object Storage | hive_on_object_storage iceberg_on_object_storag | Deploy and use Hive Metastore in Quick Query |
| RDB | postgresql mariadb sqlserver oracle mysql | JDBC Driver Upload needed (license) |
| TPCDS | tpcds | Built-in Data Source provided by Quick Query |
| TPCH | tpch | Built-in Data Source provided by Quick Query |
| type | select | insert | uptate | delete | create | drop | alter | analyze | call |
|---|---|---|---|---|---|---|---|---|---|
| hive_on_cloud_hadoop | O | O | O | O | O | O | O | O | O |
| iceberg_on_cloud_hadoop | O | O | O | O | O | O | O | O | O |
| hive_on_object_storage | O | O | O | O | O | O | O | O | O |
| iceberg_on_object_storage | O | O | O | O | O | O | O | O | O |
| postgresql | O | O | O | O | O | O | |||
| mariadb | O | O | O | O | O | O | |||
| sqlserver | O | O | O | O | O | O | |||
| greenplum | O | O | O | O | O | O | |||
| oracle | O | O | O | O | O | O | |||
| mysql | O | O | O | O | O | O | |||
| tpcds | O | ||||||||
| tpch | O |
Component
Query Engine Type: Shared
The query engine is structured so that a single instance, once started, can be shared by multiple users.
Fixed Resource Mode (Auto Scaling Disabled): When Auto Scaling is not used, the query engine for the fixed resources is launched according to the resources selected by the user. Because the query engine always runs on the same resources, it can guarantee consistent query performance.
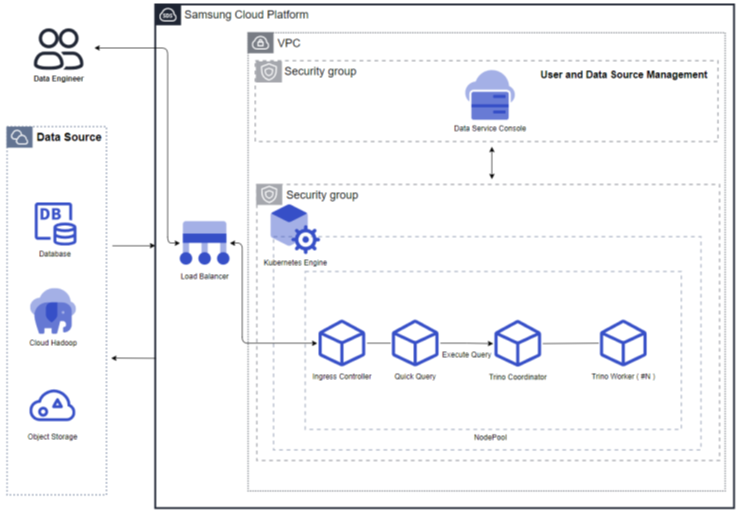
Figure. Fixed resource mode (Auto Scaling not used) Resource Expansion Mode (Auto Scaling enabled): When Auto Scaling is used, the query engine’s Worker nodes automatically scale in/out based on throughput. If the throughput is low, the number of Worker nodes can be reduced to as few as one, and when the throughput increases, the Worker nodes expand. Additionally, resources can be adjusted according to the cluster size.
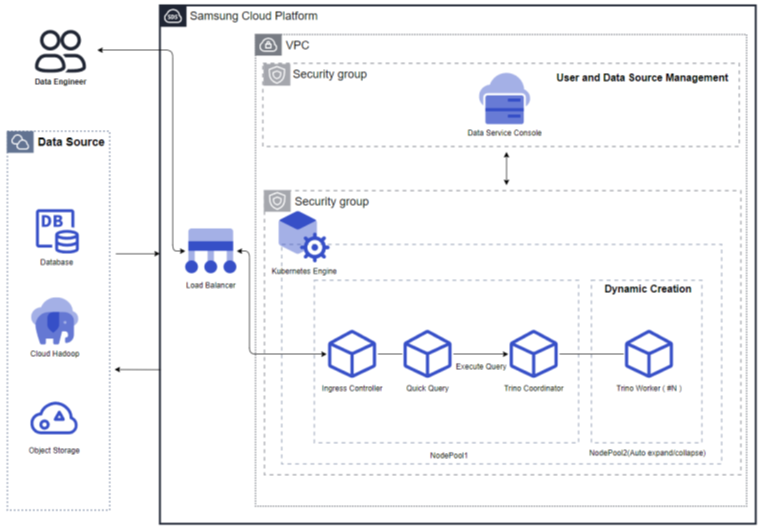
Figure. Resource expansion mode (using Auto Scaling)
Query Engine Type: Private
Resource Expansion Mode (Auto Scaling Enabled): The personal query engine type runs a separate query engine for each user. Each query engine supports Auto Scale in/out, and if unused for an extended period, the engine automatically stops. When reconnecting for reuse, the query engine automatically restarts. When the throughput is low, the number of Worker nodes can decrease to as few as one, and when the throughput increases, the number of Worker nodes grows. Additionally, resources can be adjusted according to the cluster size.
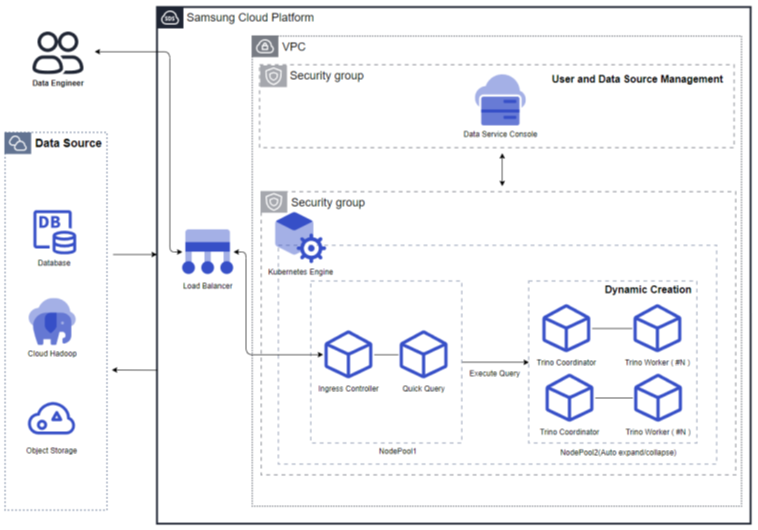
Figure. Resource Expansion Mode (using Auto Scaling)
Server type
The server types supported by Quick Query are as follows.
| Category | example | Detailed description |
|---|---|---|
| Server type | Standard | Provided server types
|
| Server size | s1v2m4 | Provided server specifications
|
The minimum specifications required to use Quick Query are as follows.
| Category | Details | Cluster size (user input value) | Fixed node pool | Auto-scaling node pool |
|---|---|---|---|---|
| Common | Fixed resource mode (Auto Scaling not used) | Replica: 1 CPU: 4 Core Memory: 8GB | 8 Core, 16GB * 4 | N/A |
| Common | Resource expansion mode (Auto Scaling enabled) | Small(1 Core, 4GB) | 8 Core, 16GB * 3 | 8 Core, 16GB * 1 |
| Personal | Resource expansion mode (Auto Scaling enabled) | Small(1 Core, 4GB) | 8 Core, 16GB * 3 | 8 Core, 32GB * 2 |
Provision status by region
Quick Query is available in the following environments.
| region | Provision status |
|---|---|
| Korea West (kr-west1) | Provide |
| Korea East (kr-east1) | Provide |
| South Korea 1 (kr-south1) | Not provided |
| South Korea South 2 (kr-south2) | Not provided |
| South Korea 3 (kr-south3) | Not provided |
Preliminary Service
This is a list of services that must be pre-configured before creating the service. Please refer to the guide provided for each service and prepare in advance.
| Service Category | service | Detailed description |
|---|---|---|
| Networking | VPC | A service that provides an isolated virtual network in a cloud environment |
| Networking | Security Group | Virtual firewall that controls server traffic |
| Storage | File Storage | A storage system that enables multiple client servers to share files over a network connection. |