This is the multi-page printable view of this section. Click here to print.
Quick Query
- 1: Overview
- 1.1: ServiceWatch metric
- 2: How-to guides
- 3: API Reference
- 4: CLI Reference
- 5: Release Note
1 - Overview
Service Overview
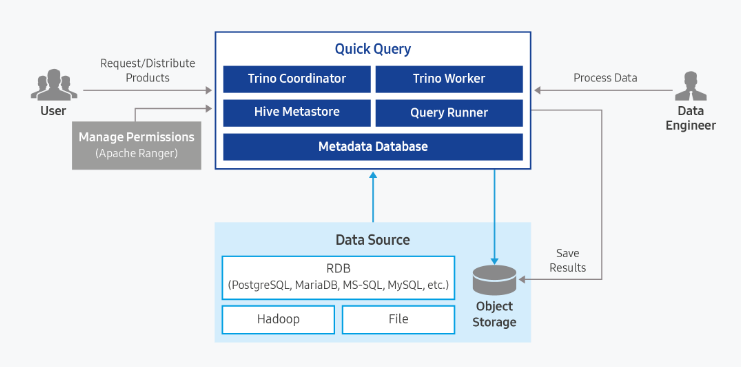
Quick Query is an interactive query service that allows you to easily and quickly analyze large-scale data using standard SQL. It is automatically installed on a standard Kubernetes cluster, and you can easily and quickly access various data sources such as Cloud Hadoop, Object Storage, and RDB for data retrieval and processing.
Features
- Easy and Fast Data Retrieval: After defining a schema for data stored in Object Storage and executing queries using standard SQL, you can retrieve data easily and quickly. Any user who can work with SQL can easily analyze large data sets, even without being a professional analyst.
- Fast Parallel Distributed Processing: Using the Trino engine capable of parallel distributed processing, queries are automatically split and processed in parallel across multiple nodes simultaneously, allowing rapid query results even for large-scale data.
- Various Service Architectures: We provide a public fixed-resource mode, a public resource-scaling mode, and a personal resource-scaling mode. The public fixed-resource mode supports stable response times for large-scale data queries, while the public resource-scaling mode can be used at a lower cost when usage frequency is irregular. Additionally, the personal resource-scaling mode enables each user to perform analysis tasks in an independent environment, allowing the use of Quick Query with a structure that meets user requirements.
Service Architecture Diagram
Provided features
Quick Query provides the following features.
- Support single access to various data sources (support for 11 types of data sources)
- Automatic saving of result data in Object Storage
- Result reuse feature for identical queries
- Access control feature through Ranger integration
- Data Usage Control Feature
| Category | type | Remarks |
|---|---|---|
| Cloud Hadoop | hive_on_cloud_hadoop iceberg_on_cloud_hadoop | Using Hive Metastore in Cloud Hadoop |
| Object Storage | hive_on_object_storage iceberg_on_object_storag | Deploy and use Hive Metastore in Quick Query |
| RDB | postgresql mariadb sqlserver oracle mysql | JDBC Driver Upload needed (license) |
| TPCDS | tpcds | Built-in Data Source provided by Quick Query |
| TPCH | tpch | Built-in Data Source provided by Quick Query |
| type | select | insert | uptate | delete | create | drop | alter | analyze | call |
|---|---|---|---|---|---|---|---|---|---|
| hive_on_cloud_hadoop | O | O | O | O | O | O | O | O | O |
| iceberg_on_cloud_hadoop | O | O | O | O | O | O | O | O | O |
| hive_on_object_storage | O | O | O | O | O | O | O | O | O |
| iceberg_on_object_storage | O | O | O | O | O | O | O | O | O |
| postgresql | O | O | O | O | O | O | |||
| mariadb | O | O | O | O | O | O | |||
| sqlserver | O | O | O | O | O | O | |||
| greenplum | O | O | O | O | O | O | |||
| oracle | O | O | O | O | O | O | |||
| mysql | O | O | O | O | O | O | |||
| tpcds | O | ||||||||
| tpch | O |
Component
Query Engine Type: Shared
The query engine is structured so that a single instance, once started, can be shared by multiple users.
Fixed Resource Mode (Auto Scaling Disabled): When Auto Scaling is not used, the query engine for the fixed resources is launched according to the resources selected by the user. Because the query engine always runs on the same resources, it can guarantee consistent query performance.
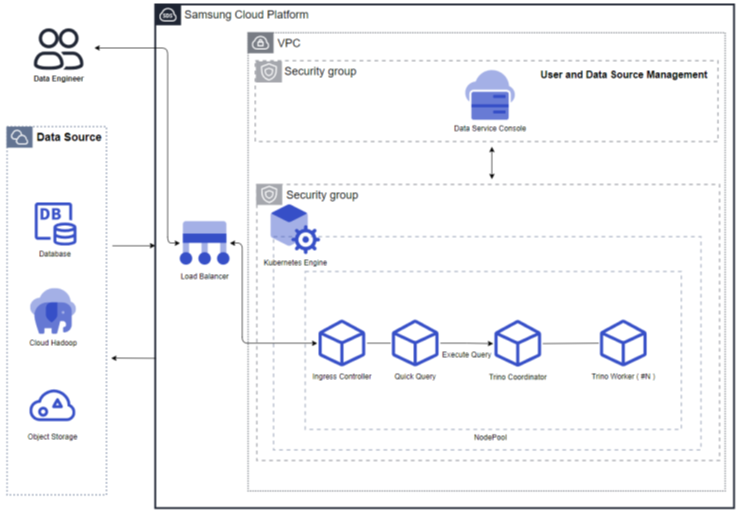
Figure. Fixed resource mode (Auto Scaling not used) Resource Expansion Mode (Auto Scaling enabled): When Auto Scaling is used, the query engine’s Worker nodes automatically scale in/out based on throughput. If the throughput is low, the number of Worker nodes can be reduced to as few as one, and when the throughput increases, the Worker nodes expand. Additionally, resources can be adjusted according to the cluster size.
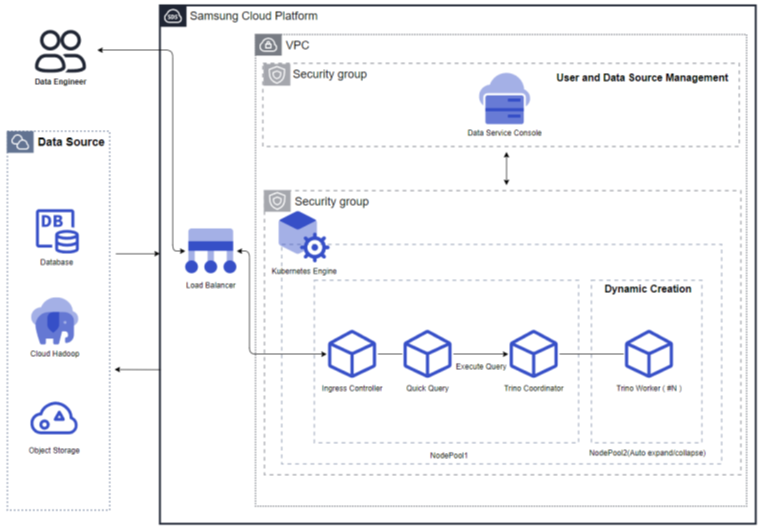
Figure. Resource expansion mode (using Auto Scaling)
Query Engine Type: Private
Resource Expansion Mode (Auto Scaling Enabled): The personal query engine type runs a separate query engine for each user. Each query engine supports Auto Scale in/out, and if unused for an extended period, the engine automatically stops. When reconnecting for reuse, the query engine automatically restarts. When the throughput is low, the number of Worker nodes can decrease to as few as one, and when the throughput increases, the number of Worker nodes grows. Additionally, resources can be adjusted according to the cluster size.
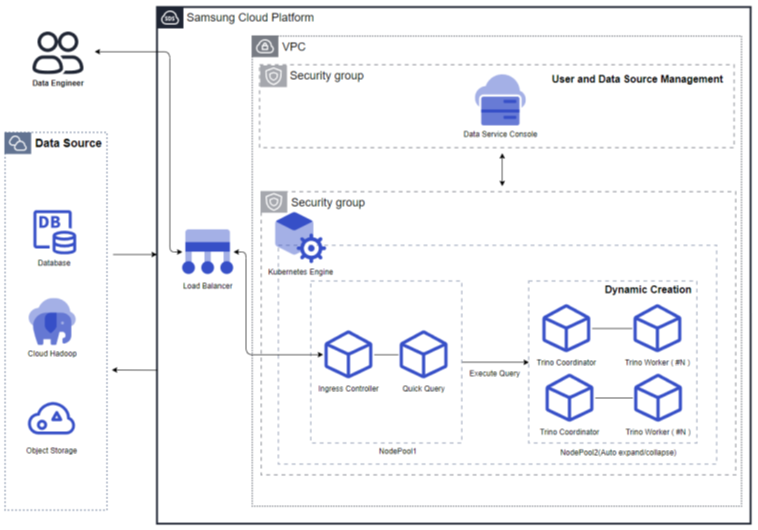
Figure. Resource Expansion Mode (using Auto Scaling)
Server type
The server types supported by Quick Query are as follows.
| Category | example | Detailed description |
|---|---|---|
| Server type | Standard | Provided server types
|
| Server size | s1v2m4 | Provided server specifications
|
The minimum specifications required to use Quick Query are as follows.
| Category | Details | Cluster size (user input value) | Fixed node pool | Auto-scaling node pool |
|---|---|---|---|---|
| Common | Fixed resource mode (Auto Scaling not used) | Replica: 1 CPU: 4 Core Memory: 8GB | 8 Core, 16GB * 4 | N/A |
| Common | Resource expansion mode (Auto Scaling enabled) | Small(1 Core, 4GB) | 8 Core, 16GB * 3 | 8 Core, 16GB * 1 |
| Personal | Resource expansion mode (Auto Scaling enabled) | Small(1 Core, 4GB) | 8 Core, 16GB * 3 | 8 Core, 32GB * 2 |
Provision status by region
Quick Query is available in the following environments.
| region | Provision status |
|---|---|
| Korea West (kr-west1) | Provide |
| Korea East (kr-east1) | Provide |
| South Korea 1 (kr-south1) | Not provided |
| South Korea South 2 (kr-south2) | Not provided |
| South Korea 3 (kr-south3) | Not provided |
Preliminary Service
This is a list of services that must be pre-configured before creating the service. Please refer to the guide provided for each service and prepare in advance.
| Service Category | service | Detailed description |
|---|---|---|
| Networking | VPC | A service that provides an isolated virtual network in a cloud environment |
| Networking | Security Group | Virtual firewall that controls server traffic |
| Storage | File Storage | A storage system that enables multiple client servers to share files over a network connection. |
1.1 - ServiceWatch metric
You can view Kubernetes Engine metrics in ServiceWatch for the Kubernetes Engine created from Quick Query. As with Kubernetes Engine, the metrics provided by default monitoring are data collected at one‑minute intervals.
Basic Metrics
The following are basic metrics for the Kubernetes Engine namespace.
The metrics whose names are shown in bold below are the key metrics selected from the default metrics provided by Kubernetes Engine. Key metrics are used to build service dashboards that are automatically created for each service in ServiceWatch.
Each metric provides guidance in the user guide on which statistical values are meaningful when querying that metric, and among the meaningful statistics, the values shown in bold are the primary statistics. In the service dashboard, you can view key metrics using primary statistical values.
| Indicator Name | Detailed description | unit | meaningful statistics |
|---|---|---|---|
| cluster_up | Cluster up | Count |
|
| cluster_node_count | Number of cluster nodes | Count |
|
| cluster_failed_node_count | Number of failed nodes in the cluster | Count |
|
| cluster_namespace_phase_count | Number of cluster namespace phases | Count |
|
| cluster_pod_phase_count | Number of cluster pod phases | Count |
|
| node_cpu_allocatable | Node CPU allocatable amount | - |
|
| node_cpu_capacity | Node CPU capacity | - |
|
| node_cpu_usage | Node CPU usage | - |
|
| node_cpu_utilization | Node CPU usage | - |
|
| node_memory_allocatable | Node memory allocatable amount | Bytes |
|
| node_memory_capacity | Node memory capacity | Bytes |
|
| node_memory_usage | Node memory usage | Bytes |
|
| node_memory_utilization | Node memory usage rate | - |
|
| node_network_rx_bytes | Node network received bytes | Bytes/Second |
|
| node_network_tx_bytes | Node network transmitted bytes | Bytes/Second |
|
| node_network_total_bytes | Total bytes of the node network | Bytes/Second |
|
| node_number_of_running_pods | Number of pods running on the node | Count |
|
| namespace_number_of_running_pods | Number of running pods in the namespace | Count |
|
| namespace_deployment_pod_count | Namespace deployment pod count | Count |
|
| namespace_statefulset_pod_count | Namespace StatefulSet pod count | Count |
|
| namespace_daemonset_pod_count | Number of DaemonSet Pods per Namespace | Count |
|
| namespace_job_active_count | Active namespace job count | Count |
|
| namespace_cronjob_active_count | Number of active namespace cronjobs | Count |
|
| pod_cpu_usage | Pod CPU usage | - |
|
| pod_memory_usage | Pod memory usage | Bytes |
|
| pod_network_rx_bytes | Pod network received bytes | Bytes/Second |
|
| pod_network_tx_bytes | Pod network transmitted bytes | Bytes/Second |
|
| pod_network_total_bytes | Total pod network bytes | Count |
|
| container_cpu_usage | Container CPU usage | - |
|
| container_cpu_limit | Container CPU limit | - |
|
| container_cpu_utilization | Container CPU usage | - |
|
| container_memory_usage | Container memory usage | Bytes |
|
| container_memory_limit | Container memory limit | Bytes |
|
| container_memory_utilization | Container memory usage rate | - |
|
| node_gpu_count | Node GPU count | Count |
|
| gpu_temp | GPU temperature | - |
|
| gpu_power_usage | GPU power consumption | - |
|
| gpu_util | GPU utilization | Percent |
|
| gpu_sm_clock | GPU SM clock | - |
|
| gpu_fb_used | GPU FB usage | Megabytes |
|
| gpu_tensor_active | GPU tensor utilization | - |
|
| pod_gpu_util | Pod GPU utilization | Percent |
|
| pod_gpu_tensor_active | Pod GPU Tensor Utilization Rate | - |
|
2 - How-to guides
Users can create the service by entering the required Quick Query information and selecting detailed options through the Samsung Cloud Platform Console.
Create Quick Query
You can create and use the Quick Query service in the Samsung Cloud Platform Console.
To create a Quick Query, follow these steps.
Click the All Services > Data Analytics > Quick Query menu. 1. Navigate to the Service Home page of Quick Query.
On the Service Home page, click the Create Quick Query button. 2. Go to the Create Quick Query page.
On the Quick Query Creation page, enter the information required to create a service and select detailed options.
- Select the required information in the Version selection area.
Category RequiredDetailed description Quick Query Required Select Quick Query service version - Provide a list of available versions
Table. Quick Query Service Version Selection Item - Enter or select the required information in the Service Information Input area.
Category RequiredDetailed description Quick Query name Required Enter Quick Query name - must start with a lowercase English letter and must not end with a special character (
-), enter using lowercase letters, numbers, and special characters (-) with a length of 3 to 30 characters
Explanation Selection Enter additional information or description about Quick Query within 150 characters. Domain Settings Required Enter Quick Query domain - must start with a lowercase English letter and must not end with special characters (
-,.), use lowercase letters, numbers, and special characters (-,.) to enter 3 ~ 50 characters
- {Quick Query name}.{configured domain} becomes the Quick Query access URL.
Query engine type Required Select query engine type - Shared: A single query engine is shared among multiple users
- Personal: Each user uses a separate engine
Cluster size Required Select resource capacity for cluster configuration - When the engine type is selected as Shared
- If Auto Scaling is set to Enabled, you can choose the cluster capacity from Small, Medium, Large, Extra Large.
- If Auto Scaling is not set to Enabled, you can configure the cluster capacity by specifying Replica, CPU, and Memory.
- When the engine type is selected as Private
- You can select the cluster capacity from Small, Medium, Large, Extra Large.
- Engine capacity (when Auto Scaling is enabled)
- Small: 1Core, 4GB
- Medium: 4Core, 16GB
- Large: 8Core, 64GB
- Extra Large: 16Core, 128GB
- Engine capacity (when Auto Scaling is disabled)
- Replica: can be set from 1 to 9, default: 1
- CPU: can be set from 4 to 24 (allowed values: 4, 6, 8, 10, 12, 14, 16, 18, 20, 22, 24), default: 4
- Memory: can be set from 8 to 256 (allowed values: 8, 16, 32, 64, 128, 192, 256), default: 8
Maximum number of concurrent queries Required Select the maximum number of queries to run simultaneously in Quick Query - Available options: 32, 64, 96, 128
Data Service Console connection Required Enter the Data Service Console domain - must start with a lowercase English letter and must not end with a special character (
-,.), enter using lowercase letters, numbers, and special characters (-,.) with a length of 3 to 50 characters
Host Alias Select Add host information to be linked with Quick Query (up to 20 total, including defaults) - After selecting Use, click the + button
- Hostname: Enter 3~63 characters using lowercase letters, numbers, and special characters (
-,.) in host name or domain format
- IP: Enter in IP format
- To delete, click the X button
- The added host information can be used only if the firewall between the cluster and the server is open
Table. Quick Query service information entry items - must start with a lowercase English letter and must not end with a special character (
- In the Cluster Information Input area, enter or select the required information.
Category RequiredDetailed description Cluster name Required Enter cluster name - must start with a lowercase English letter and must not end with a special character (
-), use lowercase letters, numbers, and special characters (-) to enter 3 to 30 characters
Control area setting Required/Optional - Kubernetes version: Display Kubernetes version
- You can upgrade the Kubernetes version after provisioning.
- Public endpoint access: To allow external access to the Kubernetes API server endpoint, select Enabled and then enter the Access control IP range (cannot be changed after service request).
- Control plane logging: Choose whether to enable control plane logging
- If Enabled, you can view the cluster control plane’s Audit/Event logs in Management > Cloud Monitoring > Log Analytics.
- Each project receives 1 GB of log storage for all services free of charge, and logs exceeding 1 GB are deleted sequentially.
Network Settings Required Network Connection Settings - VPC: Use the same VPC as the Data Service Console
- Availability Zone: Select the Availability Zone of the chosen VPC
- Subnet: Select the subnet to use from the chosen VPC’s subnets
- Security Group: Click Search, then select a security group in the Select Security Group popup
File Storage Settings Required Select the file storage volume to use in the cluster - Default Volume (NFS): After clicking Search, in the Select File Storage popup, select the file storage
Table. Quick Query Service Cluster Information Input Items - must start with a lowercase English letter and must not end with a special character (
- Node Pool Information Input area, please enter or select the required information.
Category RequiredDetailed description Node pool configuration Required/Optional Enter detailed information for the node pool to add - * Items marked are required fields
- Query Engine Type is Public and Auto Scaling is selected as Disabled, only the Node Pool Configuration (Fixed) item can be set.
- Keypair: Choose the authentication method used to connect to the Virtual Server
Table. Quick Query service node pool information input fields - * Items marked are required fields
- In the Additional Information Input area, enter or select the required information.
Category RequiredDetailed description tag Selection Add tag - Add tag Click the button to create and add a tag, or add an existing tag
- You can add up to 50 tags
- The newly added tags are applied after the service creation is completed
Table. Quick Query service additional information input items
- Select the required information in the Version selection area.
Summary Check the detailed information and estimated charges generated in the panel, and click the Complete button.
- When creation is complete, check the resources you created on the Quick Query list page.
Quick Query View detailed information
You can view and edit the complete list of resources and detailed information for the Quick Query service. On the Quick Query Detail page, it consists of Detail Information, Tags, Operation History tabs.
To view detailed information about the Quick Query service, follow these steps.
- Click the All Services > Data Analytics > Quick Query menu. 1. Navigate to the Service Home page of Quick Query.
- On the Service Home page, click the Quick Query menu. 2. Go to the Quick Query List page.
- On the Quick Query List page, click the resource to view detailed information. 3. Go to the Quick Query Details page.
- Quick Query Details The top of the page displays status information and information about additional features.
Category Detailed description Status display Status of Quick Query created by the user - Creating: Creating
- Running: Creation complete, service available
- Updating: Updating settings
- Terminating: Terminating service
- Error: Error occurred during creation or service abnormal state
Hosts file setting information Button to view and copy the host file information for accessing Quick Query and Data Service Console Service termination Cancel service button Table. Quick Query status information and additional features
- Quick Query Details The top of the page displays status information and information about additional features.
Detailed Information
On the Quick Query List page, you can view detailed information of the selected resource and edit the information if needed.
| Category | Detailed description |
|---|---|
| service | Service Name |
| Resource Type | Resource Type |
| SRN | Unique resource ID in Samsung Cloud Platform
|
| Resource Name | resource name
|
| Resource ID | Unique resource ID in the service |
| Constructor | User who created the service |
| Creation Date/Time | Service creation date and time |
| Modifier | User who edited the service information |
| Modification date and time | Date and time the service information was modified |
| Quick Query name | Quick Query name |
| Explanation | Additional information or explanation about Quick Query |
| Version | Quick Query version |
| Service type | Quick Query service type |
| Quick Query engine type | |
| Engine Spec |
|
| Maximum number of concurrent queries | Maximum number of queries to run simultaneously in Quick Query |
| Domain Settings | Quick Query domain |
| Data Service Console | Data Service Console domain |
| Host Alias | Host information to be connected to Quick Query |
| Web URL | Web URL of Data Service Console and Quick Query |
| Cluster name | Cluster name of the configured servers |
| Installation node information | Detailed information of the installed node pool |
Tag
Quick Query list page lets you view, add, modify, or delete tag information for the selected resource.
| Category | Detailed description |
|---|---|
| Tag List | Tag list
|
Job History
Quick Query List page allows you to view the operation history of the selected resource.
| Category | Detailed description |
|---|---|
| Task History List | Resource change history
|
Quick Query Connect
To access Quick Query, follow these steps.
- Check the IP of the Windows system (PC) that will connect to Quick Query.
- Since external access is required, you need to check the system’s Public IP.
- Check that the IGW connection in the VPC where Quick Query is installed is set to enabled.
- An Internet Gateway must be configured to allow connections from external access.
- Add the following to the hosts file on a Windows system. 3. On the Quick Query detail screen, you can click Hosts file setting information to view it.
- Domain address of the Data Service Console
- Domain address of Data Service Console IAM
- Quick Query’s domain address
- Add the following rule to the VPC IGW Firewall you selected when applying for the Quick Query service.
Category Protocol Source Target IP Port Inbound TCP User IP Load Balancer service IP 80,443 표. VPC IGW Firewall 규칙 - Add the following rule to the Load Balancer Firewall you selected when applying for the Quick Query service.
Category Protocol Source Target IP Port Outbound TCP User IP Load Balancer service IP 80,443 Inbound TCP Load Balancer’s Source NAT IP Subnet range of the Kubernetes Node Pool 30000-32767 TCP Load Balancer’s Health Check IP Subnet range of the Kubernetes Node Pool 30000-32767 표. Load Balancer Firewall 규칙 - Add the following rule to the Security Group you selected when applying for the Quick Query service.
Category Protocol Target IP Port Inbound TCP Load Balancer’s Source NAT IP 30000-32767 TCP Load Balancer’s Health Check IP 30000-32767 표. Security Group 규칙 - On the Windows system (PC) you wish to access, launch Chrome, then navigate to the Quick Query URL.
Quick Query Cancellation
You can reduce operating costs by terminating the unused service. However, if you terminate the service, the running service may be discontinued immediately, so you should proceed with the termination only after fully considering the impact that may arise from the service interruption.
To cancel Quick Query, follow the steps below.
- Click the All Services > Data Analytics > Quick Query menu. 1. Navigate to Quick Query’s Service Home page.
- On the Service Home page, click the Quick Query menu. 2. Quick Query List Go to the page.
- Quick Query list On the page, select the resource to cancel, then click the Cancel Service button.
- Once termination is complete, check the Quick Query list page to see if the resource has been terminated.