This is the multi-page printable view of this section. Click here to print.

Return to the regular view of this page.

Overview

Service Overview

Data Ops is a managed workflow orchestration service based on Apache Airflow that creates workflows for data processing tasks that occur periodically or repeatedly and automates task scheduling. Users can automate the process of delivering useful data to the right place at the required time and monitor the configuration and progress of data pipelines.
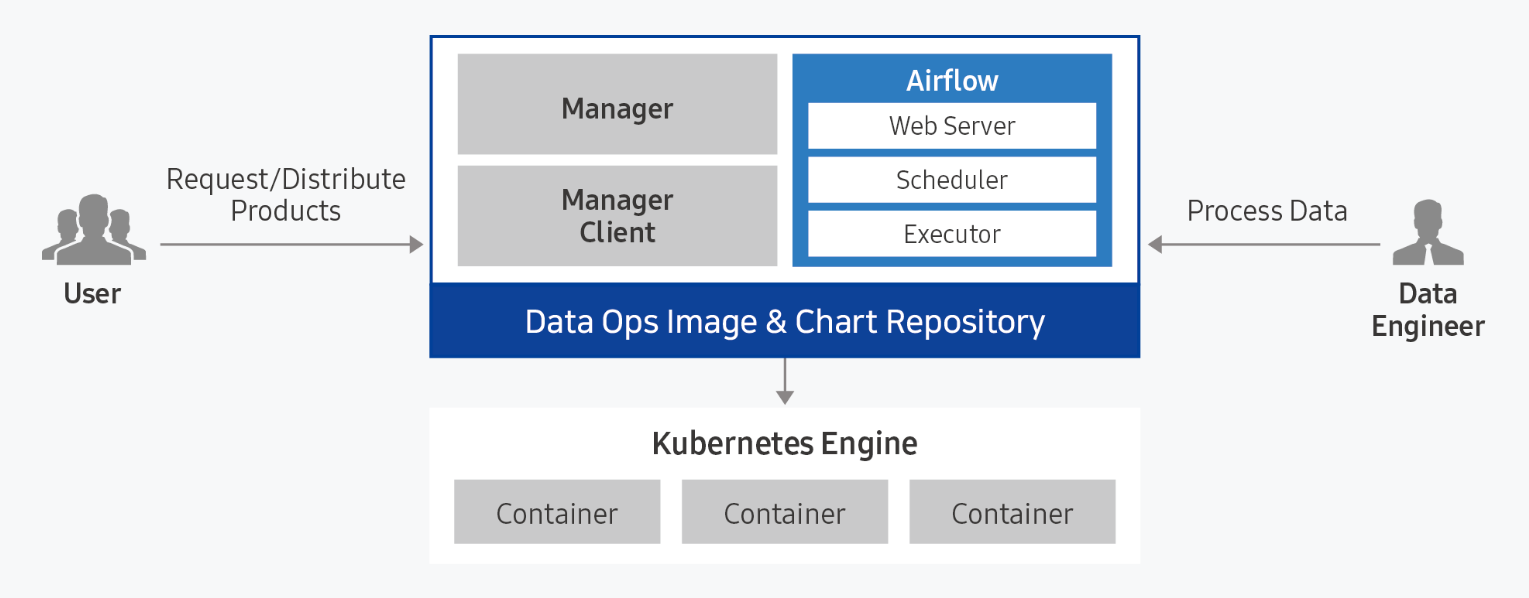
Diagram
Figure. Data Ops diagram

Provided features

Data Ops provides the following features.

  • Convenient Installation and Management: Data Ops can be easily installed via a web-based Console in a standard Kubernetes cluster environment. Apache Airflow and management modules are installed automatically, and the integrated dashboard provides unified monitoring of the web server and scheduler execution status.
  • Dynamic Pipeline Configuration: You can configure pipelines for data tasks based on Python code. Because it integrates with data task scheduling and creates tasks dynamically, you can freely design the desired workflow shape and scheduling.
  • Convenient workflow management: DAG (Direct Acyclic Graph: directed acyclic graph) configuration is visualized and managed through a web-based UI, allowing you to easily understand the sequence and parallel relationships of data flow. Additionally, you can easily manage each task’s timeout, retry count, and priority definitions.

Component

Data Ops consists of Manager and Service modules and provides a packaged Apache Airflow.

Data Ops Manager

Data Ops Manager provides various managing features to enable more efficient use of Airflow.

  • Through Ops Manager, you can upload Plugin File, Shared File, and Python Library File for use in Ops Service.
  • You can easily provision configuration information for Airflow components within the cluster.
  • You can manage configuration information for other services within the Airflow cluster and provision it easily.

Data Ops Service

  • We provide a managed workflow orchestration service based on Apache Airflow.
  • When providing Airflow, you can set the Description, required resource size, DAGs GitSync, and Host Alias.
  • After creating the service, you can modify the Description, resource size, DAGs GitSync, and Host Alias to apply changes to the service.

Server spec type

When creating a Data Ops service, check the following.

  • Recommended Service Installation Specifications: CPU KubernetesExecutor 43 core, CPU CeleryExecutor 25 core, Memory 50 GB, Storage 100 GB or more
Reference
  • Before creating the Data Ops service, you need to install the Ingress Controller.
  • Only one Ingress Controller can be installed in a Kubernetes cluster.
  • For more details, refer to Ingress Controller Installation.

Provision status by region

Data Ops is available in the environments below.

regionProvision status
Korea West (kr-west1)Provide
Korea East (kr-east1)Provide
South Korea South 1 (kr-south1)Not provided
South Korea South 2 (kr-south2)Not provided
Korea South 3 (kr-south3)Not provided
Table. Data Ops regional availability status

Pre-service

This is a list of services that must be pre-configured before creating the service. Please refer to the guide provided for each service for details and prepare them in advance.

Service CategoryserviceDetailed description
StorageFile StorageStorage that enables multiple client servers to share files over a network connection.
ContainerKubernetes EngineKubernetes container orchestration service
Table. Data Ops pre-service

1 - ServiceWatch metric

In ServiceWatch, you can view Kubernetes Engine metrics for the Kubernetes Engine created by Data Ops. As with Kubernetes Engine, the metrics provided by default monitoring are data collected at one‑minute intervals.

Reference
Refer to the ServiceWatch guide for checking metrics in ServiceWatch.

Basic Metrics

The following are the default metrics for the Kubernetes Engine namespace.

The metrics whose names are displayed in bold below are the key metrics selected from the default metrics provided by Kubernetes Engine. Key metrics are used to build service dashboards that are automatically created for each service in ServiceWatch.

Each metric provides guidance in the user guide on which statistical values are meaningful when querying that metric, and among the meaningful statistics, the values shown in bold are the primary statistics. In the service dashboard, you can view key metrics using primary statistical values.

Indicator nameDetailed descriptionunitmeaningful statistics
cluster_upCluster upCount
  • Total
  • Average
  • Maximum
  • Minimum
cluster_node_countNumber of cluster nodesCount
  • Total
  • Average
  • Maximum
  • Minimum
cluster_failed_node_countNumber of failed nodes in the clusterCount
  • Total
  • Average
  • Maximum
  • Minimum
cluster_namespace_phase_countNumber of cluster namespace phasesCount
  • Total
  • Average
  • Maximum
  • Minimum
cluster_pod_phase_countCluster pod phase countCount
  • Total
  • Average
  • Maximum
  • Minimum
node_cpu_allocatableNode CPU allocatable amount-
  • Total
  • Average
  • Maximum
  • Minimum
node_cpu_capacityNode CPU capacity-
  • Total
  • Average
  • Maximum
  • Minimum
node_cpu_usageNode CPU usage-
  • Total
  • Average
  • Maximum
  • Minimum
node_cpu_utilizationNode CPU usage-
  • Total
  • Average
  • Maximum
  • Minimum
node_memory_allocatableNode memory allocatable amountBytes
  • Total
  • Average
  • Maximum
  • Minimum
node_memory_capacityNode memory capacityBytes
  • Total
  • Average
  • Maximum
  • Minimum
node_memory_usageNode memory usageBytes
  • Total
  • Average
  • Maximum
  • Minimum
node_memory_utilizationNode memory utilization-
  • Total
  • Average
  • Maximum
  • Minimum
node_network_rx_bytesNode network received bytesBytes/Second
  • Total
  • Average
  • Maximum
  • Minimum
node_network_tx_bytesNode network transmitted bytesBytes/Second
  • Total
  • Average
  • Maximum
  • Minimum
node_network_total_bytesTotal bytes of the node networkBytes/Second
  • Total
  • Average
  • Maximum
  • Minimum
node_number_of_running_podsNumber of pods running on the nodeCount
  • Total
  • Average
  • Maximum
  • Minimum
namespace_number_of_running_podsNumber of running pods in the namespaceCount
  • Total
  • Average
  • Maximum
  • Minimum
namespace_deployment_pod_countNamespace deployment pod countCount
  • Total
  • Average
  • Maximum
  • Minimum
namespace_statefulset_pod_countNamespace StatefulSet pod countCount
  • Total
  • Average
  • Maximum
  • Minimum
namespace_daemonset_pod_countNamespace daemonset pod countCount
  • Total
  • Average
  • Maximum
  • Minimum
namespace_job_active_countActive namespace job countCount
  • Total
  • Average
  • Maximum
  • Minimum
namespace_cronjob_active_countNumber of active namespace cronjobsCount
  • Total
  • Average
  • Maximum
  • Minimum
pod_cpu_usagePod CPU usage-
  • Total
  • Average
  • Maximum
  • Minimum
pod_memory_usagePod memory usageBytes
  • Total
  • Average
  • Maximum
  • Minimum
pod_network_rx_bytesPod network received bytesBytes/Second
  • Total
  • Average
  • Maximum
  • Minimum
pod_network_tx_bytesPod network transmitted bytesBytes/Second
  • Total
  • Average
  • Maximum
  • Minimum
pod_network_total_bytesPod network total bytesCount
  • Total
  • Average
  • Maximum
  • Minimum
container_cpu_usageContainer CPU usage-
  • Total
  • Average
  • Maximum
  • Minimum
container_cpu_limitContainer CPU limit-
  • Total
  • Average
  • Maximum
  • Minimum
container_cpu_utilizationContainer CPU usage-
  • Total
  • Average
  • Maximum
  • Minimum
container_memory_usageContainer memory usageBytes
  • Total
  • Average
  • Maximum
  • Minimum
container_memory_limitContainer memory limitBytes
  • Total
  • Average
  • Maximum
  • Minimum
container_memory_utilizationContainer memory usage-
  • Total
  • Average
  • Maximum
  • Minimum
node_gpu_countNode GPU countCount
  • Total
  • Average
  • Maximum
  • Minimum
gpu_tempGPU temperature-
  • Total
  • Average
  • Maximum
  • Minimum
gpu_power_usageGPU power usage-
  • Total
  • Average
  • Maximum
  • Minimum
gpu_utilGPU utilizationPercent
  • Total
  • Average
  • Maximum
  • Minimum
gpu_sm_clockGPU SM clock-
  • Total
  • Average
  • Maximum
  • Minimum
gpu_fb_usedGPU FB usageMegabytes
  • Total
  • Average
  • Maximum
  • Minimum
gpu_tensor_activeGPU Tensor Utilization-
  • Total
  • Average
  • Maximum
  • Minimum
pod_gpu_utilPod GPU utilizationPercent
  • Total
  • Average
  • Maximum
  • Minimum
pod_gpu_tensor_activePod GPU Tensor Utilization Rate-
  • Total
  • Average
  • Maximum
  • Minimum
Table. Kubernetes Engine Basic Metrics