Service Overview
Cloud Hadoop is a service for easily and quickly analyzing large-scale data, providing a Hadoop cluster (computing resources, management tools, and applications) used for big data processing and analysis in the SCP environment.
Features
Cloud Hadoop provides an automated cluster creation service through the Hadoop Manager and the Hadoop Ecosystem(ecosystem) composed of Spark, HDFS(Hadoop distributed file system), Hive, etc., enabling anyone to easily build, optimize, or flexibly scale infrastructure for big data analysis.
Service Diagram
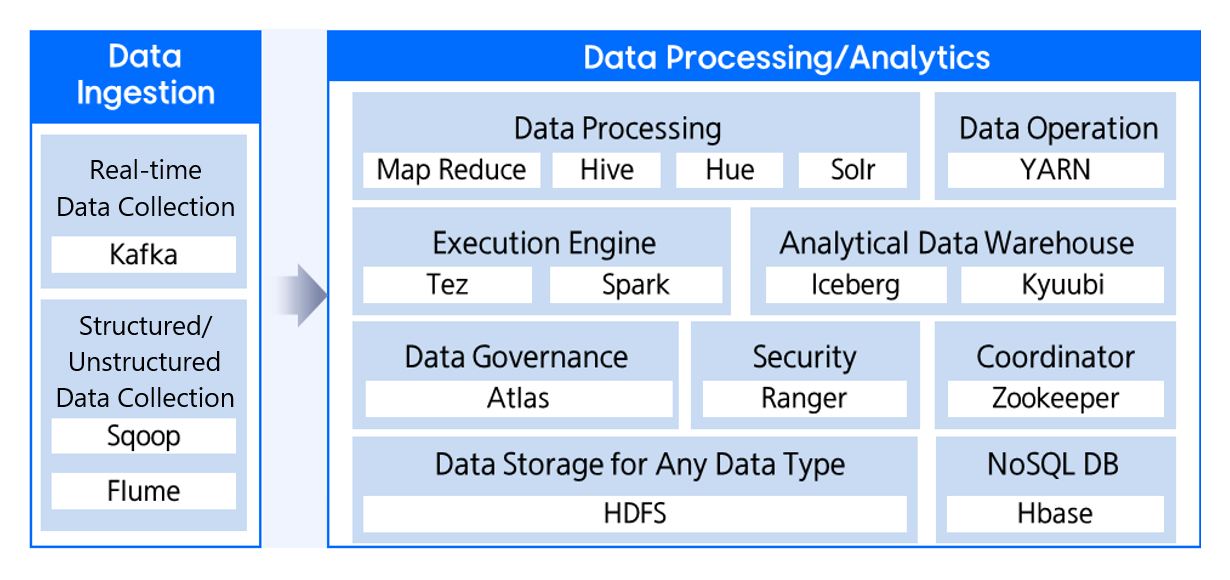
Provided features
Cloud Hadoop provides the following features.
Provide Hadoop Cluster as a cloud service
- Providing a Hadoop Cluster through automated cluster installation in the SDS Cloud environment
- Perform essential operational activities for cluster management (cluster operation/monitoring)
- Provides a Hadoop ecosystem with verified interoperability and allows users to access the server (VM)
Offer the Hadoop service stack as separate products (increase nodes per product)
- Minimum node allocation per product for stable service operation
- Providing diverse product selection opportunities to meet user needs and reduce costs
Providing user-friendly features for Hadoop services
- Provides installation and management functions for each Hadoop ecosystem, optimal configuration values, and version management features.
- Provide an integrated monitoring dashboard for system resources
- Provides Service Failure Alert feature
Component
We package the major components of the Hadoop ecosystem to deliver an enterprise data cloud.
Service Configuration
Cloud Hadoop provides the following services.
- Basic Installation Service
- HDFS 3.3.6
- YARN 3.3.6
- Hbase 2.4.17
- Hive 3.1.2
- Tez 0.9.1
- Hue 4.11.0
- Solr 8.11.4
- Spark 3.4.1
- Zookeeper 3.8.5
- Additional Option Service
- Data Governance: Atlas 2.1.0, Ranger 2.1.0
- Analytical Data Warehouse: Iceberg 1.8.0, Kyuubi 1.10.2
- Data Ingestion: Sqoop 1.4.7, Kafka 3.9.1, Flume 1.11.0
Server type
The server types supported by Cloud Hadoop are as follows.
Category | example | Detailed description |
|---|---|---|
| Server type | Standard | Provided server types
|
| Server size | s1v4m32 | Provided server specifications
|
The minimum specifications for using Cloud Hadoop are as follows.
Category | Algebra | Instance size (user-selected value) |
|---|---|---|
| Master | 2(fixed) | CPU: 4 Core Memory: 32 GB |
| Worker | 3(minimum) | CPU: 4 Core Memory: 32 GB |
| Data Governance | None | |
| Analytical Data Warehouse | None | |
| Ingestion | 3 (minimum) | CPU: 4 Core Memory: 32 GB |
Provision status by region
Cloud Hadoop is available in the following environments.
| region | Provision status |
|---|---|
| Korea West (kr-west1) | Provide |
| Korea East (kr-east1) | Provide |
| South Korea South1(kr-south1) | Not provided |
| South Korea South 2 (kr-south2) | Not provided |
| South Korea 3 (kr-south3) | Not provided |
Preliminary Service
This is a list of services that need to be pre-configured before creating the service. Please refer to the guide provided for each service and prepare in advance.
| Service Category | service | Detailed description |
|---|---|---|
| Networking | VPC | A service that provides an isolated virtual network in a cloud environment |
| Networking | Security Group | Virtual firewall that controls server traffic |
| Storage | Object Storage | Object storage that simplifies data storage and retrieval |