Provides an analysis service that can process big data easily and quickly.
This is the multi-page printable view of this section. Click here to print.
Data Analytics
- 1: Event Streams
- 1.1: Overview
- 1.1.1: Server Type
- 1.1.2: Monitoring Metrics
- 1.2: How-to guides
- 1.3: API Reference
- 1.4: CLI Reference
- 1.5: Release Note
- 2: Search Engine
- 2.1: Overview
- 2.1.1: Server Type
- 2.1.2: Monitoring Metrics
- 2.2: How-to guides
- 2.3: API Reference
- 2.4: CLI Reference
- 2.5: Release Note
- 3: Vertica(DBaaS)
- 3.1: Overview
- 3.1.1: Server Type
- 3.1.2: Monitoring Metrics
- 3.2: How-to guides
- 3.2.1: Vertica Backup and Recovery
- 3.3: API Reference
- 3.4: CLI Reference
- 3.5: Release Note
- 4: Data Flow
- 4.1: Overview
- 4.2: How-to guides
- 4.2.1: Data Flow Services
- 4.2.2: Installing Ingress Controller
- 4.3: API Reference
- 4.4: CLI Reference
- 4.5: Release Note
- 5: Data Ops
- 5.1: Overview
- 5.2: How-to guides
- 5.2.1: Data Ops Services
- 5.2.2: Installing Ingress Controller
- 5.3: API Reference
- 5.4: CLI Reference
- 5.5: Release Note
- 6: Quick Query
- 6.1: Overview
- 6.2: How-to guides
- 6.3: API Reference
- 6.4: CLI Reference
- 6.5: Release Note
1 - Event Streams
1.1 - Overview
Service Overview
Event Streams provides fully managed creation and configuration of the open source Apache Kafka for large-scale, massive message data processing. Samsung Cloud Platform automates the creation and configuration of Apache Kafka through a web-based console, and users can configure the main components of Apache Kafka—Broker, Zookeeper, and AKHQ—in a single or clustered form.
Event Streams cluster is composed of multiple Broker nodes, and Brokers can be installed from a minimum of 1 to a maximum of 10, typically installed with 3 or more. Zookeeper can be installed separately to manage the distributed Brokers, and if not installed separately, it is installed together on the Broker node. Additionally, a tool for managing Kafka called AKHQ (Apache Kafka HQ) is provided, allowing users to manage cluster operations through it.
Provided Features
Event Streams provides the following features.
- Auto Provisioning (Auto Provisioning): You can configure and set up an Apache Kafka cluster via the UI.
- Operation Control Management: Provides a function to control the status of running servers. Restart is possible to apply configuration values, along with starting and stopping the cluster.
- Providing AKHQ: By providing AKHQ, a tool that can manage Kafka, users can manage and monitor clusters through it.
- Broker node addition: If expansion is needed to improve cluster performance and stability, you can add nodes with the same specifications as the Broker nodes in use.
- Parameter Management: Performance improvement and security-related configuration parameters can be set and modified.
- Monitoring: CPU, memory, and cluster performance monitoring information can be viewed through the Cloud Monitoring service.
Components
Event Streams provides pre-validated engine versions and various server types in accordance with the open source support policy. Users can select and use them according to the scale of the service they wish to configure.
Engine Version
The engine versions supported by Event Streams are as follows.
Technical support can be used until the supplier’s EoTS (End of Technical Service) date, and the EOS date when new creation is stopped is set to six months before the EoTS date.
According to the supplier’s policy, the EOS and EoTS dates may change, so please refer to the supplier’s license management policy page for details.
- Apache Kafka: https://docs.confluent.io/platform/current/installation/versions-interoperability.html
Notice
Apache Kafka 3.9.1 version is scheduled to be provided after December 18, 2025. The actual service provision schedule may change.
| Provided Version | EoS Date | EoTS Date |
|---|---|---|
| 3.8.0 | 2026-06 (scheduled) | 2026-12-02 |
Table. Engine versions provided for Event Streams
Server Type
The server types supported by Event Streams are as follows.
For detailed information about the server types provided by Event Streams, please refer to Event Streams Server Types.
Standard ess1v2m4
| Category | Example | Detailed description |
|---|---|---|
| Server Type | Standard | Provided Server Types
|
| Server Specifications | ess1 | Provided Server Specifications
|
| Server specifications | v2 | Number of vCores
|
| Server Specifications | m4 | Memory Capacity
|
Table. Event Streams server type components
Preceding Service
This is a list of services that must be pre-configured before creating the service. Please refer to the guide provided for each service for details and prepare in advance.
| Service Category | Service | Detailed Description |
|---|---|---|
| Networking | VPC | A service that provides an independent virtual network in a cloud environment |
Table. Event Streams Preceding Service
1.1.1 - Server Type
Event Streams server type
Event Streams provides a server type composed of various combinations such as CPU, Memory, Network Bandwidth, etc. When creating Event Streams, Apache Kafka is installed according to the selected server type suitable for the purpose of use.
The server types supported in Event Streams are as follows.
Standard ess1v2m4
Classification | Example | Detailed Description |
|---|---|---|
| Server Type | Standard | Provided server type distinction
|
| Server Specifications | ess1 | Classification of provided server type and generation
|
| Server Specification | v2 | Number of vCores
|
| Server Specification | m4 | Memory Capacity
|
Table. Event Streams server type formats
Reference
Please select the server type by checking the node’s minimum specifications as follows.
| Division | vCPU | Memory |
|---|---|---|
| Broker | 2 vCore | 4 GB |
| Zookeeper | 1 vCore | 2 GB |
ess1 server type
The ess1 server type of Event Streams is provided with standard specifications (vCPU, Memory) and is suitable for various database workloads.
- Up to 3.3Ghz Intel 3rd generation (Ice Lake) Xeon Gold 6342 Processor Supports up to 16 vCPUs and 64 GB of memory
- Up to 12.5 Gbps networking speed
| Classification | Server Type | vCPU | Memory | Network Bandwidth |
|---|---|---|---|---|
| Standard | ess1v1m2 | 1 vCore | 2 GB | Up to 10 Gbps |
| Standard | ess1v2m4 | 2 vCore | 4 GB | Up to 10 Gbps |
| Standard | ess1v2m8 | 2 vCore | 8 GB | Up to 10 Gbps |
| Standard | ess1v4m8 | 4 vCore | 8 GB | Up to 10 Gbps |
| Standard | ess1v4m16 | 4 vCore | 16 GB | Up to 10 Gbps |
| Standard | ess1v8m16 | 8 vCore | 16 GB | Up to 10 Gbps |
| Standard | ess1v8m32 | 8 vCore | 32 GB | Up to 10 Gbps |
| Standard | ess1v16m32 | 16 vCore | 32 GB | Up to 12.5 Gbps |
| Standard | ess1v16m64 | 16 vCore | 64 GB | Up to 12.5 Gbps |
Table. Event Streams server type specification - ess1 server type
ess2 server type
The ess2 server type of Event Streams is provided with standard specifications (vCPU, Memory) and is suitable for various database workloads.
- Up to 3.2GHz Intel 4th generation (Sapphire Rapids) Xeon Gold 6448H Processor
- Supports up to 16 vCPUs and 64 GB of memory
- Up to 12.5 Gbps networking speed
| Classification | Server Type | CPU vCore | Memory | Network Bandwidth(Gbps) |
|---|---|---|---|---|
| Standard | ess2v1m2 | 1 vCore | 2 GB | Up to 10 Gbps |
| Standard | ess2v2m4 | 2 vCore | 4 GB | Up to 10 Gbps |
| Standard | ess2v2m8 | 2 vCore | 8 GB | Up to 10 Gbps |
| Standard | ess2v4m8 | 4 vCore | 8 GB | Up to 10 Gbps |
| Standard | ess2v4m16 | 4 vCore | 16 GB | Up to 10 Gbps |
| Standard | ess2v8m16 | 8 vCore | 16 GB | Up to 10 Gbps |
| Standard | ess2v8m32 | 8 vCore | 32 GB | Up to 10 Gbps |
| Standard | ess2v16m32 | 16 vCore | 32 GB | Up to 12.5 Gbps |
| Standard | ess2v16m64 | 16 vCore | 64 GB | Up to 12.5 Gbps |
Table. Event Streams Server Type Specifications - ess2 Server Type
esh2 server type
The esh2 server type of Event Streams is provided with high-capacity server specifications and is suitable for database workloads for large-scale data processing.
- Up to 3.2GHz Intel 4th generation (Sapphire Rapids) Xeon Gold 6448H Processor
- Supports up to 32 vCPUs and 128 GB of memory
- Up to 25Gbps networking speed
| Division | Server Type | vCPU | Memory | Network Bandwidth |
|---|---|---|---|---|
| High Capacity | esh2v32m64 | 32 vCore | 64 GB | Up to 25 Gbps |
| High Capacity | esh2v32m128 | 32 vCore | 128 GB | Up to 25 Gbps |
Table. Event Streams server type specification - esh2 server type
1.1.2 - Monitoring Metrics
Event Streams Monitoring Metrics
The following table shows the performance monitoring metrics of Event Streams that can be checked through Cloud Monitoring. For detailed usage of Cloud Monitoring, please refer to the Cloud Monitoring guide.
For server monitoring metrics of Event Streams, please refer to the Virtual Server Monitoring Metrics guide.
| Performance Item | Detailed Description | Unit |
|---|---|---|
| AKHQ State [PID] | AHKQ process PID | PID |
| Connections [Zookeeper Client] | Number of ZooKeeper connections | cnt |
| Disk Used | datadir usage | bytes |
| Failed [Client Fetch Request] | Number of failed client fetch requests | cnt |
| Failed [Produce Request] | Number of failed produce requests | cnt |
| Incomming Messages | Number of messages received by the broker | cnt |
| Instance State [PID] | Kafka process PID | PID |
| Kibana state [PID] | Kibana process PID | PID |
| Leader Elections | Number of leader elections | cnt |
| Leader Elections [Unclean] | Number of unclean leader elections | cnt |
| Log Flushes | Number of log flushes | cnt |
| Network In Bytes | Total bytes received by all topics | bytes |
| Network Out Bytes | Total bytes sent by all topics | bytes |
| Rejected Bytes | Total bytes rejected by all topics | bytes |
| Request Queue Length | Request queue size | cnt |
| Shards | Number of cluster shards | cnt |
| Zookeeper Sessions [Closed] | Number of ZooKeeper sessions closed per second | cnt |
| Zookeeper Sessions [Expired] | Number of ZooKeeper sessions expired per second | cnt |
| Zookeeper State [PID] | Zookeeper process PID | PID |
Table. Event Streams Monitoring Metrics
1.2 - How-to guides
The user can enter the necessary information of Event Streams through the Samsung Cloud Platform Console and create the service by selecting detailed options.
Creating Event Streams
You can create and use the Event Streams service in the Samsung Cloud Platform Console.
Notice
Please configure the Subnet type of VPC to General before creating the service.
- If the Subnet type is Local, the creation of the corresponding Database service is not possible.
To create Event Streams, follow these procedures.
Click All services > Data Analytics > Event Streams menu. It moves to the Service Home page of Event Streams.
On the Service Home page, click the Create Event Streams button. It moves to the Create Event Streams page.
Event Streams Creation page, enter the information required for service creation and select detailed options.
Image and Version Selection area, please select the necessary information.
Classification NecessityDetailed Description Image Version Required Provides a list of Event Streams versions Table. Event Streams service information input itemsEnter Service Information Enter or select the required information in the area.
Classification NecessityDetailed Description Server Name Prefix Required The server name where Apache Kafka will be installed - Starts with lowercase English letters, and uses lowercase letters, numbers, and special characters(
-) to input 3 ~ 13 characters
- A postfix such as 001, 002 is attached based on the server name to create the actual server name
Cluster Name Required Name of the cluster that the servers are configured in - Enter in English, 3-20 characters
- A cluster is a unit that bundles multiple servers
Broker > Broker Node count required Broker Node count Broker > Server Type Required The type of server on which the Broker will be installed - Standard: Standard specification commonly used
- High Capacity: High-capacity server with 24vCore or more
- For more information about the server types provided by Event Streams, see Event Streams server types
Broker > Planned Compute Selection Current status of resources with Planned Compute set - In use: Number of resources with Planned Compute set that are currently in use
- Settings: Number of resources with Planned Compute set
- Coverage preview: Amount applied by resource-based Planned Compute
- Apply for Planned Compute service: Move to the Planned Compute service application page
- For more information, see How to apply for Planned Compute
Broker > Block Storage Required Block Storage type to be used for Broker node - Base OS: Area where the engine is installed
- DATA: Area for storing data files
- Please select the storage type and enter the capacity. (For more information on each Block Storage type, see Creating Block Storage)
- SSD: High-performance general volume
- HDD: General volume
- SSD_KMS/HDD_KMS: Additional encrypted volume using Samsung Cloud Platform KMS (Key Management System) encryption key
- Capacity should be entered in multiples of 8 within the range of 16 to 5,120
- Please select the storage type and enter the capacity. (For more information on each Block Storage type, see Creating Block Storage)
Zookeeper separate installation > use selection Whether to install Zookeeper node separately - Use is selected, Zookeeper nodes are installed separately.
- If Zookeeper nodes are not installed separately, Broker nodes also perform the Zookeeper role.
Zookeeper separate installation > Server type Selection The server type where Zookeeper will be installed - Zookeeper node provides vCPU 1, Memory 2G or vCPU 2, Memory 4G
Zookeeper separate installation > Planned Compute selection Current status of resources with Planned Compute set - In use: Number of resources in use among those with Planned Compute set
- Settings: Number of resources with Planned Compute set
- Coverage preview: Amount applied by resource-based Planned Compute
- Apply for Planned Compute service: Move to the Planned Compute service application page
- For more details, refer to Apply for Planned Compute
Zookeeper separate installation > Block Storage required Block Storage type to be used for Zookeeper node - Basic OS: area where the engine is installed
- DATA: area for storing data files
- After selecting the storage type, enter the capacity. (For more information on each Block Storage type, see Creating Block Storage)
- SSD: high-performance general volume
- HDD: general volume
- SSD_KMS/HDD_KMS: additional encrypted volume using Samsung Cloud Platform KMS (Key Management System) encryption key
- Capacity should be entered in multiples of 8 within the range of 16 to 5,120
- After selecting the storage type, enter the capacity. (For more information on each Block Storage type, see Creating Block Storage)
AKHQ > Use Required Whether AKHQ is installed - Use is selected, AKHQ will be installed.
AKHQ > Server Type Required The type of server where AKHQ will be installed - AKHQ only provides vCPU 2, Memory 4G type
AKHQ > Planned Compute Selection Current status of resources with Planned Compute set - In use: Number of resources with Planned Compute set that are in use
- Settings: Number of resources with Planned Compute set
- Coverage preview: Amount applied by resource-based Planned Compute
- Apply for Planned Compute service: Move to the Planned Compute service application page
- For more information, see Apply for Planned Compute
AKHQ > Block Storage required The type of Block Storage to be used on the server where AKHQ will be installed - Basic OS: The area where the engine is installed
AKHQ > AKHQ account required AKHQ account - Use lowercase English letters to enter 2-20 characters
AKHQ > AKHQ password required AKHQ account password - Enter 8-30 characters, including English, numbers, and special characters (excluding
"’)
AKHQ > AKHQ password confirmation required AKHQ account password confirmation - Re-enter the AKHQ account password identically
AKHQ > AKHQ Port number required AKHQ connection port number - The port number is automatically set to 8080 and cannot be modified
Network > Common Settings Required Network settings for servers created by the service - Select if you want to apply the same settings to all servers being installed
- Select pre-created VPC and Subnet
- IP: Only automatic creation is possible
- Public NAT settings are only possible in server-specific settings.
Network > Server-specific settings Required Network settings for installing servers created by the service - Select to apply different settings for each server being installed
- Select pre-created VPC and Subnet
- IP: Enter the IP for each server
- Public NAT feature is available only when the VPC is connected to the Internet Gateway, checking Use allows selection from the reserved IP in the VPC product’s Public IP. For more information, see Creating Public IP
IP Access Control Select Set service access policy - Set access policy for IP entered on the page, so you don’t need to set Security Group policy separately.
- Enter in IP format (e.g.,
192.168.10.1) or CIDR format (e.g.,192.168.10.0/24,192.168.10.1/32), and click the Add button
- To delete the entered IP, click the x button next to the entered IP
Maintenance period Select Event Streams maintenance period - Use Select the day, start time, and duration
- It is recommended to set the maintenance period for stable management of the service. Patch work will be carried out at the set time and service interruption may occur
- Issues caused by not applying patches (setting to not in use) are not the responsibility of our company
Table. Event Streams Service Configuration Items- Starts with lowercase English letters, and uses lowercase letters, numbers, and special characters(
Database Configuration Required Information Input area, please enter or select the required information.
Classification NecessityDetailed Description Zookeeper SASL account required Zookeeper account - Use lowercase English letters, 2-20 characters
Zookeeper SASL password required Zookeeper account password - Enter 8-30 characters including English, numbers, and special characters (excluding
"’)
Zookeeper SASL password confirmation required Confirm Zookeeper account password - Re-enter the Zookeeper SASL account password identically
Zookeeper Port number required Zookeeper port number 1,024 ~ 65,535can be entered as one of them, and Broker port or2888,3888cannot be used
Broker SASL account required Kafka connection account - Enter within 2-20 characters using lowercase English letters
Broker SASL password required Kafka connection account password - Enter 8-30 characters, including English, numbers, and special characters (excluding
"’)
Broker SASL password confirmation required Kafka connection account password confirmation - Re-enter the Broker SASL account password identically
Broker Port number required Kafka port number 1,024 ~ 65,435can be entered as one of them, and Broker port or2888,3888cannot be used
Parameter Required Event Streams configuration parameters - Inquiry button can be clicked to check detailed information of parameters
- Parameter modification is possible after service creation is completed, and restart is required when modified
Time Zone Selection Standard Time Zone where the service will be used Table. Essential information input items for Event Streams Database configurationEnter Additional Information Enter or select the required information in the area.
Classification NecessityDetailed Description Tag Selection Tag addition - Tag addition button to create and add tags or add existing tags
- Up to 50 tags can be added
- Newly added tags are applied after service creation is completed
Table. Event Streams service additional information input items
In the Summary panel, review the detailed information and estimated charges, and click the Complete button.
- Once creation is complete, check the created resource on the Resource List page.
Event Streams detailed information check
The Event Streams service allows you to view and modify the list of all resources and detailed information. The Event Streams details page consists of Details, Tags, Activity tabs.
To view detailed information about the Event Streams service, follow these steps.
- Click All services > Data Analytics > Event Streams menu. It moves to the Service Home page of Event Streams.
- On the Service Home page, click the Event Streams menu. It moves to the Event Streams list page.
- Event Streams list page, click on the resource to check the detailed information. Move to the Event Streams details page.
- Event Streams details page top shows status information and additional function information.
| Division | Detailed Description |
|---|---|
| Cluster Status | Cluster Status
|
| Cluster Control | Buttons that can change the cluster status
|
| Additional features more | Cluster related management buttons
|
| Service Cancellation | Button to cancel the service |
Table. Event Streams status information and additional features
Detailed Information
On the Event Streams list page, you can check the detailed information of the selected resource and modify the information if necessary.
| Classification | Detailed Description |
|---|---|
| Server Information | Server information configured in the corresponding cluster
|
| Service | Service Name |
| Resource Type | Resource Type |
| SRN | Unique resource ID in Samsung Cloud Platform
|
| Resource Name | Resource Name
|
| Resource ID | Unique resource ID in the service |
| Creator | User who created the service |
| Creation Time | Time when the service was created |
| Modifier | Service information modified user |
| Modified Date | Date when service information was modified |
| Image/Version | Installed service image and version information |
| Cluster Name | Server cluster name composed of servers |
| Planned Compute | Planned Compute settings for current resources
|
| Maintenance period | Patch work period setting status
|
| Time Zone | Standard time zone where the service will be used |
| Zookeeper Port number | Zookeeper port number |
| Broker Port number | Kafka port number |
| AKHQ Connection Information | AKHQ Connection Information |
| Network | Installed network information(VPC, Subnet) |
| IP Access Control | Service Access Policy Setting
|
| Zookeeper | Zookeeper node’s server type, default OS, additional disk information
|
| Broker | Broker node’s server type, default OS, additional disk information
|
| AKHQ | AKHQ node’s server type, basic OS information
|
Fig. Event Streams detailed information items
Tag
On the Event Streams list page, you can check the tag information of the selected resource, and add, change, or delete it.
| Classification | Detailed Description |
|---|---|
| Tag list | Tag list
|
Fig. Event Streams tags tab items
Work History
You can check the operation history of the selected resource on the Event Streams list page.
| Classification | Detailed Description |
|---|---|
| Work history list | Resource change history
|
Fig. Event Streams work history tab detailed information items
Managing Event Streams Resources
If you need to change the existing setup options for the generated Event Streams resource or manage Parameters, or configure additional Broker Nodes, you can perform the task from the Event Streams details page.
Operating Control
If changes occur to the Event Streams resource while it is running, you can start, stop, or restart it.
To control the operation of Event Streams, follow these procedures.
- Click All services > Data Analytics > Event Streams menu. It moves to the Service Home page of Event Streams.
- On the Service Home page, click the Event Streams menu. It moves to the Event Streams list page.
- Event Streams list page, click the resource to control the operation. Move to the Event Streams details page.
- Check the status of Event Streams and complete the change through the control buttons below.
- Start: The server where the Event Streams service is installed and the Event Streams service is running.
- 중지: Event Streams service installed server and Event Streams service will be stopped.
- Restart: Only the Event Streams service will be restarted.
Synchronizing Service Status
You can query the current server status and synchronize it to the Console.
To synchronize the service status of Event Streams, follow these procedures.
- Click All services > Data Analytics > Event Streams menu. It moves to the Service Home page of Event Streams.
- On the Service Home page, click the Event Streams menu. It moves to the Event Streams list page.
- On the Event Streams list page, click the resource to query the service status. It moves to the Event Streams details page.
- Service Status Synchronization button should be clicked. It takes a little time to retrieve, and during retrieval, the cluster changes to Synchronizing status.
- Once the inquiry is completed, the status of the server information item is updated, and the cluster is changed to the Running state.
Managing Parameters
It provides parameter inquiry and modification functions.
To view or modify the configuration parameters, follow these steps.
- 모든 서비스 > Data Analytics > Event Streams menu should be clicked. It moves to the Service Home page of Event Streams.
- Service Home page, click the Event Streams menu. It moves to the Event Streams list page.
- Event Streams list page, click the resource you want to query and modify parameters. It moves to the Event Streams detail page.
- Click the Parameter Management button. It moves to the Parameter Management page.
- On the Parameter Management page, click the Search button. The Database Search popup window opens.
- To inquire about parameter information, click the Confirm button. It may take some time to retrieve.
- You can modify the Parameter information after performing the inquiry.
- To modify the Parameter information, click the Modify button and enter the modification details in the Custom Value area of the Parameter to be modified.
- If the application type is dynamic, it is reflected immediately, and if it is static, a service restart is required, so the service is stopped.
- When the input is complete, click the Save button.
Changing the Server Type
You can change the configured server type.
To change the server type, follow these steps.
Caution
- If the server type is configured as Standard, it cannot be changed to High Capacity. If you want to change to High Capacity, please create a new service.
- Modifying the server type requires a server restart. Please check separately for SW license modifications and SW settings due to specification changes.
- Click All services > Data Analytics > Event Streams menu. It moves to the Service Home page of Event Streams.
- On the Service Home page, click the Event Streams menu. It moves to the Event Streams list page.
- On the Event Streams list page, click the resource for which you want to change the server type. It moves to the Event Streams detail page.
- Click the Edit button of the server type you want to change at the bottom of the detailed information. The Server Type Edit popup window opens.
- Server Type Modification In the server type modification popup window, select the server type and click the OK button.
Expanding Storage
The storage added to the data area can be expanded up to a maximum of 5TB based on the initially allocated capacity. Storage can be expanded without interrupting Event Streams, and if configured as a cluster, all nodes are expanded simultaneously.
Notice
- If encryption is set for the existing Block Storage, encryption will also be applied to the additional Disk.
- Disk size modification is only possible if it is 16GB or more larger than the current disk size.
To increase the storage capacity, follow the next procedure.
- Click All services > Data Analytics > Event Streams menu. It moves to the Service Home page of Event Streams.
- Service Home page, click the Event Streams menu. It moves to the Event Streams list page.
- On the Event Streams list page, click the resource for which you want to change the server type. It moves to the Event Streams details page.
- Click the Edit button of the additional Disk you want to add at the bottom of the detailed information. The Disk Edit popup window opens.
- In the Disk Modification popup window, enter the expansion capacity and click the Confirm button.
Add Broker Node
If Event Streams cluster expansion is needed, nodes can be added with the same specifications as the Broker Node in use. The added nodes are added to the existing cluster without server downtime, and the existing data is automatically distributed.
Notice
- You can use up to 10 nodes within the cluster. Please note that additional nodes created will be charged extra.
- The cluster performance may be degraded while adding nodes.
To add a Broker node, follow these steps.
- Click All services > Data Analytics > Event Streams menu. It moves to the Service Home page of Event Streams.
- On the Service Home page, click the Event Streams menu. It moves to the Event Streams list page.
- Event Streams Resource Click the resource you want to recover from the list page of Event Streams Resources. It moves to the Event Streams Details page.
- Click the Add Broker Node button. It moves to the Add Broker Node page.
- Required Information Input area, enter the corresponding information, and then click the Complete button.
| Classification | Necessity | Detailed Description |
|---|---|---|
| Server Name | Required | Server name where Broker is installed
|
| Cluster Name | Required | Cluster Name
|
| Additional Node count | Required | Number of Nodes to add
|
| Service Type > Server Type | Required | The type of server where the Broker will be installed
|
| Service Type > Planned Compute | Selection | Current status of resources with Planned Compute set
|
| Service Type > Block Storage | Required | Block Storage settings to be used for Broker nodes
|
| Network | Required | The network where servers are installed
|
Fig. Event Streams Broker Node Additional Items
Cancel Event Streams
You can cancel unused Event Streams to reduce operating costs. However, when canceling the service, the operating service may be stopped immediately, so you should consider the impact of stopping the service sufficiently before proceeding with the cancellation work.
To cancel Event Streams, follow these procedures.
- Click All services > Data Analytics > Event Streams menu. It moves to the Service Home page of Event Streams.
- Service Home page, click the Event Streams menu. It moves to the Event Streams list page.
- Event Streams list page, select the resource to be canceled and click the Service Cancellation button.
- Once the cancellation is complete, check if the resource has been cancelled on the Event Streams listing page.
1.3 - API Reference
API Reference
1.4 - CLI Reference
CLI Reference
1.5 - Release Note
Event Streams
2025.07.01
FEATURE
Terraform and Disk Type Addition- It provides Terraform.
- HDD, HDD_KMS disk types are also provided.
2025.02.27
NEW
Event Streams Service Official Version Release- An Event Streams service that easily creates and manages Apache Kafka clusters in a web environment has been released.
2 - Search Engine
2.1 - Overview
Service Overview
Search Engine provides automated creation and configuration of the distributed search and analytics engines Elasticsearch and OpenSearch through a web-based console. Users can select a server type that fits the system configuration to set up a cluster, and it supports the data analysis and visualization tools Kibana and the OpenSearch dashboard.
Notice
- Search Engine provides Elasticsearch Enterprise version and OpenSearch version.
- Elasticsearch Enterprise’s software license uses a user-owned license (BYOL, Bring Your Own License), and the software license policy in cloud environments must follow the supplier’s policy.
Search Engine Cluster consists of multiple master nodes and data nodes. Data nodes can be installed from a minimum of 1 up to a maximum of 10, and are usually installed with three or more. If a separate master node is not installed, the data node also performs the role of the master node, and up to 10 can be installed. When a separate master node is installed, data nodes can be up to 50.
Provided Features
Search Engine provides the following functions.
- Auto Provisioning (Auto Provisioning): You can configure and set up Elasticsearch and OpenSearch clusters via the UI.
- Operation Control Management: Provides a function to control the status of running servers. It allows restarting to apply configuration values, in addition to starting and stopping the cluster.
- Backup and Recovery: Backup is possible using the built-in backup function, and recovery is possible to the point in time of the backup file.
- Data Node Addition: If cluster expansion is needed, you can add nodes with the same specifications as the data nodes in use. Up to 10 nodes can be added within the cluster.
- Visualization tool support: Provides data analysis and visualization tools, and supports Elasticsearch Kibana or OpenSearch dashboards.
- Monitoring: CPU, Memory, cluster performance monitoring information can be checked through the Cloud Monitoring service.
Components
Search Engine provides pre-validated engine versions and various server types according to the open source support policy. Users can select and use them according to the scale of the service they want to configure.
Engine Version
Search Engine the supported engine versions are as follows.
Technical support can be used until the supplier’s EoTS (End of Technical Service) date, and the EOS date when new creation is stopped is set to six months before the EoTS date.
According to the supplier’s policy, the EOS and EoTS dates may change, so please refer to the supplier’s license management policy page for details.
Notice
Search Engine’s next version is scheduled to be provided after December 18, 2025. The actual service provision schedule may change.
- ElasticSearch Enterprise 8.19.0 version
- OpenSearch 2.19.3 version
- OpenSearch 3.2.0 version
| Provided Version | EoS Date | EoTS Date |
|---|---|---|
| 8.15.0 | TBD | TBD |
Table. Search Engine's Elasticsearch engine version
- OpenSearch: https://opensearch.org/releases/
| Provided Version | EoS Date | EoTS Date |
|---|---|---|
| 2.17.1 | TBD | TBD |
Table. Search Engine's OpenSearch engine version
Server Type
The server types supported by Search Engine are as follows.
For detailed information about the server types provided by Search Engine, please refer to Search Engine Server Type.
Standard se1v2m4
| Category | Example | Detailed Description |
|---|---|---|
| Server Type | Standard | Provided server type
|
| Server specifications | se1 | Provided server specifications
|
| Server specifications | v2 | vCore count
|
| Server specifications | m4 | Memory capacity
|
Table. Search Engine server type components
Preliminary Service
This is a list of services that must be pre-configured before creating the service. Please refer to the guide provided for each service for details and prepare in advance.
| Service Category | Service | Detailed Description |
|---|---|---|
| Networking | VPC | A service that provides an independent virtual network in a cloud environment |
Table. Search Engine Preceding Service
2.1.1 - Server Type
Search Engine server type
Search Engine provides a server type composed of various combinations such as CPU, Memory, Network Bandwidth, etc. When creating a Search Engine, Elastic Search is installed according to the server type selected to match the purpose of use.
The server types supported by the Search Engine are as follows.
Standard ses1v2m4
Classification | Example | Detailed Description |
|---|---|---|
| Server Type | Standard | Provided server type distinction
|
| Server Specification | db1 | Classification of provided server type and generation
|
| Server Specification | v2 | Number of vCores
|
| Server Specification | m4 | Memory Capacity
|
Table. Search Engine server type format
ses1 server type
The ses1 server type of Search Engine is provided with standard specifications (vCPU, Memory) and is suitable for various database workloads.
- Up to 3.3Ghz Intel 3rd generation (Ice Lake) Xeon Gold 6342 Processor
- Supports up to 16 vCPUs and 256 GB of memory
- Up to 12.5 Gbps networking speed
| Classification | Server Type | vCPU | Memory | Network Bandwidth |
|---|---|---|---|---|
| Standard | ses1v1m2 | 1 vCore | 2 GB | Up to 10 Gbps |
| Standard | ses1v2m8 | 2 vCore | 8 GB | Up to 10 Gbps |
| Standard | ses1v2m16 | 2 vCore | 16 GB | up to 10 Gbps |
| Standard | ses1v2m24 | 2 vCore | 24 GB | Up to 10 Gbps |
| Standard | ses1v2m32 | 2 vCore | 32 GB | Up to 10 Gbps |
| Standard | ses1v4m8 | 4 vCore | 8 GB | Up to 10 Gbps |
| Standard | ses1v4m16 | 4 vCore | 16 GB | Up to 10 Gbps |
| Standard | ses1v4m32 | 4 vCore | 32 GB | Up to 10 Gbps |
| Standard | ses1v4m48 | 4 vCore | 48 GB | Up to 10 Gbps |
| Standard | ses1v4m64 | 4 vCore | 64 GB | up to 10 Gbps |
| Standard | ses1v6m12 | 6 vCore | 12 GB | Up to 10 Gbps |
| Standard | ses1v6m24 | 6 vCore | 24 GB | Up to 10 Gbps |
| Standard | ses1v6m48 | 6 vCore | 48 GB | Up to 10 Gbps |
| Standard | ses1v6m72 | 6 vCore | 72 GB | Up to 10 Gbps |
| Standard | ses1v6m96 | 6 vCore | 96 GB | Up to 10 Gbps |
| Standard | ses1v8m16 | 8 vCore | 16 GB | Up to 10 Gbps |
| Standard | ses1v8m32 | 8 vCore | 32 GB | Up to 10 Gbps |
| Standard | ses1v8m64 | 8 vCore | 64 GB | Up to 10 Gbps |
| Standard | ses1v8m96 | 8 vCore | 96 GB | Up to 10 Gbps |
| Standard | ses1v8m128 | 8 vCore | 128 GB | Up to 10 Gbps |
| Standard | ses1v10m20 | 10 vCore | 20 GB | Up to 10 Gbps |
| Standard | ses1v10m40 | 10 vCore | 40 GB | Up to 10 Gbps |
| Standard | ses1v10m80 | 10 vCore | 80 GB | up to 10 Gbps |
| Standard | ses1v10m120 | 10 vCore | 120 GB | Up to 10 Gbps |
| Standard | ses1v10m160 | 10 vCore | 160 GB | up to 10 Gbps |
| Standard | ses1v12m24 | 12 vCore | 24 GB | Up to 12.5 Gbps |
| Standard | ses1v12m48 | 12 vCore | 48 GB | Up to 12.5 Gbps |
| Standard | ses1v12m96 | 12 vCore | 96 GB | up to 12.5 Gbps |
| Standard | ses1v12m144 | 12 vCore | 144 GB | Up to 12.5 Gbps |
| Standard | ses1v12m192 | 12 vCore | 192 GB | up to 12.5 Gbps |
| Standard | ses1v14m28 | 14 vCore | 28 GB | Up to 12.5 Gbps |
| Standard | ses1v14m56 | 14 vCore | 56 GB | Up to 12.5 Gbps |
| Standard | ses1v14m112 | 14 vCore | 112 GB | Up to 12.5 Gbps |
| Standard | ses1v14m168 | 14 vCore | 168 GB | up to 12.5 Gbps |
| Standard | ses1v14m224 | 14 vCore | 224 GB | Up to 12.5 Gbps |
| Standard | ses1v16m32 | 16 vCore | 32 GB | Up to 12.5 Gbps |
| Standard | ses1v16m64 | 16 vCore | 64 GB | up to 12.5 Gbps |
| Standard | ses1v16m128 | 16 vCore | 128 GB | up to 12.5 Gbps |
| Standard | ses1v16m192 | 16 vCore | 192 GB | up to 12.5 Gbps |
| Standard | ses1v16m256 | 16 vCore | 256 GB | up to 12.5 Gbps |
Table. Search Engine server type specification - ses1 server type
ses2 server type
The ses1 server type of Search Engine is provided with standard specifications (vCPU, Memory) and is suitable for various database workloads.
- Up to 3.2GHz Intel 4th generation (Sapphire Rapids) Xeon Gold 6448H Processor
- Supports up to 16 vCPUs and 256 GB of memory
- Up to 12.5 Gbps networking speed
| Classification | Server Type | CPU vCore | Memory | Network Bandwidth(Gbps) |
|---|---|---|---|---|
| Standard | ses2v2m4 | 2 vCore | 4 GB | Up to 10 Gbps |
| Standard | ses2v2m8 | 2 vCore | 8 GB | Up to 10 Gbps |
| Standard | ses2v2m16 | 2 vCore | 16 GB | Up to 10 Gbps |
| Standard | ses2v2m24 | 2 vCore | 24 GB | Up to 10 Gbps |
| Standard | ses2v2m32 | 2 vCore | 32 GB | Up to 10 Gbps |
| Standard | ses2v4m8 | 4 vCore | 8 GB | Up to 10 Gbps |
| Standard | ses2v4m16 | 4 vCore | 16 GB | Up to 10 Gbps |
| Standard | ses2v4m32 | 4 vCore | 32 GB | Up to 10 Gbps |
| Standard | ses2v4m48 | 4 vCore | 48 GB | Up to 10 Gbps |
| Standard | ses2v4m64 | 4 vCore | 64 GB | Up to 10 Gbps |
| Standard | ses2v6m12 | 6 vCore | 12 GB | Up to 10 Gbps |
| Standard | ses2v6m24 | 6 vCore | 24 GB | Up to 10 Gbps |
| Standard | ses2v6m48 | 6 vCore | 48 GB | Up to 10 Gbps |
| Standard | ses2v6m72 | 6 vCore | 72 GB | Up to 10 Gbps |
| Standard | ses2v6m96 | 6 vCore | 96 GB | Up to 10 Gbps |
| Standard | ses2v8m16 | 8 vCore | 16 GB | Up to 10 Gbps |
| Standard | ses2v8m32 | 8 vCore | 32 GB | Up to 10 Gbps |
| Standard | ses2v8m64 | 8 vCore | 64 GB | up to 10 Gbps |
| Standard | ses2v8m96 | 8 vCore | 96 GB | Up to 10 Gbps |
| Standard | ses2v8m128 | 8 vCore | 128 GB | Up to 10 Gbps |
| Standard | ses2v10m20 | 10 vCore | 20 GB | Up to 10 Gbps |
| Standard | ses2v10m40 | 10 vCore | 40 GB | Up to 10 Gbps |
| Standard | ses2v10m80 | 10 vCore | 80 GB | Up to 10 Gbps |
| Standard | ses2v10m120 | 10 vCore | 120 GB | Up to 10 Gbps |
| Standard | ses2v10m160 | 10 vCore | 160 GB | Up to 10 Gbps |
| Standard | ses2v12m24 | 12 vCore | 24 GB | Up to 12.5 Gbps |
| Standard | ses2v12m48 | 12 vCore | 48 GB | Up to 12.5 Gbps |
| Standard | ses2v12m96 | 12 vCore | 96 GB | Up to 12.5 Gbps |
| Standard | ses2v12m144 | 12 vCore | 144 GB | Up to 12.5 Gbps |
| Standard | ses2v12m192 | 12 vCore | 192 GB | Up to 12.5 Gbps |
| Standard | ses2v14m28 | 14 vCore | 28 GB | Up to 12.5 Gbps |
| Standard | ses2v14m56 | 14 vCore | 56 GB | Up to 12.5 Gbps |
| Standard | ses2v14m112 | 14 vCore | 112 GB | Up to 12.5 Gbps |
| Standard | ses2v14m168 | 14 vCore | 168 GB | Up to 12.5 Gbps |
| Standard | ses2v14m224 | 14 vCore | 224 GB | up to 12.5 Gbps |
| Standard | ses2v16m32 | 16 vCore | 32 GB | Up to 12.5 Gbps |
| Standard | ses2v16m64 | 16 vCore | 64 GB | up to 12.5 Gbps |
| Standard | ses2v16m128 | 16 vCore | 128 GB | Up to 12.5 Gbps |
| Standard | ses2v16m192 | 16 vCore | 192 GB | Up to 12.5 Gbps |
| Standard | ses2v16m256 | 16 vCore | 256 GB | up to 12.5 Gbps |
Table. Search Engine server type specification - ses2 server type
SEH2 server type
The seh2 server type of Search Engine is provided with large-capacity server specifications and is suitable for database workloads for large-scale data processing.
- Up to 3.2GHz Intel 4th generation (Sapphire Rapids) Xeon Gold 6448H Processor
- Supports up to 72 vCPUs and 288 GB of memory
- Up to 25Gbps networking speed
| Classification | Server Type | vCPU | Memory | Network Bandwidth |
|---|---|---|---|---|
| High Capacity | seh2v24m48 | 24 vCore | 48 GB | Up to 25 Gbps |
| High Capacity | seh2v24m96 | 24 vCore | 96 GB | Up to 25 Gbps |
| High Capacity | seh2v24m192 | 24 vCore | 192 GB | Up to 25 Gbps |
| High Capacity | seh2v24m288 | 24 vCore | 288 GB | Up to 25 Gbps |
| High Capacity | seh2v32m64 | 32 vCore | 64 GB | Up to 25 Gbps |
| High Capacity | seh2v32m128 | 32 vCore | 128 GB | Up to 25 Gbps |
| High Capacity | seh2v32m256 | 32 vCore | 256 GB | Up to 25 Gbps |
| High Capacity | seh2v48m96 | 48 vCore | 96 GB | Up to 25 Gbps |
| High Capacity | seh2v48m192 | 48 vCore | 192 GB | Up to 25 Gbps |
| High Capacity | seh2v64m128 | 64 vCore | 128 GB | Up to 25 Gbps |
| High Capacity | seh2v64m256 | 64 vCore | 256 GB | Up to 25 Gbps |
| High Capacity | seh2v72m144 | 72 vCore | 144 GB | Up to 25 Gbps |
| High Capacity | seh2v72m288 | 72 vCore | 288 GB | Up to 25 Gbps |
Table. Search Engine server type specification - seh2 server type
2.1.2 - Monitoring Metrics
Search Engine Monitoring Metrics
The following table shows the performance monitoring metrics of Event Streams that can be checked through Cloud Monitoring. For detailed Cloud Monitoring usage, please refer to the Cloud Monitoring guide.
For server monitoring metrics of the Search Engine, please refer to the Virtual Server Monitoring Metrics guide.
| Performance Item | Detailed Description | Unit |
|---|---|---|
| Disk Usage | datadir usage | MB |
| Documents [Deleted] | total number of deleted documents | cnt |
| Documents [Existing] | total number of existing documents | cnt |
| Filesystem Bytes [Available] | available filesystem | bytes |
| Filesystem Bytes [Free] | free filesystem | bytes |
| Filesystem Bytes [Total] | total filesystem | bytes |
| Instance Status [PID] | Elasticsearch process PID | PID |
| JVM Heap Used [Init] | JVM heap used init (bytes) | bytes |
| JVM Heap Used [MAX] | JVM heap used max (bytes) | bytes |
| JVM Non Heap Used [Init] | JVM non-heap used init (bytes) | bytes |
| JVM Non Heap Used [MAX] | JVM non-heap used max (bytes) | bytes |
| Kibana Connections | Kibana connections | cnt |
| Kibana Memory Heap Allocated [Limit] | maximum allocated Node.js process heap size (bytes) | bytes |
| Kibana Memory Heap Allocated [Total] | total allocated Node.js process heap size (bytes) | bytes |
| Kibana Memory Heap Used | used Node.js process heap size (bytes) | bytes |
| Kibana Process Uptime | Kibana process uptime | ms |
| Kibana Requests [Disconnected] | request count metric | cnt |
| Kibana Requests [Total] | request count metric | cnt |
| Kibana Response Time [Avg] | response time metric | ms |
| Kibana Response Time [MAX] | response time metric | ms |
| Kibana Status [PID] | Kibana process PID | PID |
| License Expiry Date [ms] | license expiry date [milliseconds] | ms |
| License Status | license status | status |
| License Type | license type | type |
| Queue Time | queue time | ms |
| Segments | total number of segments | cnt |
| Segments Bytes | total segment size (bytes) | bytes |
| Shards | cluster shard count | cnt |
| Store Bytes | total store size (bytes) | bytes |
Table. Search Engine Monitoring Metrics
2.2 - How-to guides
The user can enter the necessary information of the Search Engine through the Samsung Cloud Platform Console and create the service by selecting detailed options.
Creating Search Engine
You can create and use the Search Engine service in the Samsung Cloud Platform Console.
Notice
Please configure the Subnet type of VPC to General before creating the service.
- If the Subnet type is Local, the creation of the corresponding Database service is not possible.
To create a Search Engine, follow the next procedure.
Notice
The following describes the case when you choose the Elasticsearch Enterprise image.
All Services > Database > Search Engine menu, click. It moves to the Service Home page of Search Engine.
On the Service Home page, click the Create Search Engine button. It moves to the Create Search Engine page.
Search Engine Creation page where you enter the information needed to create a service and select detailed options.
Image and Version Selection area, please select the necessary information.
Classification NecessityDetailed Description Image Required Select the type of image provided - Elasticsearch Enterprise, OpenSearch
Image Version Required Select the version of the selected image - Provide a list of versions of the server image provided
Fig. Search Engine image and version selection itemsEnter Service Information area, please enter or select the necessary information.
Classification NecessityDetailed Description Server Name Prefix Required The name of the server where Elasticsearch will be installed - Starts with a lowercase letter, using lowercase letters, numbers, and special characters (
-) to input 3 ~ 13 characters
- A postfix such as 001, 002 is attached based on the server name to create the actual server name
Cluster Name Required Name of the cluster that the servers are configured in - Enter in English, 3-20 characters
- The cluster is a unit that bundles multiple servers
MasterNode separate installation > use essential Whether to install the Master node separately - Use is selected, the Master node is installed separately.
- If the Master node is not installed separately, the data node also performs the master role.
MasterNode separate installation > MasterNode count required Number of Master nodes - The master node is installed with a fixed 3 units for failover recovery.
MasterNode separate installation > Server type Required Master node server type - Standard: Standard specification commonly used
- High Capacity: High-capacity server with 24vCore or more
- For more information on the server type provided by Search Engine, refer to Search Engine server type
MasterNode separate installation > Planned Compute selection Current status of resources with Planned Compute set - In use: Number of resources in use among those with Planned Compute set
- Settings: Number of resources with Planned Compute set
- Coverage preview: Amount applied by resource-based Planned Compute
- Apply for Planned Compute service: Move to the Planned Compute service application page
- For more information, see Apply for Planned Compute
MasterNode separate installation > Block Storage required Master node block storage type - Basic OS: area where the engine is installed
- DATA: data file storage area
- After selecting the storage type, enter the capacity. (For more information on each block storage type, see Creating Block Storage)
- SSD: high-performance general volume
- HDD: general volume
- SSD_KMS/HDD_KMS: additional encrypted volume using KMS (Key Management System) encryption key
- Capacity can be entered in multiples of 8 in the range of 16 to 5,120
- After selecting the storage type, enter the capacity. (For more information on each block storage type, see Creating Block Storage)
- Add Disk: data storage area
- After selecting Use, enter the Capacity of the storage
- To add storage, click the + button, and to delete, click the x button. Up to 9 can be added.
- Capacity can be entered in multiples of 8 in the range of 16 to 5,120, and up to 9 can be created
Number of Nodes Required Number of Data Nodes - In cases where the Master node is installed separately, 2 or more nodes are required, and in other cases, 1 or more nodes must be selected.
Service Type > Server Type Required Data Node Server Type - Standard: generally used standard specification
- High Capacity: high-capacity server with 24vCore or more
Service Type > Planned Compute Selection Current status of resources with Planned Compute set - In Use: Number of resources with Planned Compute set that are in use
- Settings: Number of resources with Planned Compute set
- Coverage Preview: Amount applied by Planned Compute for each resource
- Apply for Planned Compute Service: Move to the Planned Compute service application page
- For more information, see How to Apply for Planned Compute
Service Type > Block Storage Required Type of Block Storage to be used for data node - Basic OS: Area where the engine is installed
- DATA: Data file storage area
- Please select the storage type and enter the capacity. (For more information on each Block Storage type, refer to Creating Block Storage)
- SSD: High-performance general volume
- HDD: General volume
- SSD_KMS/HDD_KMS: Additional encrypted volume using KMS (Key Management System) encryption key
- Capacity can be entered in multiples of 8 within the range of 16 to 5,120
- Please select the storage type and enter the capacity. (For more information on each Block Storage type, refer to Creating Block Storage)
- Disk Add: Additional storage area for data, backup
- Select Use and enter the Purpose and Capacity of the storage
- To add storage, click the + button, and to delete, click the x button. Up to 9 can be added.
- Capacity can be entered in multiples of 8 within the range of 16 to 5,120, and up to 9 can be created
Kibana > Server Type Required The type of server where Kibana will be installed - Standard: Standard specification commonly used
Kibana > Planned Compute Selection Current status of resources with Planned Compute set - In use: Number of resources with Planned Compute set that are in use
- Settings: Number of resources with Planned Compute set
- Coverage preview: Amount applied by resource-based Planned Compute
- Apply for Planned Compute service: Move to the Planned Compute service application page
- For more information, see How to apply for Planned Compute
Kibana > Block Storage required The type of Block Storage to be used on the server where Kibana will be installed - Basic OS: The area where the engine is installed
Network > Common Settings Required Network settings for servers created by the service - Select if you want to apply the same settings to all servers being installed
- Select pre-created VPC and Subnet
- IP: Only automatic creation is possible
- Public NAT settings are only possible in server-specific settings.
Network > Server Settings Required Network settings for installing servers created by the service - Select to apply different settings for each server being installed
- Select pre-created VPC and Subnet
- IP: Enter the IP for each server
- The Public NAT function is available only when the VPC is connected to the Internet Gateway, and if Use is checked, you can select from the reserved IP in the VPC product’s Public IP. For more information, see Creating Public IP
IP Access Control Select Set service access policy - Set access policy for IPs entered on the page, so you don’t need to set Security Group policy separately.
- Enter in IP format (e.g.,
192.168.10.1) or CIDR format (e.g.,192.168.10.0/24,192.168.10.1/32), and click the Add button
- To delete the entered IP, click the x button next to the entered IP
Maintenance period Select Search Engine maintenance period - Use Selecting the day of the week, start time, and duration
- It is recommended to set the maintenance period for stable management of the service. Patch work is performed at the set time and service interruption occurs
- If set to unused, problems that occur due to non-application of patches are not the responsibility of our company.
Table. Search Engine service information input items- Starts with a lowercase letter, using lowercase letters, numbers, and special characters (
Database Configuration Required Information Input area, please enter or select the required information.
Classification NecessityDetailed Description Backup > Use Selection Whether to use node backup - If node backup is selected, select the storage period and backup start time
Backup > Retention Period Select Backup Retention Period - Please select the backup retention period. The file retention period can be set from 7 to 35 days
- Backup files may incur additional charges depending on capacity.
Backup > Backup start time Select Backup start time - Select the backup start time
- The minutes when the backup is performed are set randomly, and the backup end time cannot be set
Cluster Port number Required Elasticsearch connection port number 1,024 ~ 65,535can be entered as one of them, and Elasticsearch internal port 9300 and Kibana port 5301 are not available
Elastic username required Elasticsearch username - Enter within 2-20 characters using lowercase English letters
- The following usernames cannot be used.
- apm_system, beats_system, elastic, kibana, kibana_system, logstash_system, remote_monitoring_user, scp_kibana_system, scp_manager, maxigent_cl
Elastic password required Elasticsearch connection password - Enter 8-30 characters, including English, numbers, and special characters (excluding
"’</code>)
Elastic password confirmation required Confirm Elasticsearch connection password - Re-enter the Elasticsearch connection password identically
License Key required Elasticsearch License Key - Enter the entire contents of the issued license file (.json)
- If the entered license key is not valid, service creation may not be possible.
- OpenSearch does not require a License Key.
Time Zone Selection Standard Time Zone where the service will be used Fig. Search Engine Database Configuration Required Information Input ItemsEnter Additional Information Enter or select the required information in the area.
Classification NecessityDetailed Description Tag Select Add Tag - Add Tag button to create and add a tag or add an existing tag
- Up to 50 tags can be added
- Newly added tags will be applied after service creation is complete
Fig. Search Engine service additional information input items
In the Summary panel, review the detailed information and estimated charges, then click the Complete button.
- Once creation is complete, check the created resource on the Resource List page.
Search Engine detailed information check
The Search Engine service can check and modify the entire resource list and detailed information. The Search Engine details page consists of detailed information, tags, and work history tabs.
To check the detailed information of the Search Engine service, follow the next procedure.
- All services > Data Analytics > Search Engine menu, click. It moves to the Service Home page of Search Engine.
- On the Service Home page, click the Search Engine menu. It moves to the Search Engine list page.
- Search Engine list page, click on the resource to check the detailed information. Move to the Search Engine details page.
- Search Engine Details The top of the page displays status information and additional features.
| Classification | Detailed Description |
|---|---|
| Cluster Status | Cluster Status
|
| Cluster Control | Buttons that can change the cluster status
|
| Additional features more | Cluster related management buttons
|
| Service Cancellation | Button to cancel the service |
Fig. Search Engine status information and additional functions
Detailed Information
On the Search Engine List page, you can check the detailed information of the selected resource and modify the information if necessary.
| Classification | Detailed Description |
|---|---|
| Server Information | Server information configured in the corresponding cluster
|
| Service | Service Name |
| Resource Type | Service Name |
| SRN | Unique resource ID in Samsung Cloud Platform
|
| Resource Name | Resource Name
|
| Resource ID | Unique resource ID in the service |
| Creator | Service creator user |
| Creation Time | Time when the service was created |
| Modifier | Service information modified user |
| Modified Time | Time when service information was modified |
| Image/Version | Installed service image and version information |
| Cluster Name | Server cluster name composed of servers |
| Planned Compute | Planned Compute status of set resources
|
| Maintenance Period | Maintenance Period Status
|
| Backup | Backup setting status
|
| Time Zone | Standard time zone where the service will be used |
| License | Elasticsearch license information
|
| Elastic username | Elasticsearch user name |
| Kibana connection information | Kibana connection information |
| Network | Installed network information(VPC, Subnet) |
| IP access control | Service access policy setting
|
| Master | Master node’s server type, default OS, additional Disk information
|
| Data | Broker node’s server type, default OS, additional Disk information
|
| Kibana | Kibana node server type, basic OS information
|
Table. Search Engine detailed information items
Tag
On the Search Engine list page, you can check the tag information of the selected resource, and add, change, or delete it.
| Classification | Detailed Description |
|---|---|
| Tag List | Tag List
|
Fig. Search Engine tags tab items
Work History
You can check the operation history of the resource selected on the Search Engine list page.
| Classification | Detailed Description |
|---|---|
| Work History List | Resource Change History
|
Fig. Search Engine job history tab detailed information items
Search Engine Resource Management
If you need to change the existing setting options of the generated Search Engine resource or manage Parameters, or configure additional Nodes, you can perform the task on the Search Engine details page.
Operating Control
If there are changes to the Search Engine resources in operation, you can start, stop, and restart them.
To control the operation of the Search Engine, follow the next procedure.
- Click on the menu of all services > Data Analytics > Search Engine. It moves to the Service Home page of Search Engine.
- On the Service Home page, click the Search Engine menu. It moves to the Search Engine list page.
- Search Engine list page, click the resource to control the operation. Move to the Search Engine details page.
- Check the Search Engine status and complete the change through the control button below.
- Start: The Search Engine service is installed on the server and the Search Engine service is running.
- Stop: The Search Engine service installed on the server and the Search Engine service will be stopped.
- Restart: Only the Search Engine service will be restarted.
Synchronizing Service Status
You can query the current server status and synchronize it to the Console.
To synchronize the service status of the Search Engine, follow the next procedure.
- Click All Services > Data Analytics > Search Engine menu. It moves to the Service Home page of Search Engine.
- On the Service Home page, click the Search Engine menu. It moves to the Search Engine list page.
- Search Engine list page, click on the resource to check the service status. Move to the Search Engine details page.
- Service Status Synchronization button should be clicked. It takes some time to retrieve, and during retrieval, the cluster changes to Synchronizing status.
- When the query is complete, the status in the server information item is updated, and the cluster changes to Running status.
Changing Server Type
You can change the configured server type.
To change the server type, follow these steps.
Caution
- If the server type is configured as Standard, it cannot be changed to High Capacity. If you want to change to High Capacity, please create a new service.
- Modifying the server type requires a server restart. Please check separately for SW license modifications due to specification changes, as well as SW settings and reflections.
- All services > Data Analytics > Search Engine menu is clicked. It moves to the Service Home page of Search Engine.
- Service Home page, click the Search Engine menu. Move to the Search Engine list page.
- Search Engine list page, click the resource to change the server type. Move to the Search Engine details page.
- Click the Edit button of the Server Type you want to change at the bottom of the detailed information. The Edit Server Type popup window opens.
- In the Server Type Modification popup window, select the server type and click the Confirm button.
Expanding Storage
The storage added to the data area can be expanded up to a maximum of 5TB based on the initially allocated capacity. Storage can be expanded without stopping the Search Engine, and if configured in a cluster, all nodes are expanded simultaneously.
Notice
- If encryption is set for the existing Block Storage, encryption will also be applied to the additional Disk. The disk size modification is only possible if it is 16GB or more larger than the current disk size.
To increase the storage capacity, follow the procedure below.
- All services > Data Analytics > Search Engine menu is clicked. It moves to the Service Home page of Search Engine.
- On the Service Home page, click the Search Engine menu. It moves to the Search Engine list page.
- Search Engine list page, click the resource to change the server type. It moves to the Search Engine details page.
- Click the Modify button of the additional Disk you want to add at the bottom of the detailed information. The Disk Modification popup window opens.
- In the Disk Modification popup window, enter the expansion capacity and click the Confirm button.
Adding Storage
If you need more than 5TB of data storage space, you can add storage.
Notice
- If encryption is set for the existing Block Storage, encryption will also be applied to the additional Disk.
To add storage capacity, follow these steps.
- All services > Data Analytics > Search Engine menu is clicked. It moves to the Service Home page of Search Engine.
- On the Service Home page, click the Search Engine menu. It moves to the Search Engine list page.
- Search Engine list page, click the resource to add storage. Move to the Search Engine details page.
- Click the Add Disk button at the bottom of the detailed information. The Add Disk popup window opens.
- In the Add Disk popup window, enter the purpose and capacity, then click the OK button.
Search Engine Backup
Through the backup settings function, users can set the data retention period and start cycle, and perform backup history inquiry and deletion through the backup history function.
Setting up backup
While creating the Search Engine, the procedure for setting up the backup is to refer to the Search Engine creation guide, and to modify the backup settings of the created resource, follow the following procedure.
Caution
- If backup is set, backup will be performed at the specified time after the set time, and additional fees will be incurred depending on the backup capacity.
- If the backup setting is changed to unset, the backup operation will be stopped immediately, and the saved backup data will be deleted and can no longer be used.
- All Services > Data Analytics > Search Engine menu is clicked. It moves to the Service Home page of Search Engine.
- On the Service Home page, click the Search Engine menu. It moves to the Search Engine list page.
- Search Engine list page, click the resource to set the backup. Move to the Search Engine details page.
- Click the Edit button of the backup item. The Backup Edit popup window opens.
- If you set up a backup, click Use in the Backup Modification popup window, select the storage period, backup start time, and Archive backup cycle, and then click the Confirm button.
- If you want to stop the backup settings, uncheck Use in the Backup Modification popup window and click the OK button.
Check Backup History
To view the backup history, follow these steps.
- All Services > Data Analytics > Search Engine menu is clicked. It moves to the Service Home page of Search Engine.
- On the Service Home page, click the Search Engine menu. It moves to the Search Engine list page.
- Search Engine list page, click the resource to check the backup history. Move to the Search Engine details page.
- Click the Backup History button. The Backup History popup window opens.
- Backup History popup window where you can check the backup status, version, backup start time, backup completion time, and capacity.
Deleting backup files
To delete the backup history, follow these steps.
Caution
Please confirm that the data is unnecessary before deleting it, as deleted backup files cannot be restored.
- Click on the menu for all services > Data Analytics > Search Engine. It moves to the Service Home page of the Search Engine.
- On the Service Home page, click the Search Engine menu. It moves to the Search Engine list page.
- Search Engine list page, click the resource to check the backup history. Move to the Search Engine details page.
- Click the Backup History button. The Backup History popup window opens.
- In the backup history popup window, check the file you want to delete and click the Delete button.
Search Engine recovery
In the event of a failure or data loss that requires restoration from a backup file, cluster recovery allows recovery based on a specific point in time.
Caution
To perform recovery, a data type of Disk capacity and at least the same capacity are required. If the disk capacity is insufficient, recovery may fail.
Notice
Cluster recovery is restored with the same configuration as the original. For example, if it is configured with 3 Master nodes and 2 Data nodes, it will be restored with the same configuration.
To restore the Search Engine, follow the following procedure.
- All Servives > Data Analytics > Search Engine menu should be clicked. It moves to the Service Home page of Search Engine.
- On the Service Home page, click the Search Engine menu. It moves to the Search Engine list page.
- Search Engine Resource Click on the resource you want to restore from the list page. It moves to the Search Engine Details page.
- Click the Cluster Recovery button. It moves to the Cluster Recovery page.
- Enter the corresponding information in the Cluster Recovery Configuration area, and then click the Complete button.
| Classification | Necessity | Detailed Description |
|---|---|---|
| Recovery Point | Required | Set the point in time that the user wants to recover
|
| Server Name Prefix | Required | Recovery Server Name
|
| Cluster Name | Required | Recovery Server Cluster Name
|
| Number of Nodes | Required | Number of Data Nodes
|
| Service Type > Server Type | Required | Data Node Server Type
|
| Service Type > Planned Compute | Selection | Current status of resources with Planned Compute set
|
| Service Type > Block Storage | Required | Block Storage to be used for data node
|
| MasterNode separate installation > use | essential | Whether to install Master node separately
|
| MasterNode separate installation > Number of MasterNodes | required | Number of Master nodes |
| MasterNode separate installation > Server type | Required | Master node server type
|
| MasterNode separate installation > Planned Compute | selection | Planned Compute setting resource status
|
| MasterNode separate installation > Block Storage | required | Block Storage to be used for Master Node
|
| Kibana > Server Type | Required | Kibana node server type
|
| Kibana > Planned Compute | Selection | Current status of resources with Planned Compute set
|
| Kibana > Block Storage | Required | Block Storage to be used for Kibana nodes
|
| Cluster Port number | Required | Elasticsearch connection port number
|
| Licnese Key | Essential | Elasticsearch License Key
|
| IP Access Control | Select | Set service access policy
|
| Maintenance period | Select | Maintenance period
|
Fig. Search Engine Recovery Configuration Items
Add Node
If Search Engine cluster expansion is needed, you can add nodes with the same specifications as the data node in use.
Notice
- You can use up to 10 nodes within the cluster. Please note that additional nodes created will be charged extra.
- The cluster performance may be degraded while adding nodes.
To add a node, follow these steps.
- All Services > Data Analytics > Search Engine menu should be clicked. It moves to the Service Home page of Search Engine.
- On the Service Home page, click the Search Engine menu. It moves to the Search Engine list page.
- Search Engines Resource menu should be clicked. It moves to the Search Engine Detail page.
- Click the Add Broker Node button. It moves to the Add Broker Node page.
- Required Information Input area, enter the corresponding information, and then click the Complete button.
| Division | Mandatory | Detailed Description |
|---|---|---|
| Server Name Prefix | Required | Data Node Server Name
|
| Cluster Name | Required | Cluster Name
|
| Additional Node count | Required | Number of additional Nodes to add
|
| Service Type > Server Type | Required | Data Node Server Type
|
| Service Type > Planned Compute | Selection | Current status of resources with Planned Compute set
|
| Service Type > Block Storage | Required | Block Storage settings to be used for data nodes
|
| Network | Required | The network where servers are installed
|
Fig. Search Engine Node Additional Items
Search Engine cancellation
You can cancel the unused Search Engine to reduce operating costs. However, if you cancel the service, the operating service may be stopped immediately, so you should consider the impact of stopping the service sufficiently before proceeding with the cancellation work.
To cancel the Search Engine, follow the next procedure.
- All services > Data Analytics > Search Engine menu is clicked. It moves to the Service Home page of Search Engine.
- On the Service Home page, click the Search Engine menu. It moves to the Search Engine list page.
- Search Engine list page, select the resource to be canceled and click the Service Cancellation button.
- Once the cancellation is complete, please check if the resource has been cancelled on the Search Engine list page.
2.3 - API Reference
API Reference
2.4 - CLI Reference
CLI Reference
2.5 - Release Note
Search Engine
2025.07.01
FEATURE
New feature, Terraform and disk type added- OpenSearch 2.17.1 is newly provided.
- It provides Terraform.
- HDD, HDD_KMS disk types are also provided.
2025.02.27
NEW
Search Engine Service Official Version Release- A Search Engine service that can easily create and manage ElasticSearch Enterprise in a web environment has been released.
3 - Vertica(DBaaS)
3.1 - Overview
Service Overview
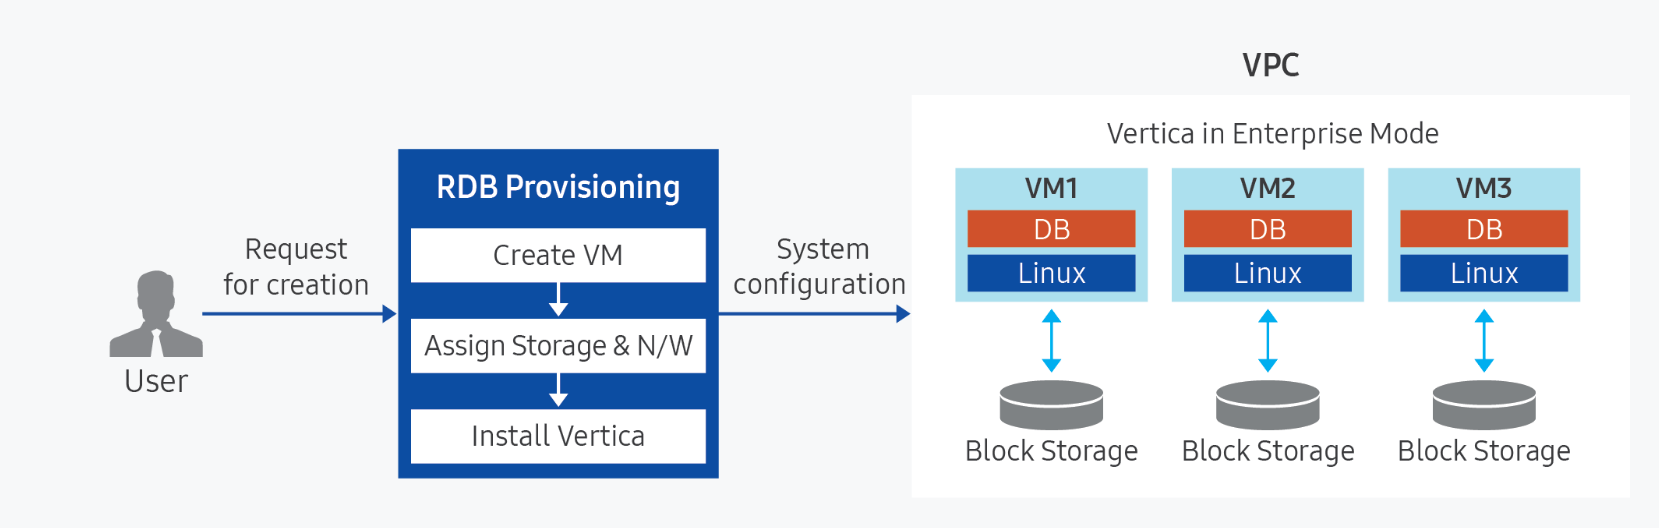
Vertica(DBaaS) is a high-availability enterprise database based on Data Warehouse for large-scale data analysis/processing. It is a data analysis platform that, through a single engine, can perform basic analyses such as queries on data coming from various sources without moving them, as well as AI analyses like machine learning. In Samsung Cloud Platform, DB management functions such as high‑availability configuration, backup/recovery, patching, parameter management, and monitoring are added to ensure stable management of single instances or critical data, enabling automation of tasks throughout the database lifecycle. Additionally, to prepare for issues with DB servers or data, it provides an automatic backup function at user‑specified times, supporting data recovery at the desired point in time.
Service Architecture Diagram
Provided Features
Vertica (DBaaS) provides the following features.
- Auto Provisioning: Automatically installs the DB of the standard version of Samsung Cloud Platform based on Virtual Servers of various specifications.
- Cluster configuration: Provides its own high-availability architecture in a Masterless form.
- Operation Control Management: Provides a function to control the status of running servers. Servers can be started and stopped, and can be restarted if there is a problem with the DB or to apply configuration values.
- Backup and Recovery: Provides a data backup function based on its own backup commands. The backup retention period and backup start time can be set by the user, and additional charges apply based on backup size. It also provides a recovery function for backed-up data; when the user performs a recovery, a separate DB is created and recovery proceeds to the point selected by the user (backup save point, user-specified point). When recovering a Database, you can choose to install the Management Console for use.
- Service status query: You can view the final status of the current DB service.
- Monitoring: CPU, memory, DB performance monitoring information can be checked through the Cloud Monitoring service.
- High-performance processing of large-scale data: Guarantees stable performance in environments with massive parallel processing (MPP, Massively Parallel Processing) and SQL query Mixed Workload. Vertica processes queries through distributed processing and has a structure that allows queries to be started from any node, so there is no Single Point of Failure where queries would not be executed in case of a specific node failure.
Components
Vertica(DBaaS) provides pre-validated engine versions and various server types. Users can select and use them according to the scale of the service they want to configure.
Engine Version
The engine versions supported by Vertica(DBaaS) are as follows.
Technical support can be used until the supplier’s EoTS (End of Technical Service) date, and the EOS date when new creation is stopped is set to six months before the EoTS date.
According to the supplier’s policy, the EOS and EoTS dates may change, so please refer to the supplier’s license management policy page for details.
| Provided version | EOS date(Samsung Cloud Platform new creation stop date) | EoTS date(supplier technical support end date) |
|---|---|---|
| 24.2.0-2 | 2026-09 (planned) | 2027-04-30 |
Table. Vertica (DBaaS) Service Provision Engine Version
Server Type
The server types supported by Vertica (DBaaS) are as follows.
For detailed information about the server types provided by Vertica (DBaaS), please refer to Vertica server types.
| Category | Example | Detailed Description |
|---|---|---|
| Server Type | Standard | Provided Server Types
|
| Server specifications | Db1 | Provided server specifications
|
| Server specifications | V2 | vCore count
|
| Server specifications | M4 | Memory capacity
|
Table. Vertica (DBaaS) server type components
Preliminary Service
This is a list of services that must be pre-configured before creating the service. Please refer to the guide provided for each service for details and prepare in advance.
| Service Category | Service | Detailed Description |
|---|---|---|
| Networking | VPC | A service that provides an independent virtual network in a cloud environment |
Table. Vertica (DBaaS) Preliminary Service
3.1.1 - Server Type
Vertica(DBaaS) server type
Vertica(DBaaS) provides a server type composed of various combinations such as CPU, Memory, Network Bandwidth, etc. When creating Vertica(DBaaS), the Database Engine is installed according to the server type selected for the purpose of use.
The server types supported by Vertica(DBaaS) are as follows.
Standard db1v2m4
Classification | Example | Detailed Description |
|---|---|---|
| Server Type | Standard | Provided server type classification
|
| Server Specification | db1 | Classification of provided server type and generation
|
| Server Specification | v2 | Number of vCores
|
| Server Specification | m4 | Memory Capacity
|
Table. Vertica(DBaaS) server type format
db1 server type
The db1 server type of Vertica(DBaaS) is provided with standard specifications (vCPU, Memory) and is suitable for various database workloads.
- Up to 3.3Ghz Intel 3rd generation (Ice Lake) Xeon Gold 6342 Processor
- Supports up to 16 vCPUs and 256 GB of memory
- Up to 12.5 Gbps networking speed
| Division | Server Type | vCPU | Memory | Network Bandwidth |
|---|---|---|---|---|
| Standard | db1v1m2 | 1 vCore | 2 GB | Up to 10 Gbps |
| Standard | db1v2m4 | 2 vCore | 4 GB | Up to 10 Gbps |
| Standard | db1v2m8 | 2 vCore | 8 GB | Up to 10 Gbps |
| Standard | db1v2m16 | 2 vCore | 16 GB | Up to 10 Gbps |
| Standard | db1v2m24 | 2 vCore | 24 GB | Up to 10 Gbps |
| Standard | db1v2m32 | 2 vCore | 32 GB | Up to 10 Gbps |
| Standard | db1v4m8 | 4 vCore | 8 GB | Up to 10 Gbps |
| Standard | db1v4m16 | 4 vCore | 16 GB | Up to 10 Gbps |
| Standard | db1v4m32 | 4 vCore | 32 GB | Up to 10 Gbps |
| Standard | db1v4m48 | 4 vCore | 48 GB | Up to 10 Gbps |
| Standard | db1v4m64 | 4 vCore | 64 GB | Up to 10 Gbps |
| Standard | db1v6m12 | 6 vCore | 12 GB | Up to 10 Gbps |
| Standard | db1v6m24 | 6 vCore | 24 GB | Up to 10 Gbps |
| Standard | db1v6m48 | 6 vCore | 48 GB | Up to 10 Gbps |
| Standard | db1v6m72 | 6 vCore | 72 GB | Up to 10 Gbps |
| Standard | db1v6m96 | 6 vCore | 96 GB | Up to 10 Gbps |
| Standard | db1v8m16 | 8 vCore | 16 GB | Up to 10 Gbps |
| Standard | db1v8m32 | 8 vCore | 32 GB | Up to 10 Gbps |
| Standard | db1v8m64 | 8 vCore | 64 GB | Up to 10 Gbps |
| Standard | db1v8m96 | 8 vCore | 96 GB | Up to 10 Gbps |
| Standard | db1v8m128 | 8 vCore | 128 GB | Up to 10 Gbps |
| Standard | db1v10m20 | 10 vCore | 20 GB | Up to 10 Gbps |
| Standard | db1v10m40 | 10 vCore | 40 GB | Up to 10 Gbps |
| Standard | db1v10m80 | 10 vCore | 80 GB | Up to 10 Gbps |
| Standard | db1v10m120 | 10 vCore | 120 GB | Up to 10 Gbps |
| Standard | db1v10m160 | 10 vCore | 160 GB | Up to 10 Gbps |
| Standard | db1v12m24 | 12 vCore | 24 GB | Up to 12.5 Gbps |
| Standard | db1v12m48 | 12 vCore | 48 GB | Up to 12.5 Gbps |
| Standard | db1v12m96 | 12 vCore | 96 GB | Up to 12.5 Gbps |
| Standard | db1v12m144 | 12 vCore | 144 GB | Up to 12.5 Gbps |
| Standard | db1v12m192 | 12 vCore | 192 GB | Up to 12.5 Gbps |
| Standard | db1v14m28 | 14 vCore | 28 GB | Up to 12.5 Gbps |
| Standard | db1v14m56 | 14 vCore | 56 GB | Up to 12.5 Gbps |
| Standard | db1v14m112 | 14 vCore | 112 GB | Up to 12.5 Gbps |
| Standard | db1v14m168 | 14 vCore | 168 GB | Up to 12.5 Gbps |
| Standard | db1v14m224 | 14 vCore | 224 GB | Up to 12.5 Gbps |
| Standard | db1v16m32 | 16 vCore | 32 GB | Up to 12.5 Gbps |
| Standard | db1v16m64 | 16 vCore | 64 GB | Up to 12.5 Gbps |
| Standard | db1v16m128 | 16 vCore | 128 GB | Up to 12.5 Gbps |
| Standard | db1v16m192 | 16 vCore | 192 GB | Up to 12.5 Gbps |
| Standard | db1v16m256 | 16 vCore | 256 GB | Up to 12.5 Gbps |
Table. Vertica(DBaaS) server type specifications - db1 server type
DB2 server type
The db2 server type of Vertica(DBaaS) is provided with standard specifications (vCPU, Memory) and is suitable for various database workloads.
- Up to 3.2GHz Intel 4th generation (Sapphire Rapids) Xeon Gold 6448H Processor
- Supports up to 16 vCPUs and 256 GB of memory
- Up to 12.5 Gbps networking speed
| Classification | Server Type | vCPU | Memory | Network Bandwidth |
|---|---|---|---|---|
| Standard | db2v1m2 | 1 vCore | 2 GB | Up to 10 Gbps |
| Standard | db2v2m4 | 2 vCore | 4 GB | Up to 10 Gbps |
| Standard | db2v2m8 | 2 vCore | 8 GB | Up to 10 Gbps |
| Standard | db2v2m16 | 2 vCore | 16 GB | Up to 10 Gbps |
| Standard | db2v2m24 | 2 vCore | 24 GB | Up to 10 Gbps |
| Standard | db2v2m32 | 2 vCore | 32 GB | Up to 10 Gbps |
| Standard | db2v4m8 | 4 vCore | 8 GB | Up to 10 Gbps |
| Standard | db2v4m16 | 4 vCore | 16 GB | Up to 10 Gbps |
| Standard | db2v4m32 | 4 vCore | 32 GB | Up to 10 Gbps |
| Standard | db2v4m48 | 4 vCore | 48 GB | Up to 10 Gbps |
| Standard | db2v4m64 | 4 vCore | 64 GB | Up to 10 Gbps |
| Standard | db2v6m12 | 6 vCore | 12 GB | Up to 10 Gbps |
| Standard | db2v6m24 | 6 vCore | 24 GB | Up to 10 Gbps |
| Standard | db2v6m48 | 6 vCore | 48 GB | Up to 10 Gbps |
| Standard | db2v6m72 | 6 vCore | 72 GB | Up to 10 Gbps |
| Standard | db2v6m96 | 6 vCore | 96 GB | Up to 10 Gbps |
| Standard | db2v8m16 | 8 vCore | 16 GB | Up to 10 Gbps |
| Standard | db2v8m32 | 8 vCore | 32 GB | Up to 10 Gbps |
| Standard | db2v8m64 | 8 vCore | 64 GB | Up to 10 Gbps |
| Standard | db2v8m96 | 8 vCore | 96 GB | Up to 10 Gbps |
| Standard | db2v8m128 | 8 vCore | 128 GB | up to 10 Gbps |
| Standard | db2v10m20 | 10 vCore | 20 GB | Up to 10 Gbps |
| Standard | db2v10m40 | 10 vCore | 40 GB | Up to 10 Gbps |
| Standard | db2v10m80 | 10 vCore | 80 GB | Up to 10 Gbps |
| Standard | db2v10m120 | 10 vCore | 120 GB | Up to 10 Gbps |
| Standard | db2v10m160 | 10 vCore | 160 GB | Up to 10 Gbps |
| Standard | db2v12m24 | 12 vCore | 24 GB | Up to 12.5 Gbps |
| Standard | db2v12m48 | 12 vCore | 48 GB | Up to 12.5 Gbps |
| Standard | db2v12m96 | 12 vCore | 96 GB | Up to 12.5 Gbps |
| Standard | db2v12m144 | 12 vCore | 144 GB | Up to 12.5 Gbps |
| Standard | db2v12m192 | 12 vCore | 192 GB | Up to 12.5 Gbps |
| Standard | db2v14m28 | 14 vCore | 28 GB | Up to 12.5 Gbps |
| Standard | db2v14m56 | 14 vCore | 56 GB | Up to 12.5 Gbps |
| Standard | db2v14m112 | 14 vCore | 112 GB | Up to 12.5 Gbps |
| Standard | db2v14m168 | 14 vCore | 168 GB | Up to 12.5 Gbps |
| Standard | db2v14m224 | 14 vCore | 224 GB | Up to 12.5 Gbps |
| Standard | db2v16m32 | 16 vCore | 32 GB | Up to 12.5 Gbps |
| Standard | db2v16m64 | 16 vCore | 64 GB | Up to 12.5 Gbps |
| Standard | db2v16m128 | 16 vCore | 128 GB | Up to 12.5 Gbps |
| Standard | db2v16m192 | 16 vCore | 192 GB | Up to 12.5 Gbps |
| Standard | db2v16m256 | 16 vCore | 256 GB | up to 12.5 Gbps |
Table. Vertica(DBaaS) server type specifications - db2 server type
DBH2 Server Type
The dbh2 server type of Vertica(DBaaS) is provided with large-capacity server specifications and is suitable for database workloads for large-scale data processing.
- Up to 3.2GHz Intel 4th generation (Sapphire Rapids) Xeon Gold 6448H Processor
- Supports up to 128 vCPUs and 1,536 GB of memory
- Up to 25Gbps networking speed
| Classification | Server Type | vCPU | Memory | Network Bandwidth |
|---|---|---|---|---|
| High Capacity | dbh2v24m48 | 24 vCore | 48 GB | Up to 25 Gbps |
| High Capacity | dbh2v24m96 | 24 vCore | 96 GB | Up to 25 Gbps |
| High Capacity | dbh2v24m192 | 24 vCore | 192 GB | Up to 25 Gbps |
| High Capacity | dbh2v24m288 | 24 vCore | 288 GB | Up to 25 Gbps |
| High Capacity | dbh2v32m64 | 32 vCore | 64 GB | Up to 25 Gbps |
| High Capacity | dbh2v32m128 | 32 vCore | 128 GB | Up to 25 Gbps |
| High Capacity | dbh2v32m256 | 32 vCore | 256 GB | Up to 25 Gbps |
| High Capacity | dbh2v32m384 | 32 vCore | 384 GB | Up to 25 Gbps |
| High Capacity | dbh2v48m192 | 48 vCore | 192 GB | Up to 25 Gbps |
| High Capacity | dbh2v48m576 | 48 vCore | 576 GB | Up to 25 Gbps |
| High Capacity | dbh2v64m256 | 64 vCore | 256 GB | Up to 25 Gbps |
| High Capacity | dbh2v64m768 | 64 vCore | 768 GB | Up to 25 Gbps |
| High Capacity | dbh2v72m288 | 72 vCore | 288 GB | Up to 25 Gbps |
| High Capacity | dbh2v72m864 | 72 vCore | 864 GB | Up to 25 Gbps |
| High Capacity | dbh2v96m384 | 96 vCore | 384 GB | Up to 25 Gbps |
| High Capacity | dbh2v96m1152 | 96 vCore | 1152 GB | Up to 25 Gbps |
| High Capacity | dbh2v128m512 | 128 vCore | 512 GB | Up to 25 Gbps |
| High Capacity | dbh2v128m1536 | 128 vCore | 1536 GB | Up to 25 Gbps |
Table. Vertica(DBaaS) server type specifications - dbh2 server type
3.1.2 - Monitoring Metrics
Vertica(DBaaS) monitoring metrics
The following table shows the performance monitoring metrics of Vertica (DBaaS) that can be checked through Cloud Monitoring. For detailed instructions on how to use Cloud Monitoring, please refer to the Cloud Monitoring guide.
The server monitoring metrics of Vertica(DBaaS) refer to the Virtual Server monitoring metrics guide.
| Performance Item | Detailed Description | Unit |
|---|---|---|
| Active Locks | Number of Active Locks | cnt |
| Active Sessions | Total number of active sessions | cnt |
| Instance Status | Node alive status | status |
| Tablespace Used | Tablespace usage | bytes |
Table. Vertica(DBaaS) Monitoring Metrics
3.2 - How-to guides
The user can enter the required information of Vertica(DBaaS) through the Samsung Cloud Platform Console and create the service by selecting detailed options.
Creating Vertica(DBaaS)
You can create and use the Vertica (DBaaS) service in the Samsung Cloud Platform Console.
To create a Vertica(DBaaS), follow these steps.
Click All Services > Data Analytics > Vertica(DBaaS) menu. It moves to the Service Home page of Vertica(DBaaS).
Service Home page, click the Vertica(DBaaS) creation button. Move to the creation page.
Create Vertica(DBaaS) page, enter the information required for service creation, and select detailed options.
Image and Version Selection area, please select the necessary information.
Classification NecessityDetailed Description Image Version Required Provides a list of Vertica (DBaaS) versions Table. Vertica(DBaaS) image and version input itemsEnter Service Information Enter or select the necessary information in the area.
Classification NecessityDetailed Description Server Name Prefix Required The name of the server where Vertica will be installed - Starts with a lowercase letter, and consists of 3 to 13 characters using lowercase letters, numbers, and special characters (
-)
- A postfix such as 001, 002 is attached based on the server name to create the actual server name
Cluster Name Required The name of the cluster that the servers are configured in - Enter in English, 3-20 characters
- A cluster is a unit that bundles multiple servers
Number of Nodes Required Number of Data Nodes - The number of nodes must be entered within the range of 1-10
- Entering the number of nodes as 2 or more to form a cluster ensures high availability
Service Type > Server Type Required Data Node Server Type - Standard: Standard specification commonly used
- High Capacity: High-capacity server with 24vCore or more
- For more information on the server types provided by Vertica(DBaaS), see Vertica(DBaaS) Server Type
Service Type > Planned Compute Selection Current status of resources with Planned Compute set - In Use: Number of resources with Planned Compute set that are currently in use
- Settings: Number of resources with Planned Compute set
- Coverage Preview: Amount applied by Planned Compute for each resource
- Apply for Planned Compute Service: Move to the Planned Compute service application page
- For more details, refer to How to Apply for Planned Compute
Service Type > Block Storage Required Type of Block Storage to be used for data node - Base OS: Area where the engine is installed
- DATA: Area for storing data files
- Select storage type and enter capacity (For more information on Block Storage type, refer to Creating Block Storage)
- SSD: General Block Storage
- SSD_KMS: Additional encryption volume using KMS (Key Management System) encryption key
- The set storage type will be applied equally to additional storage
- Capacity can be entered in multiples of 8 in the range of 16 to 5,120
- Select storage type and enter capacity (For more information on Block Storage type, refer to Creating Block Storage)
- Additional: DATA, Backup data storage area
- Select Use and enter Purpose and Capacity of storage
- To add storage, click the + button, and to delete, click the x button, up to 9 can be added
- Capacity can be entered in multiples of 8 in the range of 16 to 5,120, and up to 9 can be created
Management Console Selection Use selection, then select the server type of Node for cluster management and monitoring, and Block Storage settings Management Console > Server Type Required Select server type for data node for cluster management and monitoring Management Console > Block Storage Essential Select the type of Block Storage to be used for data nodes for cluster management and monitoring Network > Common Settings Required Network settings for servers created by the service - Select if you want to apply the same settings to all servers being installed
- Select pre-created VPC and Subnet
- IP: Enter the IP for each server
- Public NAT settings are only possible in server-specific settings
Network > Server Settings Required Network settings for installing servers created by the service - Select to apply different settings for each server being installed
- Select pre-created VPC and Subnet
- IP: Enter the IP for each server
- Public NAT feature is available only when the VPC is connected to the Internet Gateway, checking Use allows selection from the reserved IP in the VPC product’s Public IP. For more information, see Creating Public IP
IP Access Control Select Set service access policy - Set access policy for the IP entered on the page, so you don’t need to set Security Group policy separately
- Enter in IP format (e.g.,
192.168.10.1) or CIDR format (e.g.,192.168.10.0/24,192.168.10.1/32), and click the Add button
- To delete the entered IP, click the x button next to the entered IP
Maintenance period Select DB maintenance period - Use Select the day of the week, start time, and duration
- It is recommended to set the maintenance period for stable DB management. Patch work is performed at the set time and service interruption occurs
- If set to not used, SamsungSDS is not responsible for any problems that occur due to non-application of patches.
Table. Vertica(DBaaS) Service Configuration Items- Starts with a lowercase letter, and consists of 3 to 13 characters using lowercase letters, numbers, and special characters (
Database Configuration Required Information Input area, please enter or select the required information.
Classification NecessityDetailed Description Database name Mandatory Server name applied when installing DB - Starts with English and enters 3 to 20 characters using English and numbers
Database username required DB username - An account with the same name is also created in the OS
- Enter 2-20 characters using lowercase English letters
- Restricted Database usernames can be checked in the Console
Database password required Password to use when accessing the DB - Enter 8-30 characters including English, numbers, and special characters (excluding
"’)
Database password confirmation required Re-enter the password to be used when accessing the DB Database Port number required port number required for DB connection - DB port should be entered within the range of 1,024 ~ 65,535
Backup > Use Selection Whether to use node backup - Use is selected to select the node backup storage period and backup start time
Backup > Retention Period Select Backup Retention Period - Select the backup retention period. The file retention period can be set from 7 days to 35 days
- Backup files are charged separately depending on the capacity
Backup > Backup start time Select Backup start time - Select the backup start time
- The minutes when the backup is performed are set randomly, and the backup end time cannot be set
License Key Required Enter the Vertica License Key owned by the customer - If the entered license key is not valid, service creation is not possible
DB Locale required Settings related to string handling, number/currency/date/time display formats, etc. to be used in Vertica(DBaaS) - DB is created with the selected Locale as the default setting
Time Zone Required Standard time zone to use for Vertica (DBaaS) Fig. Essential configuration items for Vertica(DBaaS)Enter Additional Information Please enter or select the required information in the area.
Classification NecessityDetailed Description Tag Select Add Tag - Up to 50 can be added per resource
- Click the Add Tag button and enter or select Key, Value
Fig. Vertica(DBaaS) additional information input items
In the Summary panel, check the detailed information generated and the estimated billing amount, and click the Complete button.
- Once creation is complete, check the created resource on the Resource List page.
Check detailed information about Vertica(DBaaS)
The Vertica(DBaaS) service allows you to check and modify the entire resource list and detailed information. The Vertica(DBaaS) details page consists of details, tags, and operation history tabs.
To check the detailed information of the Vertica(DBaaS) service, follow the next procedure.
- Click All Services > Data Analytics > Vertica(DBaaS) menu. It moves to the Service Home page of Vertica(DBaaS).
- Service Home page, click the Vertica(DBaaS) menu. It moves to the Vertica(DBaaS) list page.
- Vertica(DBaaS) list page, click on the resource to check the detailed information. Move to the Vertica(DBaaS) details page.
- Vertica(DBaaS) Details page top shows status information and additional features.
| Classification | Detailed Description |
|---|---|
| Cluster Status | Cluster Status
|
| Cluster Control | Buttons that can change the cluster status
|
| Additional features more | Cluster related management buttons
|
| Service Cancellation | Button to cancel the service |
Fig. Vertica(DBaaS) Status Information and Additional Features
Detailed Information
On the Vertica(DBaaS) list page, you can check the detailed information of the selected resource and modify the information if necessary.
| Classification | Detailed Description |
|---|---|
| Server Information | Server information configured in the corresponding cluster
|
| Service | Service Name |
| Resource Type | Service Name |
| SRN | Unique resource ID in Samsung Cloud Platform
|
| Resource Name | Resource Name
|
| Resource ID | Unique resource ID in the service |
| Creator | User who created the service |
| Creation Time | Time when the service was created |
| Modifier | Service information modified user |
| Modified Time | Time when service information was modified |
| Image/Version | Installed DB image and version information |
| Cluster Name | Server cluster name composed of servers |
| Database name | Server name applied when DB was installed |
| Database username | DB user name |
| Planned Compute | Planned Compute status of set resources
|
| Maintenance Period | DB Maintenance Period Status
|
| Backup | Backup setting status
|
| Managed Console | Resource status of Managed Console set during DB installation |
| Network | Installed network information(VPC, Subnet) |
| IP Access Control | Service Access Policy Setting
|
| Time Zone | Standard time zone where Vertica(DBaaS) DB will be used |
| License | Vertica(DBaaS) license information |
| Server Information | Data/Console server type, default OS, additional Disk information
|
Table. Detailed information items of Vertica(DBaaS)
Tag
On the Vertica(DBaaS) list page, you can check the tag information of the selected resource, and add, change, or delete it.
| Classification | Detailed Description |
|---|---|
| Tag List | Tag list
|
Fig. Vertica(DBaaS) tags tab items
Work History
You can check the operation history of the selected resource on the Vertica(DBaaS) list page.
| Classification | Detailed Description |
|---|---|
| Work history list | Resource change history
|
Fig. Vertica(DBaaS) task history tab detailed information items
Managing Vertica (DBaaS) Resources
If you need to change the existing setting options of the generated Vertica(DBaaS) resource or add storage configuration, you can perform the task on the Vertica(DBaaS) details page.
Operating Control
If there are changes to the running Vertica (DBaaS) resource, you can start, stop, and restart it.
To control the operation of Vertica(DBaaS), follow the next procedure.
- Click All Services > Data Analytics > Vertica(DBaaS) menu. It moves to the Service Home page of Vertica(DBaaS).
- Service Home page, click the Vertica(DBaaS) menu. It moves to the Vertica(DBaaS) list page.
- Click the resource to control operation on the Vertica(DBaaS) list page. It moves to the Vertica(DBaaS) detail page.
- Check the status of Vertica(DBaaS) and complete the change through the control button below.
- Start: The server where the Vertica(DBaaS) service is installed and the Vertica(DBaaS) service is running.
- 중지: Vertica(DBaaS) service installed server and Vertica(DBaaS) service will be stopped.
- Restart: Only the Vertica (DBaaS) service will be restarted.
Synchronizing Service Status
You can synchronize the real-time service status of Vertica(DBaaS).
To check the service status of Vertica(DBaaS), follow the next procedure.
- Click All Services > Data Analytics > Vertica(DBaaS) menu. It moves to the Service Home page of Vertica(DBaaS).
- Service Home page, click the Vertica(DBaaS) menu. It moves to the Vertica(DBaaS) list page.
- Click the resource to check the service status on the Vertica(DBaaS) list page. It moves to the Vertica(DBaaS) details page.
- Service Status Synchronization button should be clicked. During the inquiry, the cluster changes to Synchronizing status.
- Once the query is complete, the status in the server information item is updated, and the cluster changes to Running status.
Changing the Server Type
You can change the configured server type.
Caution
- If the server type is configured as Standard, it cannot be changed to High Capacity. If you want to change to High Capacity, please create a new service.
- Modifying the server type requires a server restart. Please check separately for SW license modifications and SW settings due to server specification changes.
To change the server type, follow these steps.
- Click All Services > Data Analytics > Vertica(DBaaS) menu. It moves to the Service Home page of Vertica(DBaaS).
- Service Home page, click the Vertica(DBaaS) menu. Move to the Vertica(DBaaS) list page.
- On the Vertica(DBaaS) list page, click the resource you want to change the server type for. It moves to the Vertica(DBaaS) details page.
- Click the Edit icon of the server type you want to change at the bottom of the detailed information. The Server Type Edit popup window opens.
- Modify Server Type In the modify server type popup window, select the server type and click the OK button.
Adding Storage
If you need more than 5 TB of data storage space, you can add storage. If it is a high-availability configuration (HA cluster), adding or expanding storage capacity will be applied to all DBs simultaneously.
To add storage, follow these steps.
- Click All Services > Data Analytics > Vertica(DBaaS) menu. It moves to the Service Home page of Vertica(DBaaS).
- Service Home page, click the Vertica(DBaaS) menu. It moves to the Vertica(DBaaS) list page.
- On the Vertica(DBaaS) list page, click the resource to add storage. It moves to the Vertica(DBaaS) details page.
- Click the Disk 추가 button at the bottom of the detailed information. The 추가 스토리지 요청 popup window will open.
- In the Additional Storage Request popup window, enter the purpose and capacity, then click the Confirm button.
Expanding Storage
The storage added to the data area can be expanded up to a maximum of 5TB based on the initially allocated capacity. Storage can be expanded without stopping Vertica (DBaaS), and if configured in a cluster, all nodes are expanded simultaneously.
To increase the storage capacity, follow the procedure below.
- Click All Services > Data Analytics > Vertica(DBaaS) menu. It moves to the Service Home page of Vertica(DBaaS).
- On the Service Home page, click the Vertica(DBaaS) menu. It moves to the Vertica(DBaaS) list page.
- On the Vertica(DBaaS) list page, click the resource you want to change the server type for. It moves to the Vertica(DBaaS) details page.
- Click the Modify button of the additional Disk you want to add at the bottom of the detailed information. The Modify Additional Storage popup window will open.
- Modify Additional Storage popup window, enter the expansion capacity, then click the Confirm button.
Change Recovery DB instance type
After DB recovery is complete, you can change the instance type from the Recovery detailed information screen.
To change the Recovery DB instance type, follow these steps.
- Click All Services > Data Analytics > Vertica(DBaaS) menu. It moves to the Service Home page of Vertica(DBaaS).
- On the Service Home page, click the Vertica(DBaaS) menu. It moves to the Vertica(DBaaS) list page.
- Vertica(DBaaS) list page, click the resource to change the Recovery DB instance type. It moves to the Vertica(DBaaS) details page.
- Click the Change Instance Type button. The Change Instance Type confirmation window will be displayed.
- The DB instance type is changed from Recovery to Active to perform the same function as a single DB.
Canceling Vertica(DBaaS)
You can cancel unused Vertica(DBaaS) to reduce operating costs. However, when canceling the service, the operating service may be stopped immediately, so you should consider the impact of stopping the service sufficiently before proceeding with the cancellation work.
To cancel Vertica(DBaaS), follow these steps.
- Click All Services > Data Analytics > Vertica(DBaaS) menu. It moves to the Service Home page of Vertica(DBaaS).
- Service Home page, click the Vertica(DBaaS) menu. Move to the Vertica(DBaaS) list page.
- Vertica(DBaaS) list page, select the resource to be canceled and click the Service Cancellation button.
- Once the cancellation is complete, check if the resource has been cancelled on the Vertica(DBaaS) list page.
3.2.1 - Vertica Backup and Recovery
Users can set up backups of Vertica (DBaaS) through the Samsung Cloud Platform Console and restore from the backed-up files.
Vertica(DBaaS) Backup
You can set up a backup function so that the user’s data can be stored safely. Also, through the backup history function, you can verify whether the backup was performed correctly and you can also delete backed-up files.
Set up backup
For backup configuration of Vertica(DBaaS), see Create Vertica(DBaaS).
To modify the backup settings of Vertica (DBaaS), follow the steps below.
Caution
- If a backup is set, the backup will be performed at the designated time after the set time, and additional charges will be incurred depending on the backup size.
- If you change the backup setting to unused, backup execution will stop immediately, and the stored backup data will be deleted and can no longer be used.
- All Services > Data Analytics > Vertica(DBaaS) Click the menu. Navigate to the Service Home page of Vertica(DBaaS).
- Click the Vertica(DBaaS) menu on the Service Home page. Navigate to the Vertica(DBaaS) List page.
- Click the resource to set backup on the Vertica(DBaaS) List page. You will be taken to the Vertica(DBaaS) Details page.
- Click the Edit button of the backup item. Backup Settings popup window opens.
- When setting up a backup, click Use in the Backup Settings popup, select the retention period and backup start time, and click the Confirm button.
- If you want to stop the backup setting, uncheck Use in the Backup Setting popup window and click the Confirm button.
Check backup history
Guide
To set notifications for backup success and failure, you can configure them via the Notification Manager product. For a detailed usage guide on setting notification policies, refer to Create Notification Policy.
To view the backup history, follow these steps.
- All Services > Data Analytics > Vertica(DBaaS) Click the menu. Go to the Service Home page of Vertica(DBaaS).
- Click the Vertica(DBaaS) menu on the Service Home page. Navigate to the Vertica(DBaaS) list page.
- Click the resource to view the backup history on the Vertica(DBaaS) 목록 page. Go to the Vertica(DBaaS) 상세 page.
- Click the Backup History button. Backup History popup opens.
- Backup History In the popup window, you can check the backup status, version, backup start date and time, backup completion date and time, and size.
Delete backup file
To delete the backup history, follow the steps below.
Caution
Backup files cannot be restored after deletion. Please be sure to confirm whether the data is unnecessary before deleting.
- All Services > Data Analytics > Vertica(DBaaS) Click the menu. Navigate to the Service Home page of Vertica(DBaaS).
- Service Home page, click the Vertica(DBaaS) menu. Go to the Vertica(DBaaS) list page.
- Vertica(DBaaS) List On the page, click the resource to view the backup history. Vertica(DBaaS) Details You will be taken to the page.
- Click the Backup History button. The Backup History popup window opens.
- Backup History In the popup window, check the file you want to delete, then click the Delete button.
Vertica(DBaaS) Recover
If restoration from a backup file is required due to a failure or data loss, you can use the cluster recovery feature to recover based on a specific point in time.
Caution
To perform recovery, a capacity at least equal to the data type Disk capacity is required. If Disk capacity is insufficient, recovery may fail.
Vertica (DBaaS)를 복구하려면 다음 절차를 따르세요.
- All Services > Data Analytics > Vertica(DBaaS) Click the menu. Navigate to the Service Home page of Vertica(DBaaS).
- Click the Vertica(DBaaS) menu on the Service Home page. Go to the Vertica(DBaaS) List page.
- Vertica(DBaaS) Resource On the list page, click the resource you want to recover. You will be taken to the Vertica(DBaaS) Detail page.
- Click the Database Recovery button. Go to the Database(DBaaS) Recovery page.
- Database Recovery area, after entering the relevant information, click the Complete button.
Category Required or notDetailed description Recovery Type Required Set the point in time the user wants to recover - Backup point (recommended): Recover based on backup file. Select from the list of backup file timestamps displayed in the list
- Recovery point: Choose the date and time to recover. Can be selected from the start time of the backup history
Server Name Prefix Required Recovery DB Server Name - Enter 3~16 characters starting with a lowercase English letter, using lowercase letters, numbers, and the special character (
-)
- A postfix such as 001, 002 is appended based on the server name to create the actual server name
Cluster Name Required Recovery DB Cluster Name - Enter using English, 3 to 20 characters
- A cluster is a unit that groups multiple servers
Number of nodes Select Number of data nodes - Set to be the same as the number of nodes configured in the original cluster.
Service Type > Server Type Required Recovery DB Server Type - Standard: Standard specifications commonly used
- High Capacity: Large-capacity server of 24 vCore or more
Service Type > Planned Compute Select Status of resources with Planned Compute set - In Use: Number of resources with Planned Compute that are currently in use
- Configured: Number of resources with Planned Compute set
- Coverage Preview: Amount applied per resource by Planned Compute
- Planned Compute Service Application: Go to the Planned Compute service application page
- For details, refer to Planned Compute Apply
Service Type > Block Storage Required Block Storage settings used by the recovery DB - Base OS: Area where the DB engine is installed
- DATA: Storage area for table data, archive files, etc.
- Apply the same Storage type as set in the source cluster
- After selecting Use, enter the storage purpose and capacity
- Click the + button to add storage, and the x button to delete
- Capacity can be entered in multiples of 8 within the range 16 to 5,120, and up to 9 can be created
Management Console > Server Type Required Management Console Server Type - After selecting Use, choose the storage purpose and capacity
- Standard: Standard specifications commonly used
- High Capacity: Large-capacity server with 24 vCore or more
Management Console > Block Storage Required Block Storage settings used by Management Console - Select Use and then select Base OS
Database username Required Database username - Apply the same username set in the original cluster
Database Password Required Database Password - Apply the same password set in the original cluster
Database Port Number Required Database Port Number - Apply the same Port number as set in the original cluster
IP Access Control Select Service Access Policy Settings - Since the access policy is set for the IP entered on the page, you do not need to separately configure Security Group policies.
- Enter in IP format (e.g.,
192.168.10.1) or CIDR format (e.g.,192.168.10.0/24,192.168.10.1/32) and click the Add button
- To delete an entered IP, click the x button next to the entered IP
Maintenance period Select DB maintenance period - If Use is selected, set day of week, start time, and duration
- It is recommended to set a maintenance period for stable DB management. Patch work will be performed at the set time, causing service interruption
- If set to not use, Samsung SDS is not responsible for issues arising from unapplied patches.
License Key Required Enter the Vertica License Key to recover - If the entered license key is not valid, service creation is not possible
Tag Select Add Tag - Add Tag button click after entering or selecting Key, Value values
Table. Vertica(DBaaS) Recovery Configuration Items
3.3 - API Reference
API Reference
3.4 - CLI Reference
CLI Reference
3.5 - Release Note
Vertica(DBaaS)
2025.07.01
NEW
Vertica(DBaaS) Service Official Version Release- Released Vertica(DBaaS) service, which can efficiently store data and improve query performance with columnar storage-based compression and encoding features.
4 - Data Flow
4.1 - Overview
Service Overview
Data Flow is a data processing flow tool that extracts large amounts of data from various data sources and visually creates a processing flow for transformation/transmission of stream/batch data, providing open-source Apache NiFi. Data Flow can be used independently in the Kubernetes Engine cluster environment of the Samsung Cloud Platform or with other application software.
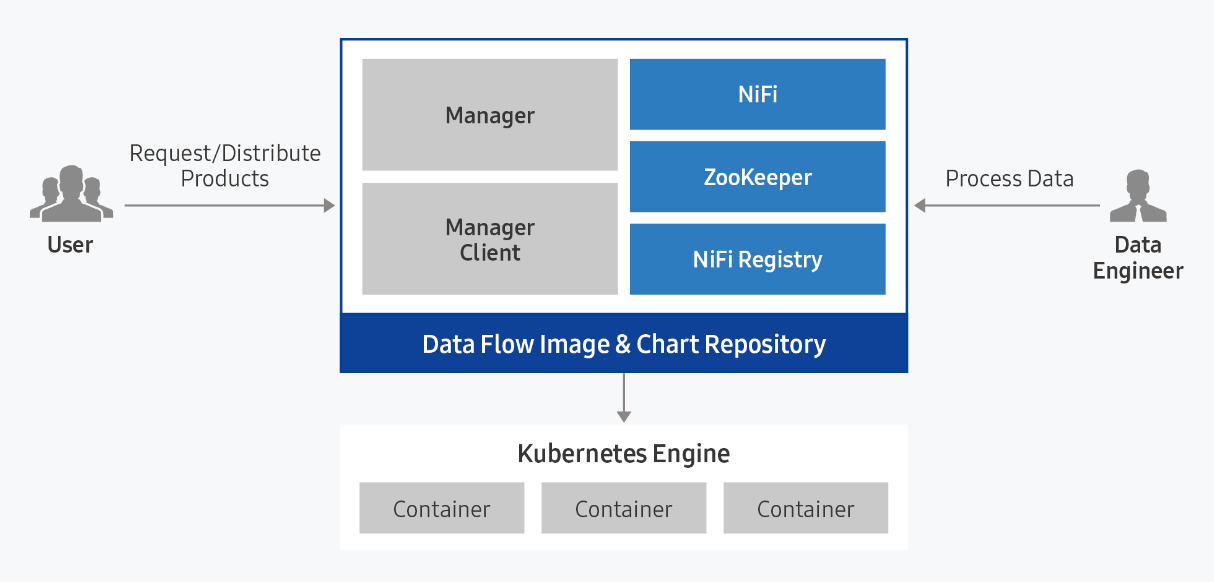
Provided Features
Data Flow provides the following functions.
- Easy installation and management: Data Flow can be easily installed through the web-based Samsung Cloud Platform Console in a standard Kubernetes cluster environment. Based on open-source Apache NiFi, it automatically configures the architecture required for extensible clustering, and automatically installs ZooKeeper, Registry, and management modules. Through Data Flow, you can set up and deploy the setting files, NiFi templates, etc. required for service connection.
- Easy Data Flow Management: The processing flow of stream/batch data can be easily written in a GUI-based manner tailored to the user environment, and efficient data extraction/transmission/processing between systems is possible with GUI-based data flow writing.
- NiFi Template Gallery: You can share/distribute reference NiFi templates. Data Flow provides a gallery of work files for data processing flows frequently used in the field, and users can share their own data processing flow tasks.
Component
Data Flow is composed of Manager and Service modules, and provides Apache NiFi as a package.
Data Flow Manager
Data Flow Manager provides various managing functions to utilize NiFi more efficiently.
- Through Data Flow Manager, customers can upload the Nar File they created and use it in the Processor, and upload setting files to share them.
- Among NiFi templates, high-frequency templates are assetized and provided as a gallery, and can be used immediately with just one click.
- Provides real-time monitoring and resource status monitoring for multiple services configured for Native NiFi Service.
- You can easily provision setting information for NiFi configuration components within the cluster.
Data Flow Service
- It provides a data flow management service based on Apache NiFi.
- It automatically configures the architecture required for extensible clustering based on Apache NiFi, and Nifi, ZooKeeper, Nifi Registry modules are automatically installed.
- When providing Nifi, you can set Description, resource size, access ID/PW, and Host Alias.
- After creating the service, you can modify the Description, necessary resource size, access password, Host Alias, etc. and reflect them in the service.
Server spec type
When creating a Data Flow service, please check the following contents.
- Recommended Service Installation Specifications: CPU 21 core, Memory 57 GB, storage 100 GB or more
Reference
- The Data Flow service needs to be installed before creating the Ingress Controller.
- In a Kubernetes cluster, only 1 Ingress Controller can be installed.
- For more information, please refer to Ingress Controller installation.
Regional Provision Status
Data Flow is available in the following environments.
| Region | Availability |
|---|---|
| Western Korea (kr-west1) | Provided |
| Korea East (kr-east1) | Available |
| South Korea (kr-south1) | Not provided |
| South Korea southern region 2 (kr-south2) | Not provided |
| South Korea southern region 3(kr-south3) | Not provided |
Table. Data Flow Provision Status by Region
Preceding Service
This is a list of services that must be pre-configured before creating this service. Please refer to the guide provided for each service and prepare in advance.
| Service Category | Service | Detailed Description |
|---|---|---|
| Storage | File Storage | Storage that allows multiple client servers to share files through network connections |
| Container | Kubernetes Engine | Kubernetes container orchestration service |
Fig. Preceding Data Flow Service
4.2 - How-to guides
The user can enter the essential information of Data Flow through the Samsung Cloud Platform Console and create the service by selecting detailed options.
Creating Data Flow
You can create and use the Data Flow service in the Samsung Cloud Platform Console.
To create a Data Flow, follow the next procedure.
Click on the menu for all services > Data Analytics > Data Flow. It moves to the Service Home page of Data Flow.
On the Service Home page, click the Create Data Flow button. It moves to the Create Data Flow page.
Data Flow Creation page where you enter the information needed to create a service and select detailed options.
Version Selection area, please select the necessary information.
Division NecessityDetailed Description Data Flow version required Select version of the selected image - Provide a list of versions of the server image provided
Fig. Data Flow version selection itemsCluster Selection area, please enter or select the required information. To install Data Flow, creating nodes for the Kubernetes cluster and a workspace is required first.
Classification NecessityDetailed Description Cluster Name Required Select Cluster to Use Ingress Controller Required Select the Ingress Controller installed in the cluster - In the Details tab of the installed Ingress Controller, add the following information to the ConfigMap item:
- Key: allow-snippet-annotations
- Value: true
Fig. Data Flow cluster selection items - In the Details tab of the installed Ingress Controller, add the following information to the ConfigMap item:
Service Information Input area, please enter or select the necessary information.
Classification NecessityDetailed Description Data Flow name required Enter Data Flow name - Start with lowercase English letters and do not end with a special character (
-), using lowercase English letters, numbers, and special characters (-) to input 3 ~ 30 characters
Storage Class Required Select the storage class used by the chosen cluster Description Select Enter additional information or description about the Data Flow within 150 characters Domain setting Mandatory Enter Data Flow domain - Start with lowercase English letters and do not end with a special character (
-), using lowercase letters, numbers, and special characters (-) to input 3 to 50 characters
- {Data Flow name}.{set domain} will be the Data Flow access address.
Node Selector Required To install on a specific node, enter a distinguishable label from the node’s labels - If the node label is entered incorrectly, an installation error may occur, so check the node label in advance
- The node label can be checked in the yaml file of the corresponding node
Account Required Enter Data Flow Manager account - ID: Starts with lowercase English letters and uses lowercase letters and numbers to enter a value between 6 and 30
- Password: Includes uppercase (English), lowercase (English), numbers, and special characters (
!@#$%^&*) and enter 8 to 50 characters
- Password Confirmation: Enter the password exactly once more
Host Alias Selection Add host information to be connected to Data Flow (up to 20 can be created, including default) - Select “Use”, then click the + button
- Hostname: Enter in hostname or domain format, using lowercase, numbers, and special characters (
-) with 3-63 characters
- IP: Enter in IP format
- To delete, click the X button
- The firewall between the cluster and the server must be open to use the added host information
Fig. Data Flow service information input items - Start with lowercase English letters and do not end with a special character (
Enter Additional Information area, please enter or select the necessary information.
Division NecessityDetailed Description Tag Selection Tag addition - Tag addition button to create and add tags or add existing tags possible
- Up to 50 tags can be added
- Newly added tags are applied after service creation is complete
Fig. Data Flow Additional Information Input Items
In the Summary panel, review the detailed information and estimated charges, then click the Complete button.
- Once creation is complete, check the created resource on the Data Flow list page.
Check Data Flow Detailed Information
You can check and modify the list of all resources and detailed information of Data Flow. The Data Flow details page consists of detailed information, tags, and work history tabs.
To check the detailed information of Data Flow, follow the next procedure.
- Click on the menu for all services > Data Analytics > Data Flow. It moves to the Service Home page of Data Flow.
- On the Service Home page, click the Data Flow menu. It moves to the Data Flow list page.
- Data Flow list page, click on the resource to check the detailed information. It moves to the Data Flow details page.
- Data Flow Details page top shows status information and additional function information.
| Classification | Detailed Description |
|---|---|
| Status Display | Data Flow Status
|
| Hosts file setting information | Button to check and copy host file information to access Data Flow |
| Service Cancellation | Button to cancel the service |
Fig. Data Flow status information and additional functions
Detailed Information
On the Data Flow List page, you can check the detailed information of the selected resource and modify the information if necessary.
| Classification | Detailed Description |
|---|---|
| Service | Service Category |
| Resource Type | Service Name |
| SRN | Samsung Cloud Platform의 고유 자원 ID
|
| Resource Name | Resource Name
|
| Resource ID | Unique resource ID in the service |
| Creator | User who created the service |
| Creation Time | Time when the service was created |
| Modifier | User who modified the service information |
| Revision Time | Time when service information was revised |
| Cluster Name | Server cluster name composed of servers |
| Storage Class | Storage class used by the selected cluster |
| Description | Additional information or description about Data Flow |
| Domain Setting | Data Flow Domain Name |
| Node Selector | Node Label |
| Web Url | Data Flow URL |
| Account | Data Flow Manager account |
| Host Alias | Host information to be connected to Data Flow |
Fig. Data Flow detailed information tab items
Tag
On the Data Flow List page, you can check the tag information of the selected resource, and add, change, or delete it.
| Classification | Detailed Description |
|---|---|
| Tag list | Tag list
|
Fig. Data Flow tag tab items
Work History
You can check the work history of the selected resource on the Data Flow list page.
| Classification | Detailed Description |
|---|---|
| Work history list | Resource change history
|
| Fig. Data Flow job history tab detailed information items |
Data Flow cancellation
You can cancel unused Data Flow to reduce operating costs. However, if you cancel the service, the operating service may be stopped immediately, so you should consider the impact of stopping the service sufficiently before proceeding with the cancellation work.
To cancel Data Flow, follow the next procedure.
- Click on the menu for all services > Data Analytics > Data Flow. It moves to the Service Home page of Data Flow.
- Service Home page, click the Data Flow menu. It moves to the Data Flow list page.
- Data Flow list page, select the resource to be canceled and click the Service Cancellation button.
- Once the cancellation is complete, check the Data Flow list page to see if the resource has been cancelled.
Notice
- Data Flow You must first delete the connected Data Flow Services to cancel.
- Data Flow will be cancelled, and the created namespace will also be deleted.
4.2.1 - Data Flow Services
The user can enter the essential information of Data Flow Services in the Data Flow service through the Samsung Cloud Platform Console and create the service by selecting detailed options.
Create Data Flow Services
The user can add a service by selecting the detailed options of the Data Flow service or entering the setting value.
Notice
When applying for Data Flow Services, the scale of resources must be secured to be more than the available capacity of the K8s cluster.
To create Data Flow Services, follow these steps.
Click all services > Data Analytics > Data Flow menu. It moves to Data Flow Service Home page.
On the Service Home page, click Data Flow Services. It moves to the Data Flow Services list page.
On the Data Flow Services list page, click the Create Data Flow Services button. It moves to the Create Data Flow Services page.
Data Flow Services Creation page, enter the information required for service creation and select detailed options.
Enter Service Information Enter or select the required information in the area.
Classification NecessityDetailed Description Data Flow name required Data Flow selection Flow Service name Required Enter Data Flow Services name - Start with lowercase English letters and do not end with a special character (
-), use lowercase letters, numbers, and special characters (-) to enter 3 to 30 characters
Storage Class Required Select the storage class used by the selected cluster Description Select Enter additional information or description about Data Flow Services within 150 characters Domain Setting Mandatory Enter the Data Flow Services domain - Start with lowercase English letters and do not end with a special character (
-), use lowercase letters, numbers, and special characters (-) to input 3 ~ 50 characters
- {Data Flow Services name}.{set domain} will be the Data Flow Services access address.
Node Selector Required To install on a specific node, enter a distinguishable Label from the node’s Labels - If the node Label is entered incorrectly, an installation error may occur, so check the node Label in advance
- The node Label can be checked in the yaml file of the corresponding node
Service Workload Required - Nifi: A module that provides Apache Nifi services and UI
- Nifi Registry: A module for setting and deploying Nifi templates
- Zookeeper: A module that supports distributed processing of Nifi in multiple nodes
Account Required Enter Nifi account - ID: Enter a value between 6 and 30 characters, starting with a lowercase letter and using lowercase letters and numbers
- Password: Enter a value of 8 to 50 characters, including uppercase letters (English), lowercase letters (English), numbers, and special characters (
!@#$%^&*)
- Password Confirmation: Enter the password again, identical to the previous entry
Fig. Data Flow Services Service Information Input Items- Start with lowercase English letters and do not end with a special character (
Additional Information Input area, please enter or select the required information.
Classification NecessityDetailed Description Host Alias Selection Add host information to be connected to Data Flow (up to 20 can be created, including default) - Use is selected and then + button is clicked
- Hostname: in the form of hostname or domain, using lowercase letters, numbers, and special characters (
-) to enter 3 ~ 63 characters
- IP: enter in IP format
- click the X button to delete
- the firewall between the cluster and the corresponding server must be open to use the added host information
Tag Selection Add tag - Add tag button to create and add tags or add existing tags
- Up to 50 tags can be added
- Newly added tags are applied after service creation is completed
Fig. Data Flow Additional Information Input Items
In the Summary panel, review the detailed information and estimated charges, and click the Complete button.
- Once creation is complete, check the created resource on the Data Flow Services list page.
Data Flow Services detailed information check
You can check and modify the list of all resources and detailed information of Data Flow Services. The Data Flow Services details page consists of details, tags, and operation history tabs.
To check the detailed information of Data Flow Services, follow the next procedure.
- 모든 서비스 > Data Analytics > Data Flow menu should be clicked. It moves to the Service Home page of Data Flow.
- Service Home page, click the Data Flow Services menu. It moves to the Data Flow Services list page.
- Data Flow Services list page, click on the resource to check the detailed information. Move to the Data Flow Services details page.
- Data Flow Services Details page displays status information and additional features at the top.
| Classification | Detailed Description |
|---|---|
| Status Display | Data Flow Services status
|
| Hosts file setting information | A button to check and copy host file information to access Data Flow Services |
| Data Flow Services deletion | Button to cancel the service |
Fig. Data Flow Services Status Information and Additional Functions
Detailed Information
On the Data Flow Services list page, you can check the detailed information of the selected resource and modify the information if necessary.
| Division | Detailed Description |
|---|---|
| Service | Service Name |
| Resource Type | Resource Type |
| SRN | Unique resource ID in Samsung Cloud Platform
|
| Resource Name | Resource Name
|
| Resource ID | Unique resource ID in the service |
| Creator | Service creator user |
| Creation Time | The time when the service was created |
| Modifier | User who modified the service information |
| Modified Time | Time when service information was modified |
| Data Flow Name | Data Flow Name |
| Storage Class | Storage class used by the selected cluster |
| Description | Additional information or description about Data Flow Services |
| Domain Setting | Data Flow Services domain name |
| Node Selector | Node Label |
| Web Url | Data Flow Services URL |
| Account | Airflow Account |
| Host Alias | Host information to be connected to Data Flow Services |
Fig. Data Flow Services detailed information tab items
Tag
On the Data Flow Services List page, you can check the tag information of the selected resource, and add, change, or delete it.
| Classification | Detailed Description |
|---|---|
| Tag list | Tag list
|
Fig. Data Flow Services Tag Tab Items
Work History
You can check the operation history of the selected resource on the Data Flow Services list page.
| Classification | Detailed Description |
|---|---|
| Work history list | Resource change history
|
Fig. Data Flow Services job history tab detailed information items
Cancel Data Flow Services
You can cancel unused Data Flow Services to reduce operating costs. However, when canceling a service, the operating service may be stopped immediately, so you should consider the impact of stopping the service sufficiently before proceeding with the cancellation work.
To cancel Data Flow or Data Flow Services, follow the procedure below.
- Click All Services > Data Analytics > Data Flow menu. It moves to the Service Home page of Data Flow.
- Service Home page, click the Data Flow Services menu. Move to the Data Flow Services list page.
- Data Flow Services list page, select the resource to be canceled and click the Data Flow Services delete button.
- Once the cancellation is complete, please check if the resource has been cancelled on the Data Flow Services list page.
Notice
- Data Flow Services will be cancelled, and the created namespace will also be deleted.
4.2.2 - Installing Ingress Controller
The user must install the Ingress Controller before creating the Data Flow service. Only one Ingress Controller must be installed in a Kubernetes cluster.
Install Ingress Controller using Container Registry
To install Ingress Controller using Container Registry, follow the procedure below.
For detailed Container Registry creation methods, please refer to the Container > Container Registry > How-to guides guide.
- Prepare the SCR (Samsung Container Registry) to store the Ingress Controller image.
- Push the Ingress Controller image to SCR(Samsung Container Registry).
- Download the YAML file used for installation from Ingress GitHub and modify the following items.
Color mode
kind: Deployment
...
spec:
  template:
    spec:
      containers:
image: {SCR private endpoint}.{repository name}.{image name}:{tag}kind: Deployment
...
spec:
template:
spec:
containers:
image: {SCR private endpoint}.{repository name}.{image name}:{tag}Color mode
kind: ConfigMap
...
metadata:
labels:
app: ingress-controller
kind: Service
...
metadata:
labels:
app: ingress-controller
kind: Deployment
...
metadata:
labels:
app: ingress-controller
kind: IngressClass
...
metadata:
labels:
app: ingress-controllerkind: ConfigMap
...
metadata:
labels:
app: ingress-controller
kind: Service
...
metadata:
labels:
app: ingress-controller
kind: Deployment
...
metadata:
labels:
app: ingress-controller
kind: IngressClass
...
metadata:
labels:
app: ingress-controller- You can install the Ingress Controller using the Create Object button in the Workloads > Deployments list in Kubernetes Engine using the modified YAML file.
Reference
For detailed object creation methods, please refer to Container > Kubernetes Engine > Creating Deployments.
4.3 - API Reference
API Reference
4.4 - CLI Reference
CLI Reference
4.5 - Release Note
Data Flow
2025.04.28
NEW
Official Release of Data Flow Service- The Data Flow service, which extracts/transforms/transfers data from various sources and automates data processing flows, has been released.
- It provides open-source Apache NiFi.
5 - Data Ops
5.1 - Overview
Service Overview
Data Ops is a managed workflow orchestration service based on Apache Airflow that writes workflows for periodic or repetitive data processing tasks and automates task scheduling. Users can automate the process of bringing useful data to the right place at the right time, and monitor the configuration and progress of data pipelines.
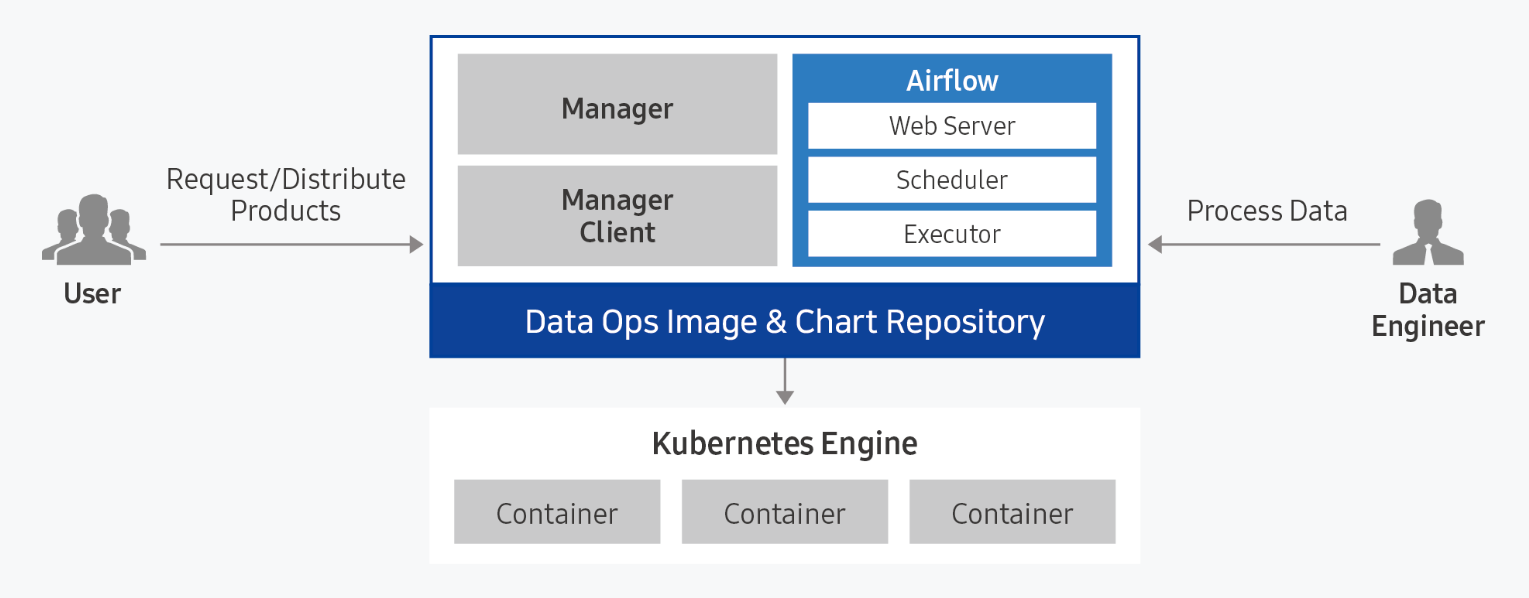
Provided Features
Data Ops provides the following functions.
- Easy installation and management: Data Ops can be easily installed through a web-based Console in a standard Kubernetes cluster environment. Apache Airflow and management modules are automatically installed, and integrated monitoring of the execution status of web servers and schedulers is possible through an integrated dashboard.
- Dynamic Pipeline Composition: Pipeline composition for data tasks is possible based on Python code. Since it dynamically generates tasks in conjunction with data task scheduling, you can freely compose the desired workflow form and scheduling.
- Convenient workflow management: DAG (Direct Acyclic Graph: directed acyclic graph) configuration is visualized and managed through a web-based UI, making it easy to understand the data flow’s preceding and parallel relationships. Additionally, each task’s timeout, retry count, priority definition, etc. can be easily managed.
Component
Data Ops consists of Manager and Service modules, and provides Apache Airflow by packaging it.
Data Ops Manager
Data Ops Manager provides various managing functions to use Airflow more efficiently.
- You can upload Plugin File, Shared File, Python Library File to be used in Ops Service through Ops Manager.
- You can easily provision setting information for Airflow configuration components within the cluster.
- You can manage and easily provision different service settings within the Airflow cluster.
Data Ops Service
- Provides a managed workflow orchestration service based on Apache Airflow.
- When Airflow is provided, you can set Description, necessary resource size, DAGs GitSync, and Host Alias.
- After creating a service, you can modify Description, resource usage, DAGs GitSync, and Host Alias to reflect the service.
Server Spec Type
When creating a Data Ops service, please check the following contents.
- Recommended Service Installation Specifications: CPU KubernetesExecutor 43 core, CPU CeleryExecutor 25 core, Memory 50 GB, storage 100 GB or more
Note
- It is necessary to install Ingress Controller before creating Data Ops service.
- In a Kubernetes cluster, only 1 Ingress Controller can be installed.
- For more detailed information, please refer to Ingress Controller installation.
Regional Provision Status
Data Ops is available in the following environments.
| Region | Availability |
|---|---|
| Western Korea(kr-west1) | Provided |
| Korea East(kr-east1) | Not provided |
| South Korea (kr-south1) | Provided |
| South Korea Central(kr-central) | Available |
| South Korea southern region 3(kr-south3) | Provided |
Table. Data Ops Regional Provision Status
Preceding Service
This is a list of services that must be pre-configured before creating this service. Please refer to the guide provided for each service and prepare in advance.
| Service Category | Service | Detailed Description |
|---|---|---|
| Storage | File Storage | Storage that allows multiple client servers to share files through network connections |
| Container | Kubernetes Engine | Kubernetes container orchestration service |
| Container | Container Registry | A service that easily stores, manages, and shares container images |
Fig. Data Ops Preceding Service
5.2 - How-to guides
The user can enter the essential information of Data Ops through the Samsung Cloud Platform Console and create the service by selecting detailed options.
Create Data Ops
You can create and use the Data Ops service on the Samsung Cloud Platform Console.
To create Data Ops, follow the following procedure.
Click on the menu for all services > Data Analytics > Data Ops. It moves to the Service Home page of Data Ops.
On the Service Home page, click the Create Data Ops button. It moves to the Create Data Ops page.
Data Ops Creation page, enter the information required for service creation and select detailed options.
Version Selection area, please select the necessary information.
Classification NecessityDetailed Description Data Ops version required Select version of the selected image - Provide a list of versions of the provided server image
Table. Data Ops version selection itemsCluster Selection area, please enter or select the required information. To install Data Ops, it is necessary to create nodes for the Kubernetes cluster and the working environment first.
Classification MandatoryDetailed Description Cluster Name Required Select Cluster to Use Ingress Controller required Select the Ingress Controller installed in the cluster Fig. Data Ops Cluster Selection ItemsEnter Service Information area, please enter or select the necessary information.
Classification NecessityDetailed Description Data Ops name required Enter Data Ops name - Start with lowercase English letters and do not end with special characters (
-), use lowercase letters, numbers, and special characters (-) to enter 3 ~ 30 characters
Storage Class Required Select the storage class used by the selected cluster Description Optional Enter additional information or description about Data Ops within 150 characters Domain Setting Mandatory Enter Data Ops domain - Start with lowercase English letters and do not end with a special character (
-), use lowercase letters, numbers, and special characters (-) to enter 3 to 50 characters
- {Data Ops name}.{set domain} will be the Data Ops access address.
Node Selector Required To install on a specific node, enter a distinguishable Label from the node’s Labels - If the node Label is entered incorrectly, an installation error may occur, so check the node Label in advance
- The node Label can be checked in the yaml file of the corresponding node
Account Required Enter Data Ops Manager account - ID: Enter a value between 6 and 30 characters, starting with a lowercase English letter and using only lowercase letters and numbers
- Password: Enter a value between 8 and 50 characters, including uppercase letters (English), lowercase letters (English), numbers, and special characters (
!@#$%^&*)
- Password Confirmation: Enter the password again, identical to the previous entry
Host Alias Selection Add host information to be connected to Data Ops (up to 20 can be created, including default) - Select “Use” and click the + button
- Hostname: Enter in hostname or domain format, using lowercase letters, numbers, and special characters (
-) in 3-63 characters
- IP: Enter in IP format
- To delete, click the X button
- The firewall between the cluster and the corresponding server must be open to use the added host information
Fig. Data Ops Service Information Input Items- Start with lowercase English letters and do not end with special characters (
Enter Additional Information Enter or select the required information in the area.
Classification NecessityDetailed Description Tag Select Add Tag - Add Tag button to create and add tags or add existing tags
- Up to 50 tags can be added
- Newly added tags will be applied after service creation is complete
Fig. Data Ops Additional Information Input Items
In the Summary panel, review the detailed information and estimated charges, and then click the Complete button.
- Once creation is complete, check the created resource on the Data Ops list page.
Data Ops detailed information check
You can check and modify the full list of Data Ops resources and detailed information. The Data Ops details page consists of detailed information, tags, and work history tabs.
To check the detailed information of Data Ops, follow the next procedure.
- 모든 서비스 > Data Analytics > Data Ops menu should be clicked. It moves to the Service Home page of Data Ops.
- Service Home page, click the Data Ops menu. It moves to the Data Ops list page.
- Data Ops list page, click on the resource to check the detailed information. It moves to the Data Ops details page.
- Data Ops Details page top shows status information and additional function information.
| Classification | Detailed Description |
|---|---|
| Status Display | Data Ops Status
|
| Hosts file setting information | Button to check and copy host file information to access Data Ops |
| Service Cancellation | Button to cancel the service |
Fig. Data Ops Status Information and Additional Features
Detailed Information
On the Data Ops list page, you can check the detailed information of the selected resource and modify the information if necessary.
| Classification | Detailed Description |
|---|---|
| Service | Service Name |
| Resource Type | Resource Type |
| SRN | Unique resource ID in Samsung Cloud Platform
|
| Resource Name | Resource Name
|
| Resource ID | Unique resource ID in the service |
| Creator | User who created the service |
| Creation Time | Time when the service was created |
| Modifier | User who modified the service information |
| Modified Date | Date when service information was modified |
| Cluster Name | Server cluster name composed of servers |
| Storage Class | Storage class used by the selected cluster |
| Description | Additional information or description about Data Ops |
| Domain Setting | Data Ops Domain Name |
| Node Selector | Node Label |
| Web Url | Data Ops URL |
| Account | Data Ops Manager account |
| Host Alias | Host information to be connected to Data Ops |
| Fig. Data Ops detailed information tab items |
Tag
On the Data Ops list page, you can check the tag information of the selected resource, and add, change, or delete it.
| Classification | Detailed Description |
|---|---|
| Tag list | Tag list
|
Fig. Data Ops tags tab items
Work History
You can check the work history of the selected resource on the Data Ops list page.
| Classification | Detailed Description |
|---|---|
| Work history list | Resource change history
|
Fig. Data Ops job history tab detailed information items
Cancel Data Ops
You can cancel unused Data Ops to reduce operating costs. However, if you cancel the service, the operating service may be stopped immediately, so you should consider the impact of stopping the service sufficiently before proceeding with the cancellation work.
To cancel Data Ops, follow the procedure below.
- Click All Services > Data Analytics > Data Ops menu. It moves to the Service Home page of Data Ops.
- On the Service Home page, click the Data Ops menu. It moves to the Data Ops list page.
- Data Ops list page, select the resource to be canceled and click the Service Cancellation button.
- Once the cancellation is complete, please check if the resource has been cancelled on the Data Ops list page.
Notice
Data Ops cannot be deleted until you delete the connected Data Ops Services.
5.2.1 - Data Ops Services
Users can enter essential information for Data Ops Services within the Data Ops service and create the service by selecting detailed options through the Samsung Cloud Platform Console.
Create Data Ops Services
The user can add a service by selecting detailed options for Data Ops or entering setting values.
Notice
When applying for Data Ops Services, the scale of resources should be secured to be more than the available capacity of the K8s cluster.
To create Data Ops Services, follow the procedure below.
Click on the menu for all services > Data Analytics > Data Ops. It moves to the Service Home page of Data Ops.
On the Service Home page, click Data Ops Services. It moves to the Data Ops Services list page.
On the Data Ops Services list page, click the Create Data Ops Services button. It moves to the Create Data Ops Services page.
Data Ops Services Creation page, enter the information required for service creation and select detailed options.
Enter Service Information area, enter or select the required information.
Division NecessityDetailed Description Data Ops Name Required Data Ops Selection Ops Service Name Required Enter Data Ops Services name - Start with lowercase English letters and do not end with a special character (
-), use lowercase letters, numbers, and special characters (-) to input 3 ~ 30 characters
Storage Class Required Select the storage class used by the chosen cluster Description Optional Enter additional information or description about Data Ops Services within 150 characters Domain setting Mandatory Enter Data Ops Services domain - Start with lowercase English letters and do not end with a special character (
-), use lowercase letters, numbers, and special characters (-) to input 3 ~ 50 characters
- {Data Ops Services name}.{set domain} will be the Data Ops Services access address.
Node Selector Required To install on a specific node, enter a distinguishable label from the node’s labels - If the node label is entered incorrectly, an installation error may occur, so check the node label in advance
- Node labels can be checked in the yaml file of the corresponding node
Service Workload Required - Web Server: Provides visualization of DAG components and status, and Airflow configuration management module
- Scheduler: Manages scheduling and execution of various DAGs and tasks for orchestration
- Worker: Performs actual orchestration and data processing tasks
- Worker(Kubernetes): Dynamically creates and runs pods when worker conditions are met, allowing for efficient resource usage. The Replica text box is disabled when Kubernetes is selected.
- Worker(Celery): Creates and maintains static pods when worker conditions are met, allowing for faster performance with large requests. The Replica text box is enabled and user input is allowed when Celery is selected.
- The type of executor chosen cannot be changed once selected
Account Required Enter Airflow account - ID: Starts with lowercase English letters and uses lowercase letters and numbers to enter a value between 6 and 30 characters
- Password: Includes uppercase (English), lowercase (English), numbers, and special characters (
!@#$%^&*) and enters 8 to 50 characters
- Password Confirmation: Enter the password again
Table. Data Ops Services service information input items - Start with lowercase English letters and do not end with a special character (
Enter Additional Information area, enter or select the required information.
Classification NecessityDetailed Description Host Alias Selection Add host information to be connected to Data Ops (up to 20 can be created, including default) - Select “Use” and click the + button
- Hostname: Enter in hostname or domain format, using lowercase letters, numbers, and special characters (
-) with 3 ~ 63 characters
- IP: Enter in IP format
- To delete, click the X button
- The firewall between the cluster and the server must be open to use the added host information
Tag Selection Tag addition - Tag addition button to create and add tags or add existing tags possible
- Up to 50 tags can be added
- Newly added tags are applied after service creation is complete
Fig. Additional Data Ops information input items
In the Summary panel, review the detailed information and estimated charges, then click the Complete button.
- Once creation is complete, check the created resource on the Data Ops Services list page.
Data Ops Services detailed information check
You can check and modify the full list of Data Ops Services resources and detailed information. The Data Ops Services details page consists of details, tags, and work history tabs.
To check the details of Data Ops Services, follow the next procedure.
- Click on the menu for all services > Data Analytics > Data Ops. It moves to the Service Home page of Data Ops.
- On the Service Home page, click the Data Ops Services menu. It moves to the Data Ops Services list page.
- Data Ops Services list page, click on the resource to check the detailed information. It moves to the Data Ops Services details page.
- Data Ops Services Details page top shows status information and additional features.
| Classification | Detailed Description |
|---|---|
| Status Indicator | Data Ops Services status
|
| Hosts file setting information | Button to check and copy host file information to access Data Ops Services |
| Data Ops Services deletion | button to cancel the service |
Fig. Data Ops Services Status Information and Additional Features
Detailed Information
On the Data Ops Services list page, you can check the detailed information of the selected resource and modify the information if necessary.
| Classification | Detailed Description |
|---|---|
| Service | Service Category |
| Resource Type | Service Name |
| SRN | Unique resource ID in Samsung Cloud Platform
|
| Resource Name | Resource Name
|
| Resource ID | Unique resource ID in the service |
| Creator | User who created the service |
| Creation Time | Time when the service was created |
| Modifier | User who modified the service information |
| Revision Time | The time when service information was revised |
| Data Ops Name | Data Ops Full Name |
| Storage Class | Storage class used by the selected cluster |
| Description | Additional information or description about Data Ops Services |
| Domain Setting | Data Ops Services domain name |
| Node Selector | Node Label |
| Web Url | Data Ops Services URL |
| Account | Airflow Account |
| Host Alias | Host information to be connected to Data Ops Services |
| Fig. Data Ops Services detailed information tab items |
Tag
On the Data Ops Services list page, you can check the tag information of the selected resource and add, change, or delete it.
| Classification | Detailed Description |
|---|---|
| Tag list | Tag list
|
Fig. Data Ops Services tags tab items
Work History
You can check the operation history of the selected resource on the Data Ops Services list page.
| Classification | Detailed Description |
|---|---|
| Work history list | Resource change history
|
| Fig. Data Ops Services job history tab detailed information items |
Data Ops Services cancellation
You can cancel unused Data Ops Services to reduce operating costs. However, when canceling a service, the operating service may be stopped immediately, so you should consider the impact of stopping the service sufficiently before proceeding with the cancellation work.
To cancel Data Ops Services, follow the procedure below.
- Click on the menu for all services > Data Analytics > Data Ops. It moves to the Service Home page of Data Ops.
- On the Service Home page, click the Data Ops Services menu. It moves to the Data Ops Services list page.
- Data Ops Services list page, select the resource to be canceled and click the Data Ops Services delete button.
- Once the cancellation is complete, please check if the resource has been cancelled on the Data Ops Services list page.
5.2.2 - Installing Ingress Controller
The user must install the Ingress Controller before creating the Data Ops service. Only one Ingress Controller can be installed in a Kubernetes cluster.
Install Ingress Controller using Container Registry
To install Ingress Controller using Container Registry, follow the procedure below.
For detailed Container Registry creation methods, please refer to the Container > Container Registry > How-to guides guide.
- Prepare the SCR (Samsung Container Registry) to store the Ingress Controller image.
- Push the Ingress Controller image to SCR(Samsung Container Registry).
- Download the YAML file used for installation from Ingress GitHub and modify the following items.
Color mode
kind: Deployment
...
spec:
  template:
    spec:
      containers:
image: {SCR private endpoint}.{repository name}.{image name}:{tag}kind: Deployment
...
spec:
template:
spec:
containers:
image: {SCR private endpoint}.{repository name}.{image name}:{tag}Color mode
kind: ConfigMap
...
metadata:
  labels:
    app: ingress-controller

kind: Service
...
metadata:
  labels:
    app: ingress-controller

kind: Deployment
...
metadata:
  labels:
    app: ingress-controller

kind: IngressClass
...
metadata:
  labels:
app: ingress-controllerkind: ConfigMap
...
metadata:
labels:
app: ingress-controller
kind: Service
...
metadata:
labels:
app: ingress-controller
kind: Deployment
...
metadata:
labels:
app: ingress-controller
kind: IngressClass
...
metadata:
labels:
app: ingress-controller- You can install the Ingress Controller using the Create Object button in the Workloads > Deployments list in Kubernetes Engine using the modified YAML file.
Reference
For detailed object creation methods, please refer to Container > Kubernetes Engine > Creating Deployments.
5.3 - API Reference
API Reference
5.4 - CLI Reference
CLI Reference
5.5 - Release Note
Data Ops
2025.04.28
NEW
Data Ops Service Official Version Release- A workflow can be created and job scheduling automated for periodic or repetitive data processing tasks with the release of the Data Ops service.
- It is a managed workflow orchestration service based on Apache Airflow.
6 - Quick Query
6.1 - Overview
Service Overview
Quick Query is an interactive query service that allows you to analyze large amounts of data quickly and easily using standard SQL. It is automatically installed on a standard Kubernetes cluster and provides easy and fast access to various data sources such as Cloud Hadoop, Object Storage, and RDB, enabling data retrieval and processing.
Key Features
- Easy and Fast Data Retrieval: After defining a schema for data stored in Object Storage, you can easily and quickly retrieve data using standard SQL. Any user who can handle SQL can easily analyze large datasets without being a professional analyst.
- Rapid Parallel Distributed Processing: Using the Trino engine, which supports parallel distributed processing, queries are automatically divided and processed in parallel on multiple nodes, allowing you to quickly retrieve query results even for large amounts of data.
- Various Service Structures: It provides a shared fixed resource mode, a shared resource expansion mode, and a personal resource expansion mode. The shared fixed resource mode supports a stable response speed for large data queries, while the shared resource expansion mode allows for more affordable use in cases of irregular usage. Additionally, the personal resource expansion mode supports each user’s independent analysis work, enabling the use of Quick Query with a structure that meets user demands.
Service Composition Diagram
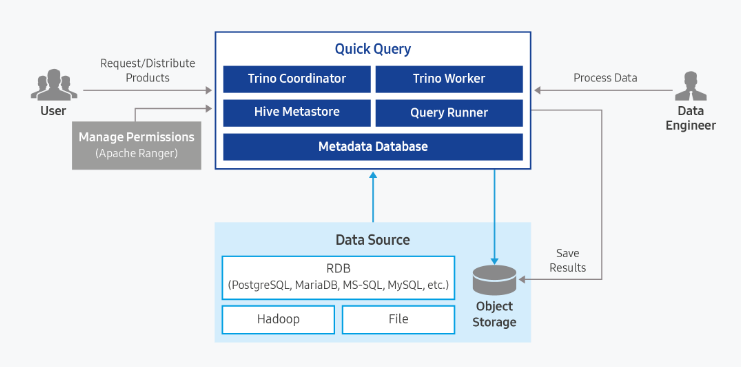
Provided Functions
Quick Query provides the following functions:
- Single Access Support for Various Data Sources (Supporting 11 Data Sources)
- Automatic Storage Function for Result Data in Object Storage
- Reuse Function for Query Results
- Access Control Function through Ranger Integration
- Data Usage Control Function
| Category | Type | Note |
|---|---|---|
| Cloud Hadoop | hive_on_cloud_hadoop iceberg_on_cloud_hadoop | Using Cloud Hadoop’s Hive Metastore |
| Object Storage | hive_on_object_storage iceberg_on_object_storage | Deploying Hive Metastore in Quick Query |
| RDB | postgresql mariadb sqlserver oracle mysql | JDBC Driver Upload required (licensed) |
| TPCDS | tpcds | Built-in Data Source provided by Quick Query |
| TPCH | tpch | Built-in Data Source provided by Quick Query |
Table. Supported Data Sources
| Type | select | insert | update | delete | create | drop | alter | analyze | call |
|---|---|---|---|---|---|---|---|---|---|
| hive_on_cloud_hadoop | O | O | O | O | O | O | O | O | O |
| iceberg_on_cloud_hadoop | O | O | O | O | O | O | O | O | O |
| hive_on_object_storage | O | O | O | O | O | O | O | O | O |
| iceberg_on_object_storage | O | O | O | O | O | O | O | O | O |
| postgresql | O | O | O | O | O | O | |||
| mariadb | O | O | O | O | O | O | |||
| sqlserver | O | O | O | O | O | O | |||
| greenplum | O | O | O | O | O | O | |||
| oracle | O | O | O | O | O | O | |||
| mysql | O | O | O | O | O | O | |||
| tpcds | O | ||||||||
| tpch | O |
Table. Supported SQL
Components
Query Engine Type: Shared
The query engine is a structure that is shared by multiple users when one is running.
Fixed Resource Mode (No Auto Scaling): When Auto Scaling is not used, the query engine runs with fixed resources according to the user’s selection. Since the query engine always runs with the same resources, it can guarantee consistent query performance.
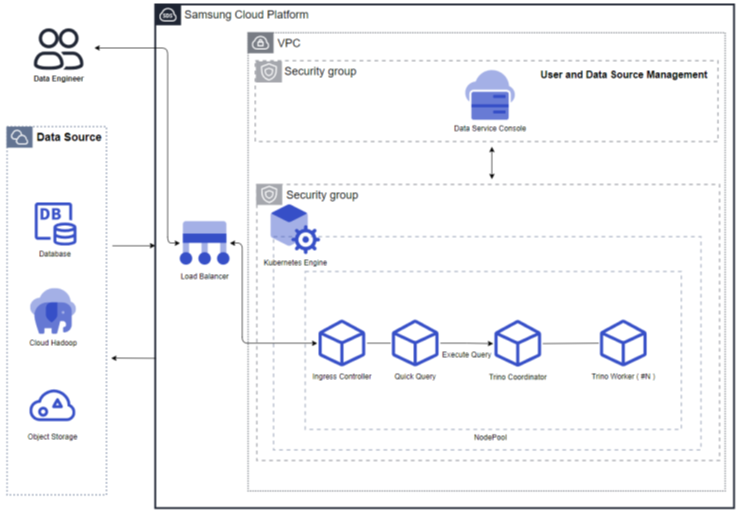
Figure. Fixed Resource Mode (No Auto Scaling) Resource Expansion Mode (Using Auto Scaling): When Auto Scaling is used, the query engine’s worker nodes automatically scale in/out according to the processing volume. When the processing volume is low, the worker nodes decrease to one, and when the processing volume increases, the worker nodes increase. Additionally, resources can be adjusted according to the cluster size.
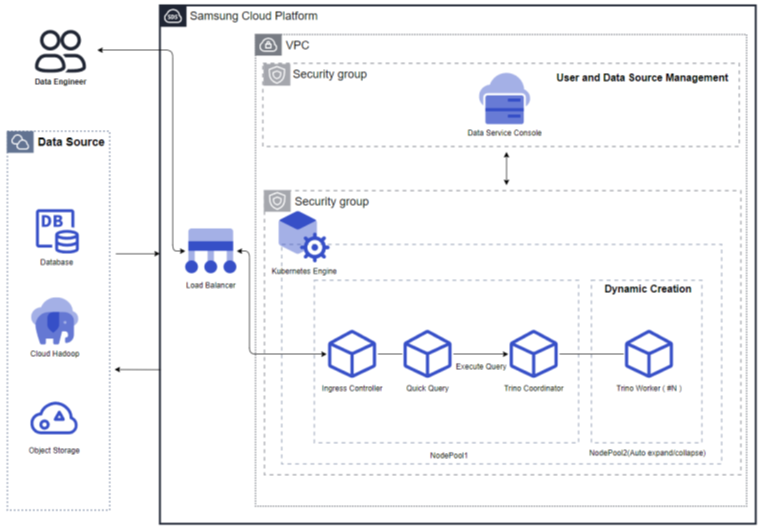
Figure. Resource Expansion Mode (Using Auto Scaling)
Query Engine Type: Personal
Resource Expansion Mode (Using Auto Scaling): The personal query engine type is a structure where the query engine runs separately for each user. Each query engine supports Auto Scale in/out and automatically stops when not used for an extended period. When used again, the query engine automatically restarts. The worker nodes decrease to one when the processing volume is low and increase when the processing volume increases. Additionally, resources can be adjusted according to the cluster size.
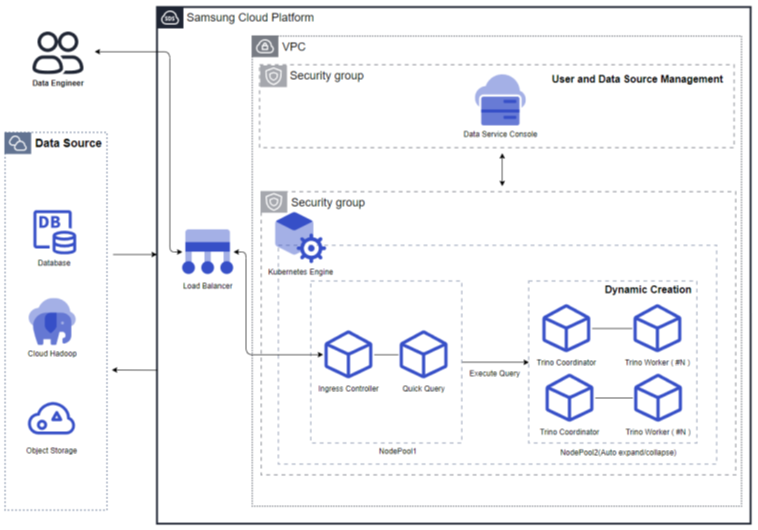
Figure. Resource Expansion Mode (Using Auto Scaling)
Server Type
The server types supported by Quick Query are as follows:
| Classification | Example | Detailed Description |
|---|---|---|
| Server Type | Standard | Provided server types
|
| Server Size | s1v2m4 | Provided server specifications
|
Table. Quick Query Supported Server Types
The minimum specifications required to use Quick Query are as follows:
| Classification | Details | Cluster Size (User Input Value) | Fixed Node Pool | Auto-Scaling Node Pool |
|---|---|---|---|---|
| Shared | Fixed Resource Mode (No Auto Scaling) | Replica: 1 CPU: 4 Core Memory: 8GB | 8 Core, 16GB * 4 | N/A |
| Shared | Resource Expansion Mode (Using Auto Scaling) | Small(1 Core, 4GB) | 8 Core, 16GB * 3 | 8 Core, 16GB * 1 |
| Personal | Resource Expansion Mode (Using Auto Scaling) | Small(1 Core, 4GB) | 8 Core, 16GB * 3 | 8 Core, 32GB * 2 |
Table. Quick Query Minimum Specifications
Region-Based Provisioning Status
Quick Query is available in the following environments:
| Region | Availability |
|---|---|
| Korea West (kr-west1) | Available |
| Korea East (kr-east1) | Available |
| Korea South 1 (kr-south1) | Not Available |
| Korea South 2 (kr-south2) | Not Available |
| Korea South 3 (kr-south3) | Not Available |
Table. Quick Query Region-Based Provisioning Status
Preceding Services
The following services must be configured before creating Quick Query. Please refer to the guides provided for each service to prepare them in advance.
| Service Category | Service | Detailed Description |
|---|---|---|
| Networking | VPC | A service that provides an independent virtual network in a cloud environment |
| Networking | Security Group | A virtual firewall that controls server traffic |
| Storage | File Storage | A storage that allows multiple client servers to share files through network connections |
Table. Quick Query Preceding Services
6.2 - How-to guides
Users can create Quick Query services by entering the required information and selecting detailed options through the Samsung Cloud Platform Console.
Creating Quick Query
You can create Quick Query services through the Samsung Cloud Platform Console.
To create Quick Query, follow these steps:
Click All Services > Data Analytics > Quick Query. This will take you to the Service Home page of Quick Query.
On the Service Home page, click the Create Quick Query button. This will take you to the Create Quick Query page.
On the Create Quick Query page, enter the required information and select the detailed options.
- In the Version Selection section, select the required information.
Category RequiredDescription Quick Query Required Select the Quick Query service version - Provides a list of available versions
Table. Quick Query Service Version Selection Items - In the Service Information Input section, enter or select the required information.
Category RequiredDescription Quick Query Name Required Enter the Quick Query name - Starts with a lowercase letter and does not end with a special character (-), uses lowercase letters, numbers, and special characters (-) to enter 3-30 characters
Description Optional Enter additional information or description of Quick Query within 150 characters Domain Setting Required Enter the Quick Query domain - Starts with a lowercase letter and does not end with special characters (-, .), uses lowercase letters, numbers, and special characters (-, .) to enter 3-50 characters
- {Quick Query Name}.{Set Domain} will be the Quick Query access address.
Query Engine Type Required Select the query engine type - Shared: Multiple users share a single query engine
- Dedicated: Each user has a separate engine
Cluster Size Required Select the resource capacity for cluster configuration - If the engine type is Shared,
- Auto Scaling can be selected to choose the cluster capacity (Small, Medium, Large, Extra Large).
- If Auto Scaling is not selected, the cluster capacity can be set by entering Replica, CPU, and Memory.
- If the engine type is Dedicated,
- the cluster capacity can be selected (Small, Medium, Large, Extra Large).
- Engine capacity (when using Auto Scaling)
- Small: 1Core, 4GB
- Medium: 4Core, 16GB
- Large: 8Core, 64GB
- Extra Large: 16Core, 128GB
- Engine capacity (when not using Auto Scaling)
- Replica: 1-9 input possible, default: 1
- CPU: 4-24 input possible (4, 6, 8, 10, 12, 14, 16, 18, 20, 22, 24 input possible), default: 4
- Memory: 8-256 input possible (8, 16, 32, 64, 128, 192, 256 input possible), default: 8
Maximum Concurrent Query Execution Required Select the maximum number of queries to execute concurrently in Quick Query - Available values: 32, 64, 96, 128
Data Service Console Connection Required Enter the Data Service Console domain - Starts with a lowercase letter and does not end with special characters (-, .), uses lowercase letters, numbers, and special characters (-, .) to enter 3-50 characters
Host Alias Optional Add host information to be connected to Quick Query (up to 20 can be created, including the default) - Use is selected, and the + button is clicked
- Hostname: Hostname or domain format, using lowercase letters, numbers, and special characters (-, .) to enter 3-63 characters
- IP: IP format input
- To delete, click the X button
- The firewall between the cluster and the corresponding server must be open to use the added host information
Table. Quick Query Service Information Input Items - In the Cluster Information Input section, enter or select the required information.
Category RequiredDescription Cluster Name Required Enter the cluster name - Starts with a lowercase letter and does not end with a special character (-), uses lowercase letters, numbers, and special characters (-) to enter 3-30 characters
Control Area Setting Required/Optional - Kubernetes Version: Displays the Kubernetes version
- The Kubernetes version can be upgraded after provisioning.
- Public Endpoint Access: To access the Kubernetes API server endpoint from outside, select Use and enter the Access Control IP Range (cannot be changed after service application).
- Control Area Logging: Select whether to use control area logging
- If Use is selected, the cluster control area’s Audit/event log can be checked in Management > Cloud Monitoring > Log Analysis.
- 1GB of log storage is provided free of charge for all services in the project, and logs exceeding 1GB will be deleted sequentially.
Network Setting Required Set the network connection - VPC: Use the same VPC as Data Service Console
- Subnet: Select a subnet from the selected VPC
- Security Group: Click Search and select a security group in the Security Group Selection popup window
File Storage Setting Required Select the file storage volume to be used by the cluster - Default Volume (NFS): Click Search and select a file storage in the File Storage Selection popup window
Table. Quick Query Service Cluster Information Input Items - Enter Node Pool Information area, enter or select the required information.
Classification RequiredDetailed Description Node Pool Configuration Required/Optional Enter detailed information about the node pool to be added - * marked items are required input items
- If the Query Engine Type is Public and Auto Scaling is set to Not Used, only the Node Pool Configuration (Fixed) item can be set.
- Keypair: Select the authentication method to use when connecting to the Virtual Server
Table. Quick Query Service Node Pool Information Input Items - * marked items are required input items
- Enter Additional Information area, enter or select the required information.
Classification RequiredDetailed Description Tags Optional Add tags - Tag Add button to create and add tags or add existing tags
- Up to 50 tags can be added
- Newly added tags are applied after service creation is complete
Table. Quick Query Service Additional Information Input Items
- In the Version Selection section, select the required information.
In the Summary panel, check the detailed information created and the estimated billing amount, and click the Complete button.
- After creation is complete, check the created resource in the Quick Query List page.
Check Quick Query Details
You can check the entire resource list and detailed information of the Quick Query service and modify it. The Quick Query Details page consists of Details, Tags, and Work History tabs.
To check the detailed information of the Quick Query service, follow these steps:
- Click All Services > Data Analytics > Quick Query menu. Move to the Quick Query Service Home page.
- Click the Quick Query menu on the Service Home page. Move to the Quick Query List page.
- Click the resource to check the detailed information on the Quick Query List page. Move to the Quick Query Details page.
- At the top of the Quick Query Details page, status information and additional feature information are displayed.
Classification Detailed Description Status Display Status of the Quick Query created by the user - Creating: Creating
- Running: Creation complete, service available
- Updating: Setting update in progress
- Terminating: Service termination in progress
- Error: Error occurred during creation or service abnormal state
Hosts File Setting Information Button to check and copy host file information for accessing Quick Query and Data Service Console Service Termination Button to terminate the service Table. Quick Query Status Information and Additional Features
- At the top of the Quick Query Details page, status information and additional feature information are displayed.
Details
You can check the detailed information of the resource selected on the Quick Query List page and modify it if necessary.
| Classification | Detailed Description |
|---|---|
| Service | Service name |
| Resource Type | Resource type |
| SRN | Unique resource ID in Samsung Cloud Platform
|
| Resource Name | Resource name
|
| Resource ID | Unique resource ID in the service |
| Creator | User who created the service |
| Creation Time | Time when the service was created |
| Modifier | User who modified the service information |
| Modification Time | Time when the service information was modified |
| Quick Query Name | Quick Query name |
| Description | Additional information or description of Quick Query |
| Version | Quick Query version |
| Service Type | Quick Query service type |
| Query Engine Type | Quick Query engine type |
| Engine Spec |
|
| Maximum Concurrent Query Execution | Maximum number of queries that can be executed concurrently in Quick Query |
| Domain Setting | Quick Query domain |
| Data Service Console | Data Service Console domain |
| Host Alias | Host information to be connected to Quick Query |
| Web URL | Web URL of Data Service Console and Quick Query |
| Cluster Name | Name of the cluster composed of servers |
| Installation Node Information | Detailed information of the installed node pool |
Table. Quick Query Details Tab Items
Tags
You can check the tag information of the resource selected on the Quick Query List page and add, change, or delete it.
| Classification | Detailed Description |
|---|---|
| Tag List | Tag list
|
Table. Quick Query Tag Tab Items
Work History
You can check the work history of the resource selected on the Quick Query List page.
| Classification | Detailed Description |
|---|---|
| Work History List | Resource change history
|
Table. Quick Query Work History Tab Detailed Information Items
Connecting to Quick Query
To connect to Quick Query, follow these steps:
- Check the IP of the Windows system (PC) that you want to connect to Quick Query.
- You need to check the public IP of the system since external access is required.
- Check if the IGW connection is set to use in the VPC where Quick Query is installed.
- The Internet Gateway setting must be enabled for external access.
- Add the following contents to the hosts file of the Windows system:
- Domain address of Data Service Console
- Domain address of Data Service Console IAM
- Domain address of Quick Query
- You can check the hosts file setting information by clicking Hosts file setting information in the Quick Query detailed screen.
- Add the following rules to the VPC IGW Firewall that you selected when applying for the Quick Query service:
- Source IP: IP of the Windows system (PC)
- Destination IP: Subnet range of the Kubernetes where Quick Query is installed
- Protocol: TCP
- Port: 443
- Add the following rules to the Load Balancer Firewall that you selected when applying for the Quick Query service:
- Source IP: IP of the Windows system (PC)
- Destination IP: Subnet range of the Kubernetes where Quick Query is installed
- Protocol: TCP
- Port: 443
- Add the following rules to the Security Group that you selected when applying for the Quick Query service:
- Type: Inbound rule
- Destination address: IP of the Windows system (PC)
- Protocol: TCP
- Port: 443, 30000 ~ 32767
- Run the Chrome browser on the Windows system (PC) that you want to connect to and access the Quick Query URL.
Quick Query Target IP/Port Information
To access Quick Query, add the target IP and port for each service to the Security Group as follows:
| Item | Protocol | Source | Target IP | Port | Note |
|---|---|---|---|---|---|
| Quick Query | TCP | User IP | Quick Query | 443, 30000 ~ 32767 | Quick Query web https |
Table. Quick Query Target IP/Port Information
Canceling Quick Query
You can cancel the service to reduce operating costs. However, canceling the service may immediately stop the operating service, so you should carefully consider the impact of service cancellation before proceeding.
To cancel Quick Query, follow these steps:
- Click the All Services > Data Analytics > Quick Query menu. You will be taken to the Service Home page of Quick Query.
- Click the Quick Query menu on the Service Home page. You will be taken to the Quick Query List page.
- On the Quick Query List page, select the resource you want to cancel and click the Cancel Service button.
- After cancellation is complete, check if the resource has been canceled on the Quick Query List page.
6.3 - API Reference
API Reference
6.4 - CLI Reference
CLI Reference