Impact Analytics and Goal of
Business Impact Analysis (Business Impact Analysis)
To develop a disaster recovery strategy, a Business Impact Analysis (BIA) must be performed. Through BIA, we assess the importance of key business processes and the potential losses that may occur if they are interrupted, and set the priority and scope of recovery.
- Work structuring Group each individual task into groups to structure and analyze the overall work. By analyzing the parent and child task structures, you can understand the entire organization’s workflow as shown in the figure below.
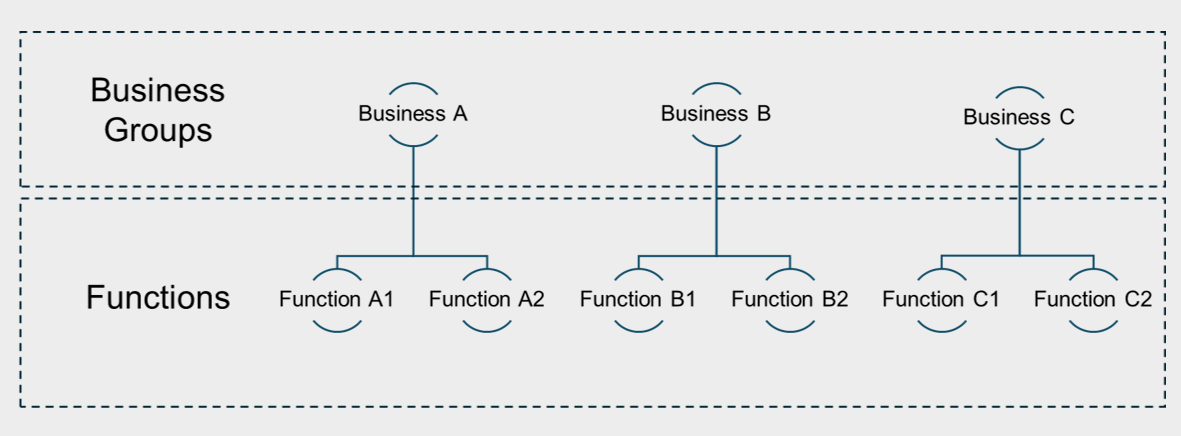
Key Task Identification After structuring and analyzing the work, select the frequently used tasks among the derived work processes as the target for business impact analysis. The impact analysis of tasks is performed by considering whether the work is directly linked to core services targeting customers and whether it is important from the organization’s strategic perspective.
Task Relevance Analysis The importance of a task is determined not only by its own significance but also by its relevance to other tasks. The relationship between tasks can be classified as a precedence where one task is performed before another, a sequential order where it is performed after, or simply a reference relationship. The table below is a diagram that analyzes the relationships between tasks based on precedence and reference relationships.
| follow-up work❷ \ preceding work❶ | A1 | A2 | B1 | B2 | C1 | C2 | Correlation |
|---|---|---|---|---|---|---|---|
| A1 | - | ● | ● | 2 | |||
| A2 | ● | - | 1 | ||||
| B1 | - | 0 | |||||
| B2 | ● | - | 1 | ||||
| C1 | ● | - | 1 | ||||
| C2 | ● | - | 1 | ||||
| Correlation | 1 | 1 | 2 | 1 | 1 | 0 | - |
● Related
❶ Preceding task: a task that must be completed before the row’s task is performed
❷ Follow-up tasks: tasks that must be handled after the row’s work is performed
- Disaster Impact Assessment Measure the potential disaster types, the losses associated with each type, and the duration of impact for the implemented service. Disaster types include hardware errors, software errors, human mistakes, natural disasters, fire, and network interruptions. The table below shows the results of a quantitative and qualitative analysis of losses caused by disasters.
| Category | Impact item | Cascading impact | |
|---|---|---|---|
| quantitative | Financial impact |
|
|
| quantitative | Business impact |
|
|
| Qualitative | type |
|
|
| Qualitative | Intangible |
|
|
- Define business importance priority and scope of recovery target tasks Based on the results of quantitative/qualitative analysis and task relevance analysis, we derive the priority order of task importance. An example of defining task priority is as follows.
| Priority | Work |
|---|---|
| first priority | A1 |
| second priority | B1, C1 |
| 3rd rank | A2, B2, C2 |
However, even if you estimate the impact and set priorities, normal recovery does not necessarily follow those priorities. For proper recovery, the results of the previously performed business correlation analysis must be incorporated. For example, in the task dependency analysis example in the table above, B1, B2, and C1 must be restored before A1 can be restored. If this correlation is reflected in the recovery priority, the recovery order will be adjusted as shown in the table below.
| Priority | Work | Reflect business relevance |
|---|---|---|
| first priority | A1 | A1, B1, B2 |
| second priority | B1, C1 | C1 |
| 3rd place | A2, B2, C2 | A2, C2 |
Establish Recovery Objectives
After conducting a Business Impact Analysis (BIA), you must select the business groups for outage and disaster recovery and set disaster recovery objectives. For disaster recovery of the target task, two metrics are used: allowable downtime and acceptable loss point.
Allowed Work Interruption Time It is defined as the Recovery Time Objective (RTO), meaning the maximum allowable time to restore a service when it is interrupted due to a disaster.
Allowed Downtime Point It uses the Recovery Point Objective (RPO) as a metric, meaning the acceptable amount of data loss when restoring a service that was interrupted by a disaster.
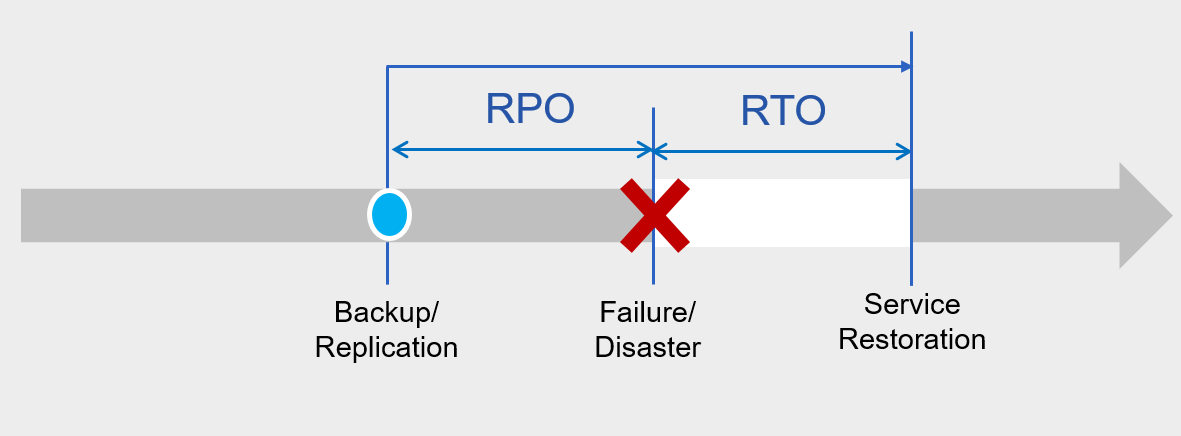
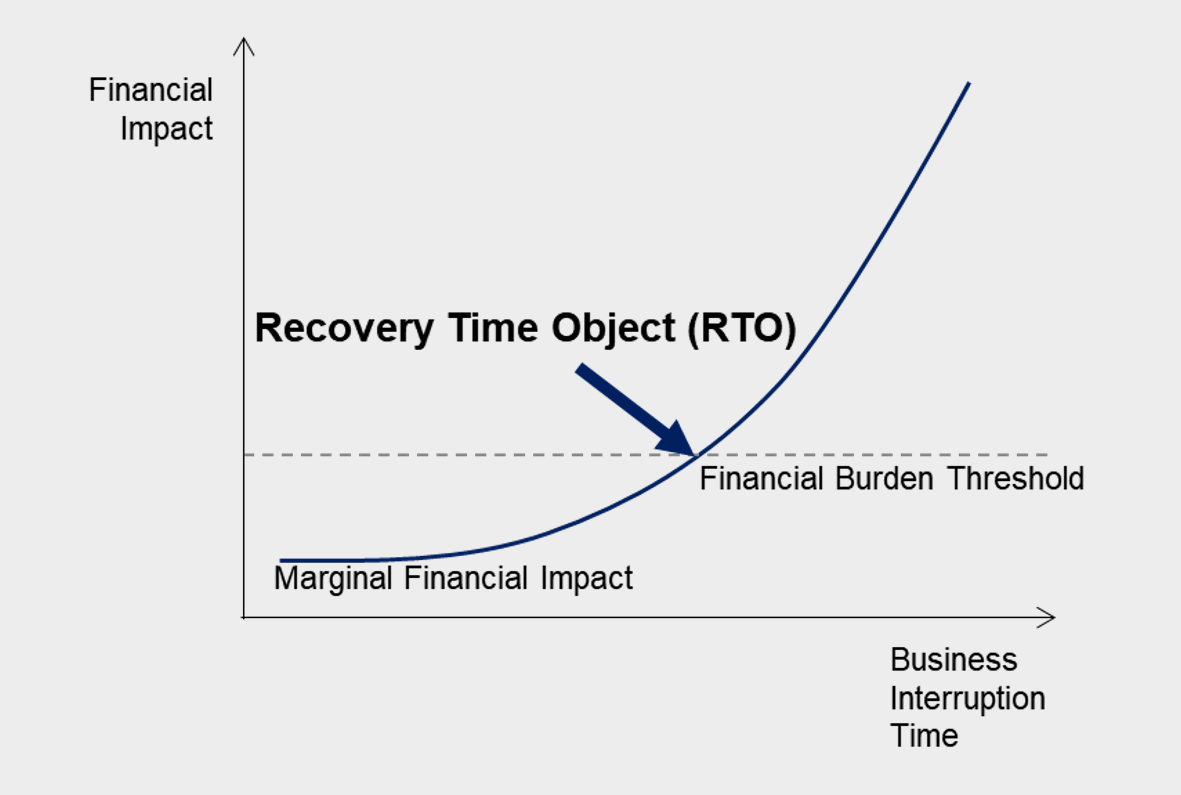
When setting RTO and RPO targets, the organization must review the acceptable downtime and the extent of data loss. The top-level goal of RTO is uninterrupted recovery during failures or disasters, and the allowable downtime must be near zero (Near Zero). However, achieving these goals requires significant cost investment and operational burden. If an information system plays a critical role within the organization, or if the investment required for recovery does not impose a significant financial burden, a higher level of recovery objectives can be set. Additionally, as shown in the table below, the higher the financial burden an organization can bear, the shorter the RTO can be.
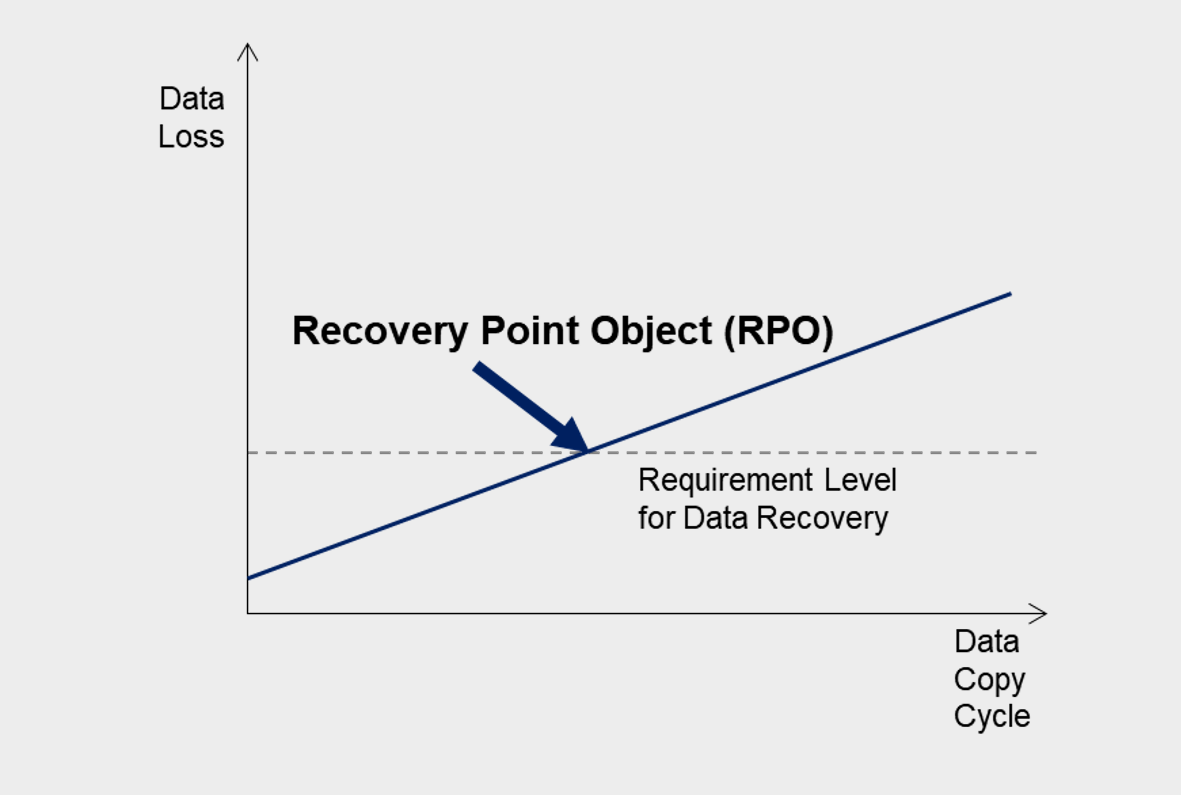
The target level for RPO is set based on the point in time up to which data loss can be tolerated. When a failure or disaster occurs, some data loss is inevitable. You can determine whether to recover data at a specific point in time based on the data copy retention frequency and the presence of data replication, according to the importance of the task.
An information system consists of various IT resources and interfaces, and typically performs multiple tasks simultaneously. Identify the relationships with other related information systems. Additionally, we also analyze the operating organization of the information system and the organizations that use the services provided by that system.
The table below is an example that defines RTO and RPO based on the relationship between business processes and information systems. For example, in the case of system F that handles task A2, the RTO is 8 hours, and task A2 takes 1 day. We derive the RTO for the relevant system and business as the minimum value of 8 hours. Similarly, set the RPO to the minimum value of 1 hour.
| System \ Work | A1 | A2 | B1 | B2 | C1 | C2 | System-specific RTO | RPO by system |
|---|---|---|---|---|---|---|---|---|
| D system | ● | ● | 1 hour | real-time | ||||
| E system | ● | 4 hours | 30 minutes | |||||
| F system | ● | 8 hours | 1 hour | |||||
| G system | ● | ● | ● | 4 hours | 1 hour | |||
| RTO by task | 1 hour | 1 day | 3 days | 6 hours | 2 days | Day 1 | ||
| Task-specific RPO | real-time | Day 1 | Day 1 | 1 hour | Day 1 | Day 1 |