Design for Performance Efficiency
Design for Performance Efficiency
One of the common analogies used to describe system performance is the flow of water through a pipe.
If you compare the flow of water to performance, the amount flowing is determined by the speed of the water and the thickness of the pipe.
The system’s performance is similar to this. The speed of water corresponds to response time, and the thickness of the pipe corresponds to the number of tasks that can be processed simultaneously.
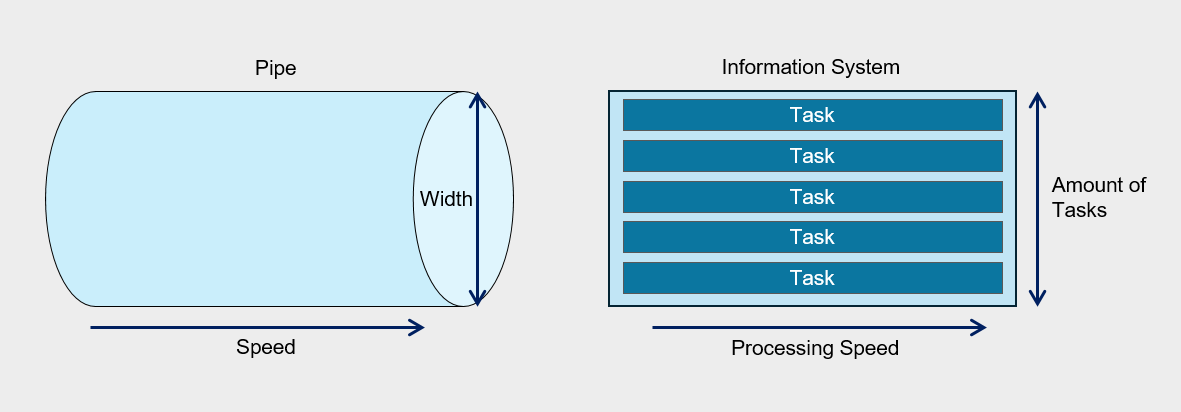
If what flows through the pipe is not water but sticky oil, even when using a pipe of the same diameter, the amount that flows in the same amount of time will differ.
Similarly, in information systems, the processing speed can vary depending on the nature of the tasks being processed, and consequently, performance inevitably varies as well.
Therefore, the required performance level can vary depending on the user’s characteristics and environment, and even with the same performance, satisfaction may differ among users.
This means that there is no standard that can be uniformly applied to all systems and users.
Considering these points, ‘performance’ can be defined as follows.
Performance means the amount of work that can be processed within the expected time for a user’s request targeting a specific task.
In the existing IT environment, the focus was on maximizing throughput within limited physical resources for performance management, and the work of optimizing each component of the information system was central.
However, recent IT environments focus on efficiently meeting increasing service demand and technical requirements by utilizing application infrastructure and resources based on cloud technology rather than partial optimization.
Considerations for Performance Efficiency
Consider cost and performance trade-offs
If you pre-deploy resources or over-provision to meet performance requirements, unexpected costs may arise.
Also, if you adopt an over-provisioning strategy, when demand surges and exceeds the limits of the pre-provisioned resources, resource adjustments become necessary in the problem response stage.
When reflecting a demand-based resource adjustment strategy in architecture design, you can implement elasticity that flexibly adjusts the size of workload components, which contributes to improving the performance efficiency of cloud workloads.
Auto-Scaling is an effective means to horizontally scale up/down computing resources according to demand, but if the scaling policy is not configured properly, unnecessary scaling may occur, or it may fail to provide sufficient performance at the required time.
If you analyze the demand load and establish policies that match its characteristics, you can reduce cost waste and secure the necessary computing performance.
A sophisticated design is also needed when implementing a caching strategy.
Caching is a technology to provide frequently used content with low latency, but if the content is not frequently used or the caching retention period (Time-To-Live, TTL) is not suitable for the use case, unnecessary costs may be incurred or latency improvement may not be achieved.
- Configure the Auto-Scaling policy to match user demand.
- Improve performance efficiency through proper caching implementation.
Select a cloud service that meets the requirements
Select an appropriate cloud service according to the workload’s performance goals and future capacity requirements.
Select a service that can meet the performance goals of the requirements. Samsung Cloud Platform provides various computing options such as Virtual Machine, Bare Metal, Serverless Computing. For example, when you need to build a database that requires high-availability, high-performance OLTP, instead of building the database on a Virtual Server or using a DBaaS service, you can configure database servers in a redundant setup on two Bare Metal Servers and choose to connect Block Storage (BM) using a Multi-Attach method.
Meets regulatory compliance and restriction requirements. The cloud offers various services, but selection may be limited due to specific regulations or restriction requirements. For example, even if you want to use DBaaS from a performance and operational standpoint, if there is a compliance requirement to apply a specific encryption module that DBaaS does not support when storing data, using the service may be difficult.
Consider organizational capabilities.
Microservice Architecture can be a strategy that maximizes efficiency in terms of performance and operations, but to implement it, the organization’s technical capabilities, processes, and culture must support it. Attempting technological innovation when unprepared increases the likelihood of failure.
Overall Service Flow Design Considering Performance
Flow (flow) refers to a series of processes that perform a specific task within a workload.
The user’s request event is generated, the message that processes it is delivered to the server, and the series of steps that handle the response and reply can be called a flow.
To optimize the performance of an information system, it is important to understand all flows. By analyzing the workload in individual flow units, you can discover bottlenecks and inefficiencies in resource usage.
To this end, we apply analysis and tracking tools to each component, set performance metrics, and collect data for a certain period.
Based on the data collected in this way, we identify important trends and select them as priority targets for performance improvement.
Important flows refer to system and data flows that are either the customer’s primary user flows or correspond to core tasks in the workload.
Like the business impact analysis covered in the reliability design principles (for more details see Reliability Design Principles > I. Business Impact Analysis and Recovery Goal Definition > 1. Business Impact Analysis (BUSINESS IMPACT ANALYSIS)), we evaluate business impact, identify critical flows, and analyze performance metrics to establish improvement goals.
For identified critical flows, we provide dedicated resources and sufficient capacity to ensure a stable computing environment.
Dedicated resource configuration for important flow
The important flow must be configured to operate independently without interference from other processes, and for this, a separate VPC or subnet can be used.Flow isolation at the software level
VM(Virtual Machines) or separate the flow by container units to minimize interference from other flows.Securing dedicated resources and capacity
Important flows minimize resource sharing and allocate dedicated resources or capacity to ensure stable execution.
The following is an example of a problem that occurred in an important flow.
A company operates a high-availability three-tier website architecture for online recruitment.
However, the HR team is experiencing a problem where application submissions are not smooth due to a sudden increase in traffic at certain times.
During the hiring season, tens of thousands of applicants flock, but in the off-season, system load is significantly lower.
In an on-premises environment, you have to purchase additional equipment to handle this load, but after the hiring season, that equipment becomes idle, leading to increased management burden and reduced cost efficiency.
These problems can be solved through a cloud environment.

Implemented Auto-Scaling for the workloads of the main flows, ❶Web Server and ❷Application Server, and implemented DBaaS high availability for the ❸database.
In contrast, the non-primary flow ❹Bastion Server and ❺Standalone Application server are configured as standalone servers.
Cloud Performance Improvement Area
Latency
Latency refers to the time it takes to transmit data over a network.
If the distance between the end user and the information system is short and the system’s response speed is fast, the latency is short. Conversely, if the distance is long or the response speed is slow, the latency is long.
If network latency becomes longer, Application performance degrades, and if it increases beyond a certain level, it may lead to system failure.
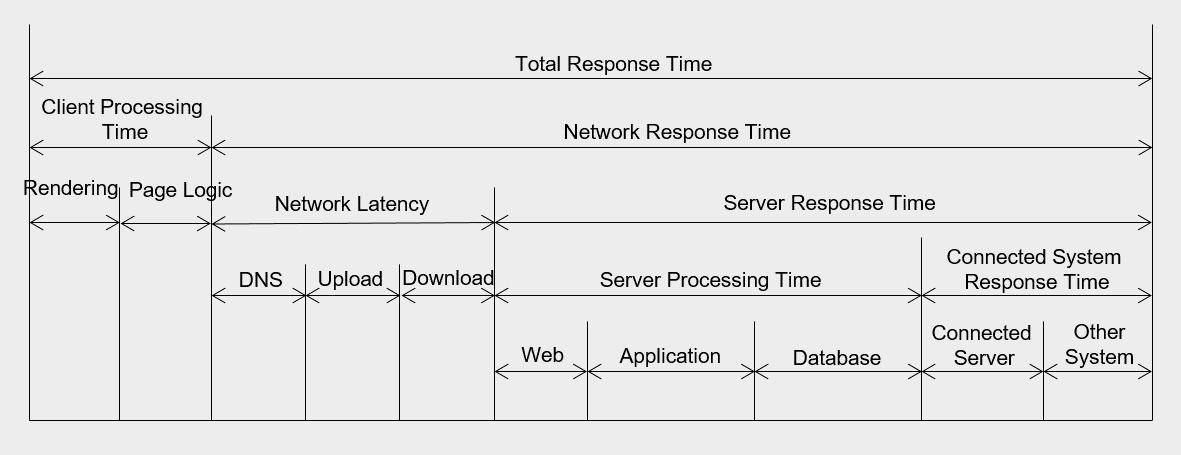
Network latency occurs due to various factors.
First, a delay may occur due to network lines and relay equipment such as routers between the request location and the receiving location.
The routers that data packets pass through from source to destination are called hops, and the more hops there are, the higher the latency.
Also, delays can occur within the data center due to boundary protection devices such as firewalls and internal network equipment.
Delays can also occur due to the operating mechanisms within the server farm between web, application, and database, or within the server itself.
Additionally, delays may occur even when the application must respond in coordination with another server.
The most basic way to reduce latency is to reduce the network distance between the client and the server.
There is a method of placing the server in a region geographically close to the client, or configuring a CDN to handle responses directly on edge servers.
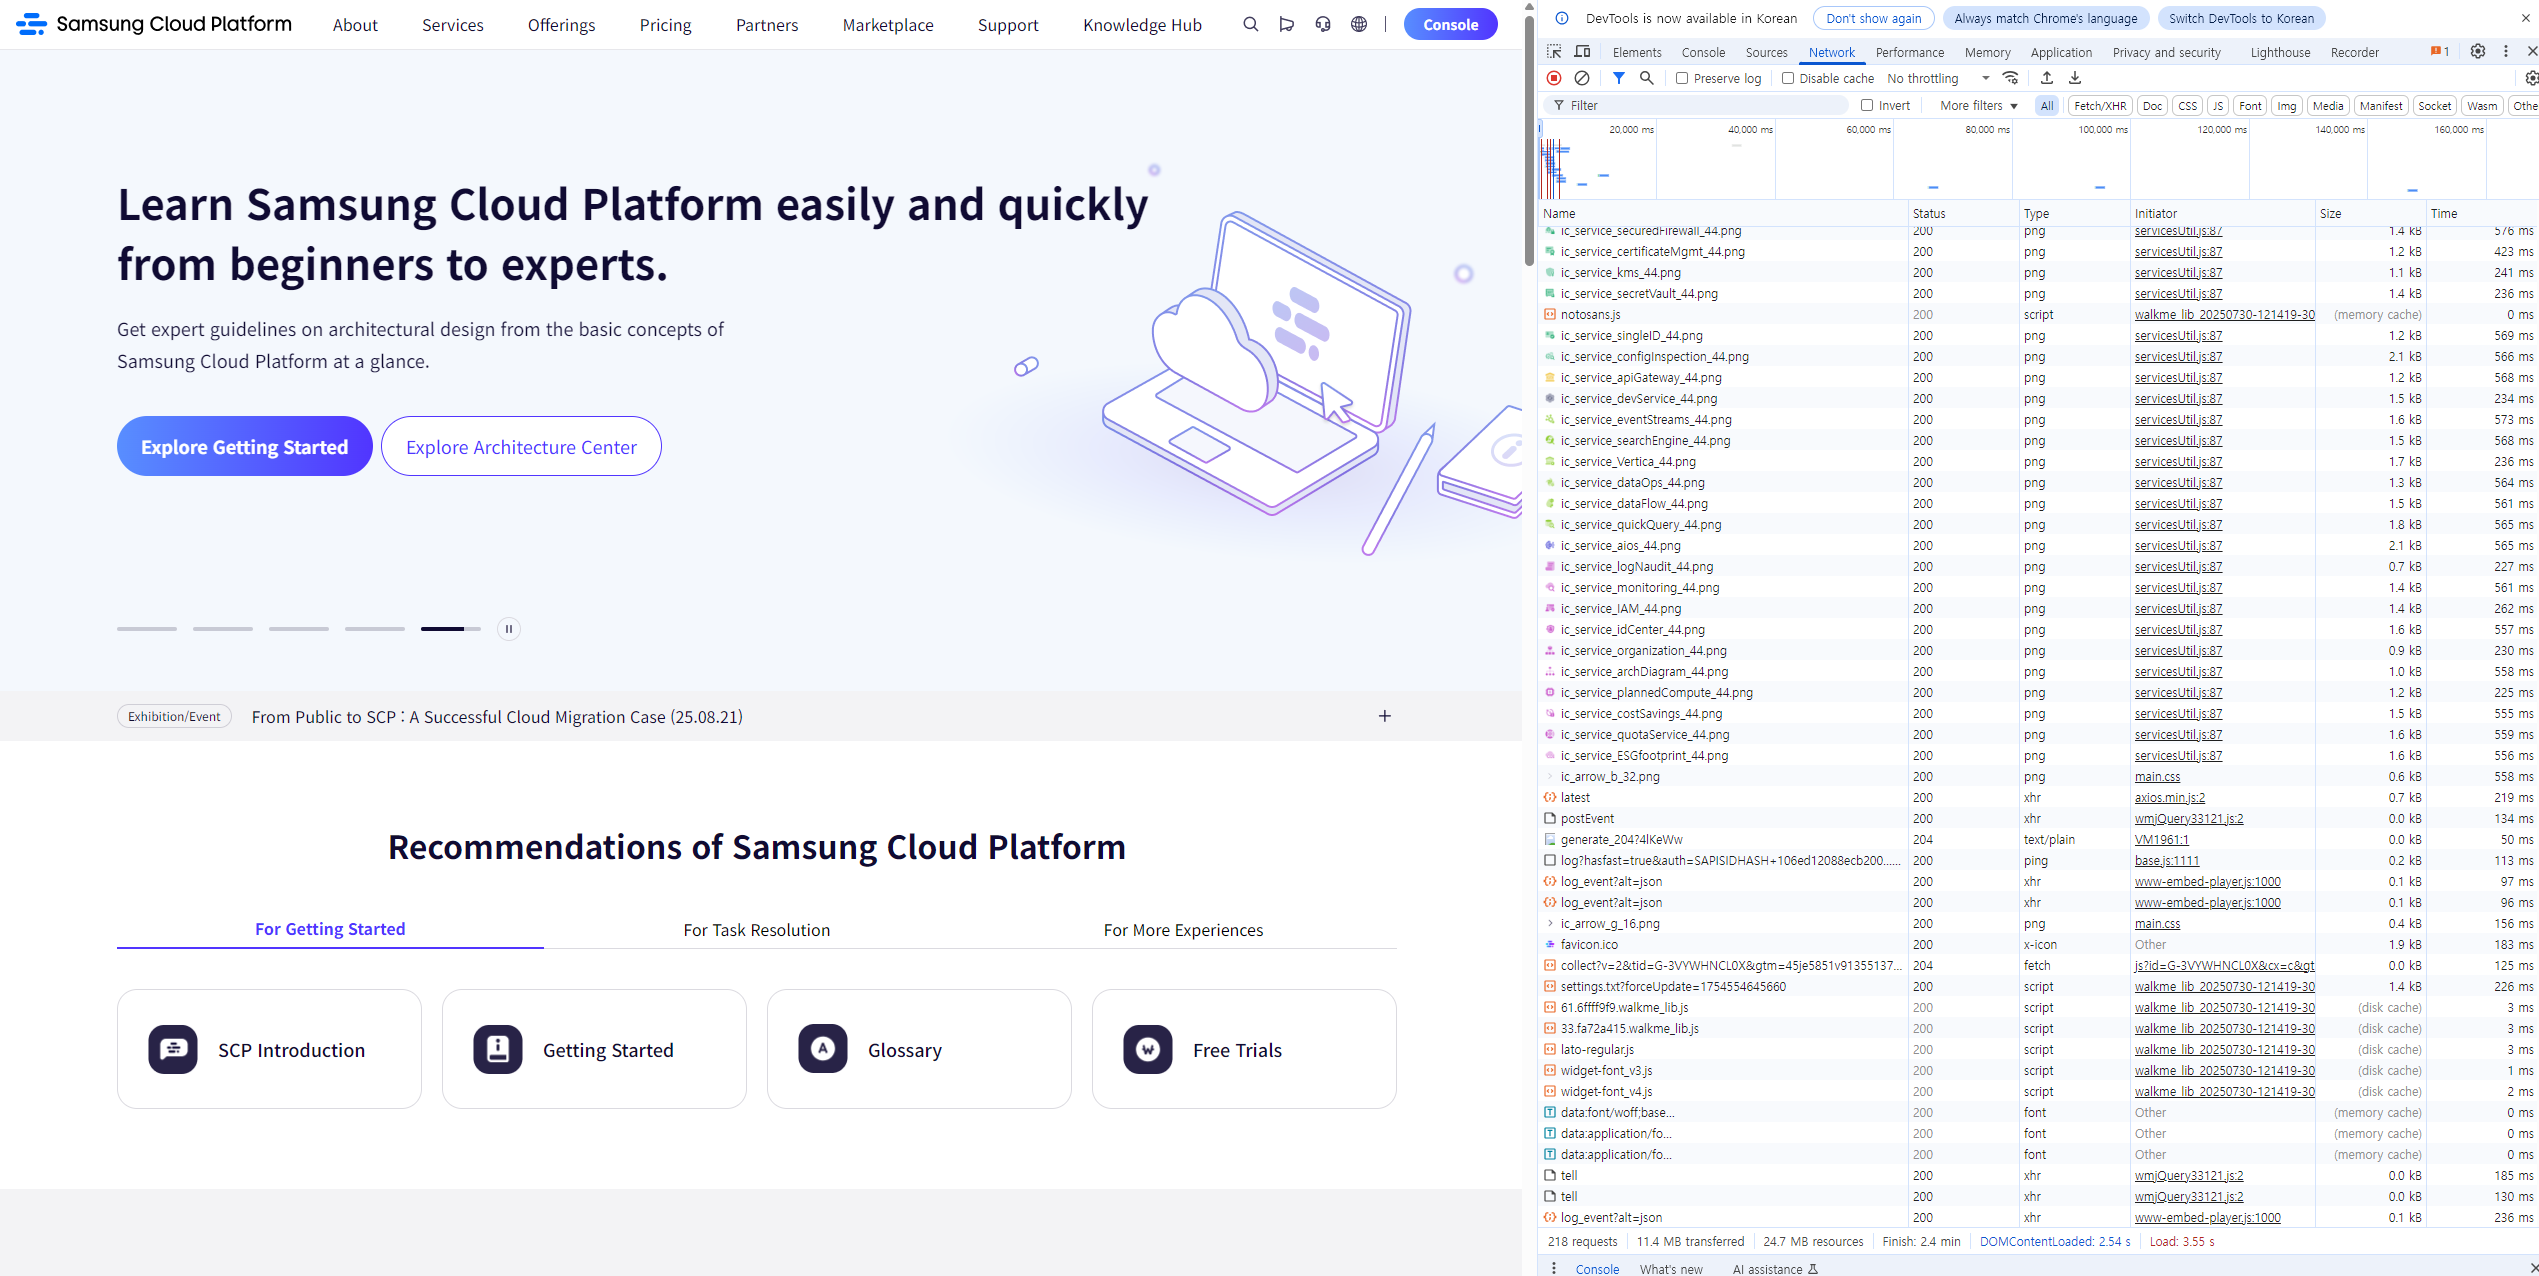
The following figure shows the inbound traffic latency of a website with various content.
The fewer network hops, the latency on the far right decreases.
Throughput(Throughput)
Design that reduces the distance between user and server to shorten latency, and increasing network throughput is also one of the ways to improve network performance.
Throughput means the amount of work processed per unit time.
Throughput and latency are closely related.
Being able to transmit more data in a short time means that latency is low and throughput is high.
Network throughput is expressed as the amount of data transmitted per second (Bytes/second or bits/second).
At the operating system level, throughput is determined by the amount of data transferred per second between the CPU and memory. In the database field, it is expressed as the number of transactions that can be processed per second (operations/second or Transactions/second).
When defining performance requirements, the demand for throughput is expressed as the number of concurrent users and concurrent throughput, which is further covered in II. Computing Design > 1. Computing Services, Server Types and Sizing.
The following are measures that can be considered to increase throughput.
Transmission Server Expansion You can increase the overall service throughput by placing computing nodes that perform the same tasks in parallel on a load balancer.
Transmission method change If you implement the Application connection as an API-based method rather than a session-based method, you can increase resource utilization.
Hybrid connection configuration
If Direct Connect is required, you can review hybrid connections and select an appropriate bandwidth.
Capacity Planning
Capacity planning is a process of making decisions about resource capacity by considering future workload demands and usage patterns.
Predict usage changes according to business schedules such as seasonal changes or new product launches, and reflect them in capacity planning.
These proactive response strategies can prevent service interruptions and improve performance efficiency.
By analyzing past usage trends and growth data, we can predict short- and long-term capacity requirements, identify bottlenecks and Auto-Scaling issues in advance, and ensure consistent workload performance.
Analyzes data accumulated over a long period.
By analyzing usage rates, performance data, and workload pattern logs accumulated for over a year, we identify seasonal and periodic demand and reflect the load during demand spikes in capacity planning.Identify bottlenecks. We set up a test environment separate from the production environment, generate load to measure and improve bottlenecks, thereby enhancing overall performance.
Implement automatic expansion. Configure an automated expansion method instead of manual expansion.
Set schedule-based Auto-Scaling, or use the managed services of cloud services to leverage built-in capacity scaling.
Define, Measure, and Improve Performance Goals
Define performance goals, measurement, and improvement process establishment
Performance requirements are the core elements required to provide optimized information system services to users, and to ensure stable operation and maintenance.
It specifically describes how quickly and efficiently the system can process when performing its functions.
Also, performance requirements describe the required time, throughput, maximum resource usage, etc., when performing a function under specific conditions.
The reason performance requirements are important is because they have a great impact on the system quality perceived by the end user.
System processing speed, screen response time, page errors and downtime can be critical sources of dissatisfaction in service level management.
Therefore, these items must be specified in the request for proposal, and when building the system, they must meet performance targets in conjunction with equipment performance testing.
The items of performance requirements are as follows, and specific performance goals are established for each item.
| Category | Item | Requirement Item | Example |
|---|---|---|---|
| General Performance | General Performance | General Performance | - Performance analysis tool - Test plan |
| Processing speed and time performance requirements | Response time | Online task response time | The first result must be responded within 3 seconds from the user request |
| Processing Speed and Time Performance Requirements | Response Time | Online Batch Work Response Time | The result must be responded within 3 minutes for online batch work requests |
| Processing speed and time performance requirements | Response time | Batch job response time | Daily batch jobs must be processed within 10 minutes |
| Processing Speed and Time Performance Requirements | Response Time | Web Page Display Time | Each web page must be displayed within a few seconds |
| Processing speed and time performance requirements | Response time | Error response time | Messages for all errors must be presented within 3 seconds after information entry |
| Throughput Requirements | Number of Concurrent Users | Number of Simultaneous User Connections | Should support an average of 200 or more concurrent users without performance degradation |
| Throughput Requirements | Concurrent Processing Capability | Concurrent Processing Capability | The system must process 50 user basic information entry operations per second under maximum load conditions. |
| Resource Usage Requirements | CPU Utilization | CPU Utilization | The average CPU utilization during service availability time must not exceed 60% |
| Resource Usage Requirements | Memory Utilization | Memory Utilization | The average memory utilization during service availability time must not exceed 60% |
In existing information systems, the USE methodology was used as a performance measurement methodology, but recently, as cloud-native application development has spread, the RED methodology is also being used.
USE Methodology (The USE Method)
Using the methodology proposed by Brendan Gregg, it is used to analyze system bottlenecks in the early stages of performance review.
The USE methodology can be defined as follows.
“Check utilization, saturation, and errors for all resources.”
The definitions of each term are as shown in the table below.
| Term | Definition | Example |
|---|---|---|
| Resource (Resource) | All physical server components | CPU, Disk, Memory, Network, etc. |
| Utilization (Usage Rate) | The proportion of time that resources are used to perform tasks over a specific period | The disk usage rate is 90%. |
| Saturation (Saturation) | Additional work that resources could not process | The average CPU execution queue length is 4. |
| Errors (Error) | Number of errors occurred | 50 late collisions occurred on this network interface. |
The procedure of the USE methodology is as follows.
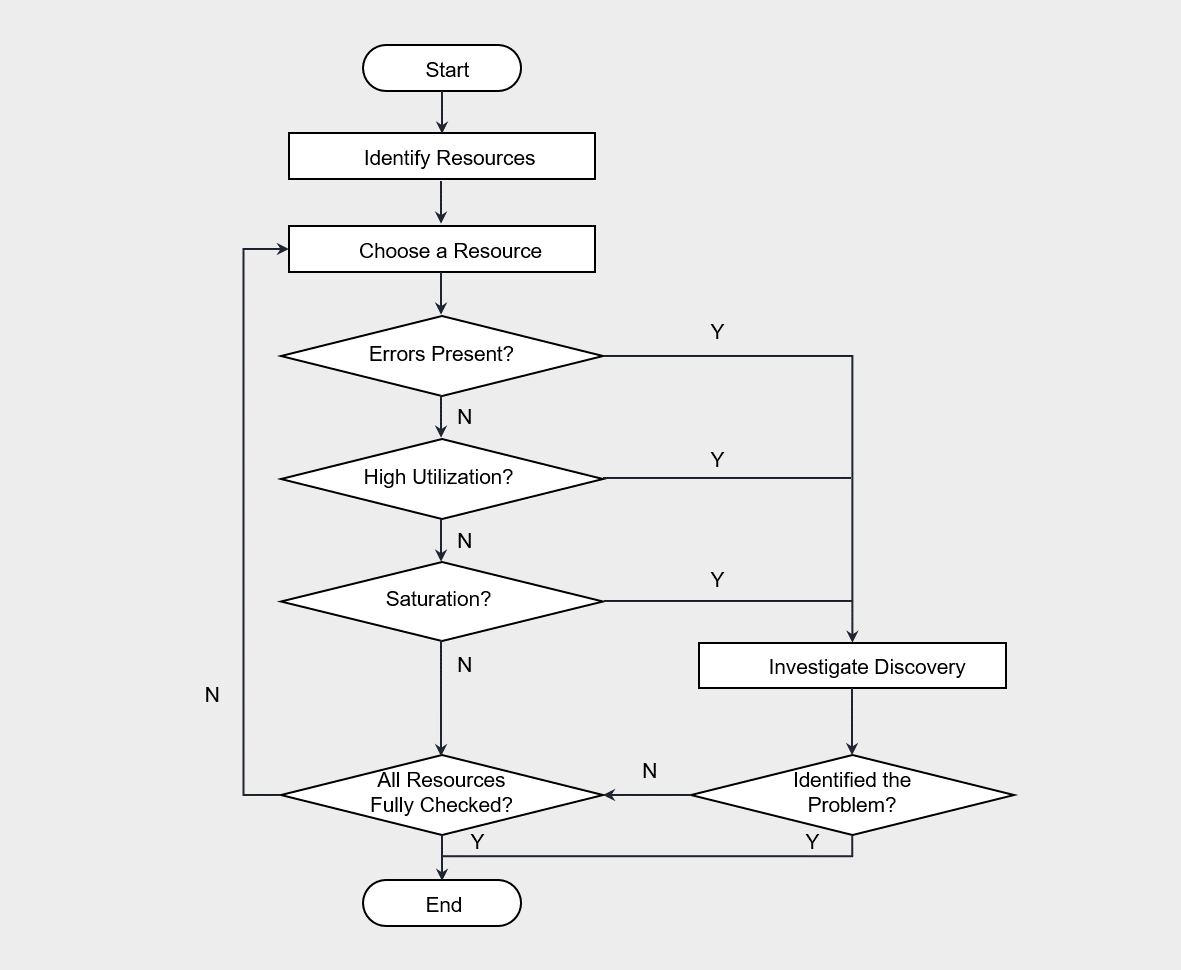
The USE methodology is performed by first checking for errors according to the flow of the flowchart, and then sequentially verifying usage rate and saturation.
Generally, errors can be intuitively identified, so checking for errors first and then analyzing the remaining items is effective for saving time.
For example, if the CPU usage is 100%, that point is likely a bottleneck.
When checking these indicators, you should also consider the update cycle of the indicators.
Cloud Monitoring’s minimum metric update interval is 1 minute, and it checks whether the VM’s 100% utilization occurs continuously or temporarily.
The USE methodology can be applied mechanically without deep understanding of software, and it has been usefully utilized in both on-premises and cloud environments.
In this methodology, physical hardware resources are primarily monitored, and software corresponds to basic resources commonly used in most systems.
Therefore, it does not depend on software logic and can be applied regardless of which software is used.
However, there are limitations in applying the Microservice architecture that partitions physical resources.
In such cases, it is appropriate to use the RED methodology.
RED Methodology (The RED Method)
Tom Wilkie is the method proposed for performance analysis in a Microservice environment.(The RED Method: How to Instrument Your Services | Grafana Labs)
“Monitor the rate (processing rate), errors (number of errors), and duration (processing time) for all services.”
The metrics of the RED methodology are all composed of items based on requests.
The definitions of each term are as follows.
| Term | Definition | Example |
|---|---|---|
| Rate (request count) | requests per second | Disk usage is 90%. |
| Errors (Error) | Number of failed requests | The average CPU execution queue length is 4. |
| Duration (Processing Time) | Request processing time | 50 late collisions occurred on this network interface. |
If the USE methodology is hardware metric‑centric, the RED methodology focuses on service‑request‑centric metrics.
In a Microservice environment, the RED methodology is useful when analyzing response delays or errors of a web Application.
The RED methodology can also be applied easily without dismantling or analyzing the internal structure of hardware or software.
However, because Cloud Monitoring cannot collect RED metrics, using tools such as Prometheus is effective.
Continuous Optimization and Improvement
Continuous performance optimization refers to a series of processes that involve monitoring and analyzing system performance, and continuously carrying out improvement activities.
The goal of performance efficiency is to adjust resources according to demand fluctuations, in order to provide responses within the time expected by the user.
The performance of an information system can degrade over time.
Therefore, various variables inside and outside the system, such as demand fluctuations, increased functionality and interfaces, and the resulting complexity, must be considered.
To achieve performance efficiency goals even amid continuous change, the following optimization and improvement strategies are required.
- Review and apply new cloud technologies.
- Specify the improvement priority.
- Automate performance optimization.
Review and apply new cloud technologies.
Cloud providers continuously introduce new technologies to infrastructure and software platforms. Therefore, these technologies must be regularly reviewed and applied. If technical support or updates for the previous version of the platform are discontinued, it can have a negative impact not only on performance but also on security and availability.Specify improvement priority. As time passes, technologies that were optimized at the time of implementation may become inefficient. For example, a specific query may have been used as an important flow in the database, but due to trend changes, another query can become important. Initially, you may have achieved performance goals by optimizing resources and queries according to a specific flow. However, as trends change, if the newly load-concentrated queries and resource plans are not optimized, it can lead to overall performance degradation. In such cases, it is necessary to adjust priorities and change query and resource capacity planning.
Automate performance optimization. Automation can eliminate repetitive and time‑consuming manual processes, reducing the possibility of errors and ensuring consistency. To this end, we apply automation to tasks such as performance testing, deployment, and monitoring. Even when applying the USE methodology or the RED methodology, you must set threshold values for the performance indicators to be monitored and configure it so that an automatic alert is sent to the administrator immediately when a specific event occurs. Also, in case of an emergency event, we establish a prior plan so that we can respond quickly through automated scripts.