Operation Design
Operation Design
Resource Management and Optimization
Cloud Resource Management
Cloud resource management optimization is redefined as a continuous activity that goes beyond mere technical capacity management to maximize cost efficiency relative to business performance.
Pay-as-you-go cloud models can lead to unnecessary cost waste if management is neglected, so a strategic approach that combines technical capabilities with financial operations (FinOps) is required.
It is important to consider elastic design from the initial design stage so that applications and infrastructure can respond flexibly to changes in demand, and to reduce unnecessary resource allocation and improve cost efficiency.
Elastic design provides flexibility by fully utilizing the scalability of cloud environments, allowing resources to be quickly increased or decreased as needed.
Continuous optimization is a core element of cloud operations, identifying resource usage patterns through ongoing monitoring and analysis, and improving inefficient parts.
To this end, we use automated tools and processes to monitor resource usage in real time, reduce unnecessary costs, and optimize resource allocation through data-driven decision making.
FinOps emphasizes the financial aspects of cloud resource management and achieves business goals through cost management and budget control.
Manage cloud costs transparently, create maximum value relative to cost, utilize resources efficiently, operate within budget, and minimize unnecessary spending.
Through this, we maintain the organization’s financial soundness and strengthen cost management and financial responsibility in the cloud environment. (※ FinOps is covered in more detail in the Cost Optimization Principles.)
This approach contributes to efficiently managing cloud resources, maximizing cost efficiency, and improving business performance.
Cloud Resource Management
Most cloud providers, including Samsung Cloud Platform, set capacity limits on resources.
These restrictions appear as limits on the use of specific resources such as storage capacity and the number of services that can be created, and are measures to prevent any particular customer or project from monopolizing resources.
When designing cloud architecture, you need to consider the following items and check the limited capacity.
Identify the project’s capacity requirements in advance to prevent unexpected resource consumption limits.
Establish an automatic resource scaling plan considering the possibility of load spikes.
The limit capacity is regularly reviewed to keep it up to date.
You can check the service quota in the Samsung Cloud Platform console (Console > Management > Quota Service).
Some services may request an increase in the provided capacity. Review the limited capacity before resource deployment, and if capacity adjustment is possible, proceed with the request in advance.
Average Usage Trend Analysis and Capacity Adjustment
Unlike on-premises environments, in cloud environments the cloud provider directly handles the management of physical equipment and facilities.
As a result, users can reduce the time required for equipment purchase and installation, and have conditions that allow them to focus on service construction and utilization.
If you use the cloud, you don’t need to prepare or maintain unnecessary idle resources in advance, and you can flexibly respond by creating or scaling virtual machines (VM) up or down as needed.
Because it is a pay-as-you-use structure, you can optimize costs by including only the excess capacity needed during peak traffic times.
However, in such an environment, it is very important to efficiently manage resource usage because you can instantly create and use the required capacity.
To this end, a procedure for analyzing the trend of average usage must necessarily be included.
To start this analysis, you must first identify the major cloud workloads.
To assess the average and peak utilization of the workload, as well as current and future capacity requirements, you must have a thorough understanding of the workflow and planning processes of the department that uses the workload.
Also, analyzing past load patterns is necessary.
For example, you can derive patterns by using data such as the highest usage over the past three months, the highest usage by time of day, and the highest usage per minute.
Cloud Monitoring can be used to analyze the following load patterns.
Average and maximum usage rate
Rapid change in usage patterns
(Due to changes in business situation) a surge in a specific period
If a load surge event is planned in advance, it is advisable to review over-provisioning ahead of time to smoothly handle increased traffic.
Additionally, if resource usage approaches the limit capacity, a procedure is also required to verify that it is set to automatically send a notification to the operator.
Cloud Resource Optimization
Cloud resource optimization is a continuous habit and process for operational excellence, a strategy that increases cost efficiency, maintains service performance, and maximizes the advantages of the cloud environment.
To this end, we need to approach from various aspects such as computing, storage, idle resource management, and cost model optimization.
Computing optimization is not just relying on average CPU utilization, but a process of selecting the optimal instance type for the workload type by using statistically significant metrics.
For example, we reduce unnecessary costs and efficiently utilize resources by using metrics such as a P95 CPU usage below 30% over the past 14 days.
(※ P95 CPU usage refers to the ‘95th percentile’ in CPU performance testing or monitoring, which is an indicator representing the performance of the slowest 5% of the total CPU usage data, measuring the system’s ‘stability under maximum load.’ It shows how much actual user response time or system load rises when the CPU is operating at its maximum (near 100% utilization), and while a P95 in the 80–90% range can be normal, values close to 100% may indicate bottlenecks or overload.)
Idle resource management is the process of identifying and eliminating resources that are not used and only incur costs.
Unattached Disks/Volumes, Old Snapshots/Images, etc., are deleted through regular checks by establishing a policy to reduce costs.
Finally, cost model optimization is a strategy that discounts the bill itself through financial optimization (FinOps) after technical optimization.
Combine various purchase options such as immediate use when needed, contract plans, and bulk resource discounts to reduce costs.
By continuously monitoring and improving these strategies, you can increase cost efficiency through cloud resource optimization, maintain service performance, and fully leverage the advantages of the cloud environment.
Automation Process Design
IT operations have the characteristic of needing to actively adapt to the rapid technological changes in hardware and software provided by various vendors.
Many organizations are building hybrid cloud or multi-cloud systems, and cases of simultaneously operating on-premises and cloud environments are gradually increasing.
In recently developed systems, technologies such as Microservice are run together, and a structure where millions of devices connect to these services via the Internet is becoming generalized.
In such a complex environment, IT operators must perform multiple tasks simultaneously, so handling all tasks manually is realistically difficult.
Because the responsibility for continuously operating the service and quickly restoring it when an event occurs is assigned to the operations team, it is essential to have a pre-prepared response system.
Rather than responding after a failure occurs, it can be said that an approach that predicts the possibility of failure in advance and prepares proactively is more effective.
For stable and rapid operation, it is desirable to automate processes, and the operational areas where automation can be implemented can be identified through the following table.
| Area | Description |
|---|---|
| Pipeline definition, execution and management | Automate CI/CD pipeline and execution using DevOps Service. |
| Deployment | Automate infrastructure deployment and updates using IaC (Infrastructure as Code) tools such as Terraform. |
| Test | In the DevOps Service pipeline, you can automate testing using SonarQube to reduce workload. |
| Scaling | Auto-Scaling or Kubernetes Engine Node Pool auto-scaling is used to automatically adjust the size of the infrastructure when load increases or decreases. |
| Monitoring and Alerts | Configure Cloud Monitoring to register threshold-based events so that an alert is triggered when a metric exceeds the threshold range. |
To maximize cloud-based operational efficiency, it is necessary to implement container-based automation at the infrastructure level, and to configure a pipeline for coding, building, integration, release, and deployment stages at the application level.
A representative process that promotes the implementation of such automation is DevOps, which is a methodology that helps continuously deliver products or services through collaboration between development and operations teams.
DevOps aims for a structure where development and operations teams collaborate, share responsibilities, and exchange continuous feedback throughout the entire development lifecycle, from building to deploying the application.
In such DevOps environments, the following tools and automation elements are utilized.
Code-based infrastructure management
centralized code repository
CI/CD(continuous integration and continuous deployment) pipeline
First, we will look at the code type infrastructure.
Code Type Infrastructure Provisioning and Management
The operations team can greatly improve work efficiency by utilizing automation technology.
Especially, by using a code-based infrastructure (Infrastructure as Code, IaC) approach, you can automate tasks such as launching new servers or starting/stopping services, reduce repetitive infrastructure management work, and invest more time in strategic planning.
When deploying and managing IaC, declarative tools are evaluated as more suitable for the operational environment than imperative tools.
Declarative tools specify the deployment completed state in the definition file and operate in a way that tries to maintain that state.
Even if a failure occurs during deployment, the system automatically performs repeated actions to achieve the declared state, and even if changes occur due to a fault, it automatically performs actions to restore the original state.
Thanks to these characteristics, operator intervention is reduced and stable infrastructure operation becomes possible.
On the other hand, because directive tools instruct deployment tasks step by step, operators often have to intervene directly in case of failures or changes.
Samsung Cloud Platform supports code-based infrastructure tasks, and provides CLI and Open API.
By using this, you can automate resource deployment using the IaC tool Terraform as shown in the figure below.
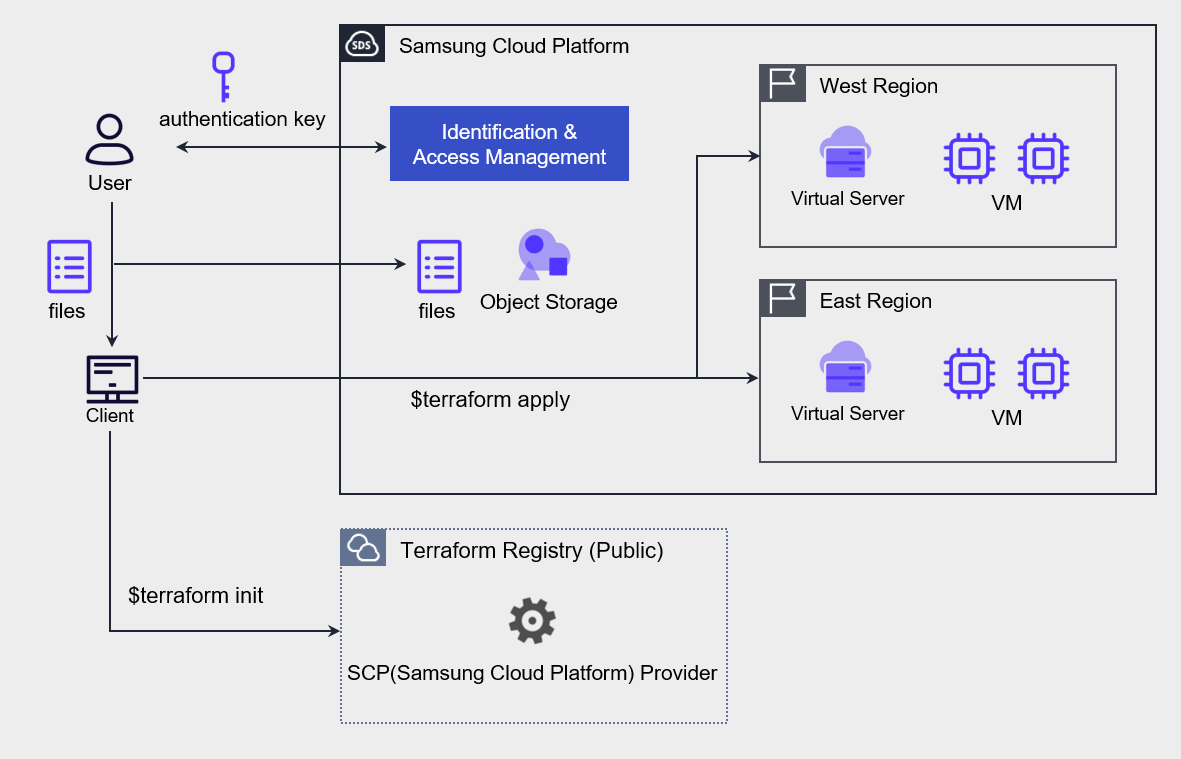
After creating an authentication key for Terraform tasks and completing the environment setup on Samsung Cloud Platform, write the resources and environment configuration to be deployed as code, and deploy VMs to the kr-west1 and kr-east1 regions using Terraform commands.
Central Code Repository Implementation
The DevOps Service of Samsung Cloud Platform includes tools that allow users to store source code and perform configuration management. By setting up a private Git repository for each project, you can configure user-specific access permissions, enabling secure sharing of source code, development collaboration, and CI/CD environment configuration.
The following diagram shows the application deployment automation architecture using DevOps Service.
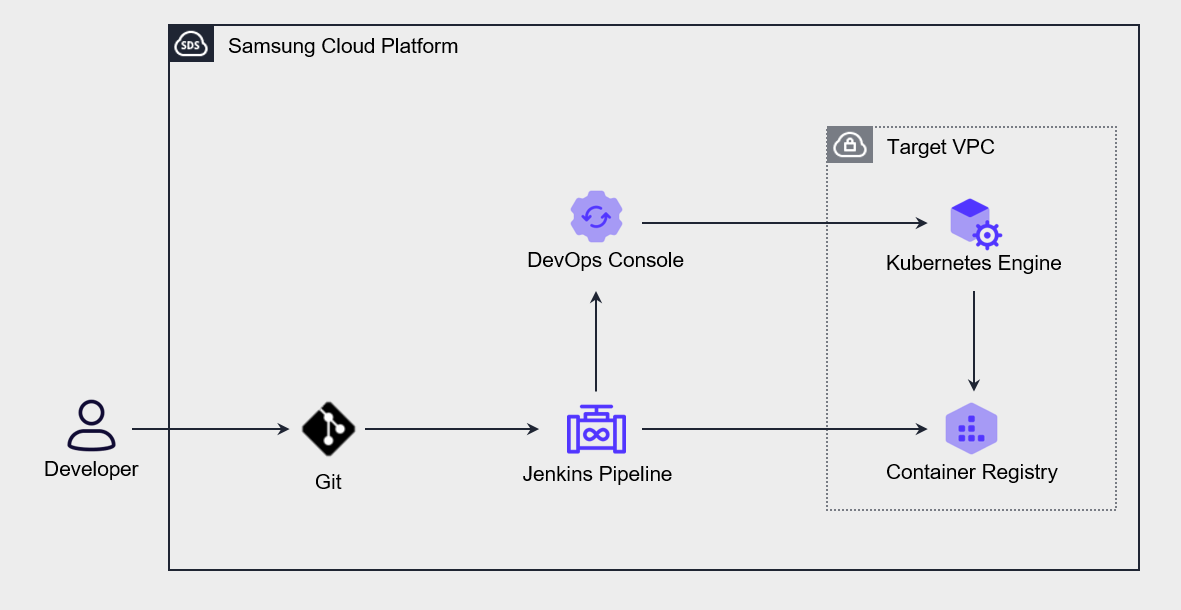
When the user pushes source code to Git, the Jenkins pipeline is triggered, and the built Application or container object configuration declaration file is automatically deployed to the Kubernetes Engine.
If you store not only source code but also infrastructure configuration declaration files in a central repository and perform operational management, you can manage changes in an integrated manner, and the version control feature also allows you to restore to a previous state when needed.
Continuous Integration and Deployment (CI/CD) Use
Through Continuous Integration (CI), developers frequently commit to the code repository, and automatically perform builds and tests.
In this process, unit tests and integration tests are run automatically, and before deploying to the production environment, both automated tests and manual tests are performed.
Deployment to Staging and production environments is allowed only if all tests pass.
Continuous integration refers to the process of automating the build and unit testing stages in the software development lifecycle, and every update committed to the code repository generates automated builds and tests.
Continuous Deployment (CD) expands the continuous integration process and includes procedures that automatically deploy builds that have passed testing to the production environment.
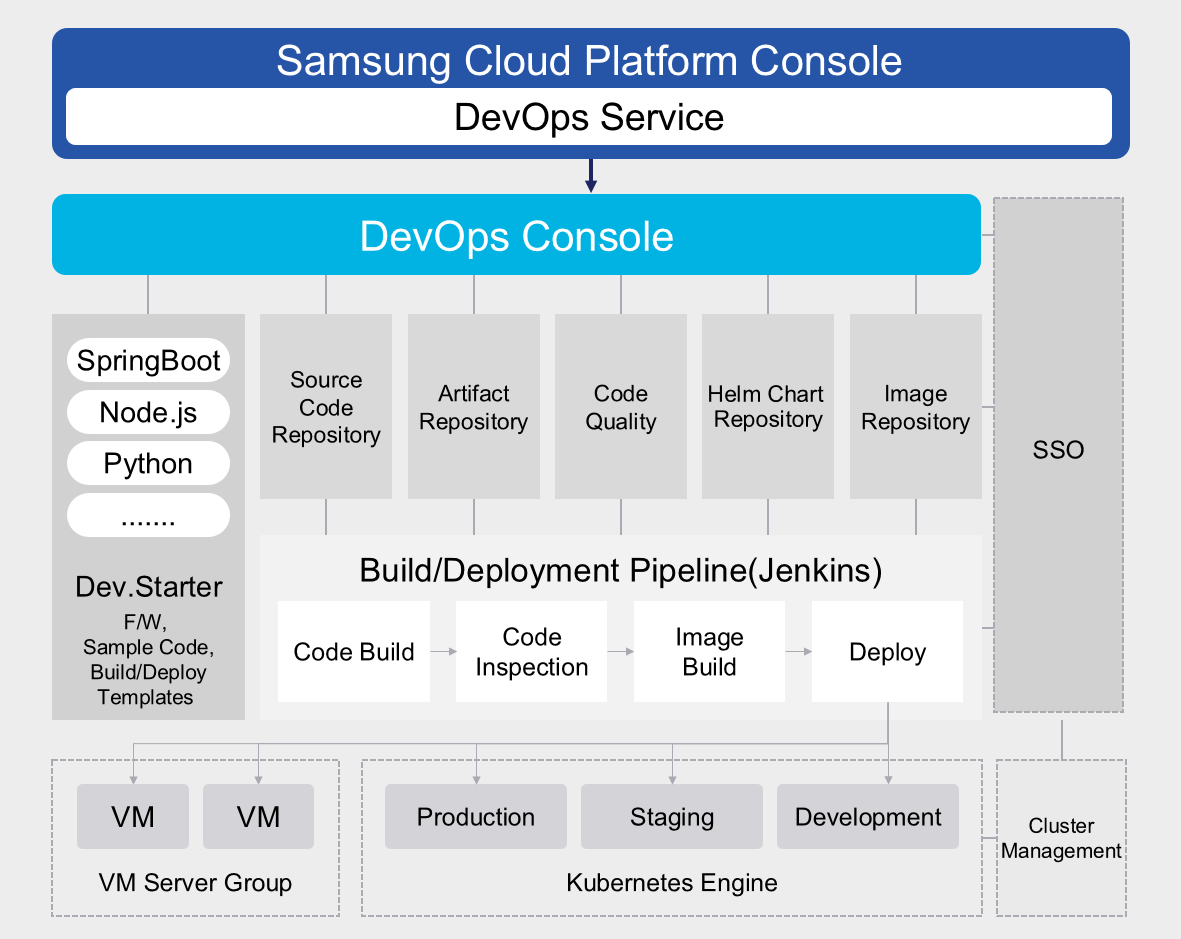
The following diagram shows the CI/CD process of the Samsung Cloud Platform.
In actual CI/CD, multiple people collaboratively write code, and all developers must work based on the latest build.
To do this, we need to set up a central code repository to manage multiple versions of code and allow developers to access and work together.
Developers check out the code from this repository, then modify it or write new code in a local copy, test, and then commit back to the repository.
Continuous Integration (CI) automates most of the software release process, but the final deployment to the production environment is typically triggered manually by developers. Continuous Deployment (CD) extends Continuous Integration (CI) by automatically deploying all code changes to test or production environments after the build stage.
The figure below shows the CI/CD architecture of the development, testing, and production environments implemented on the Samsung Cloud Platform.
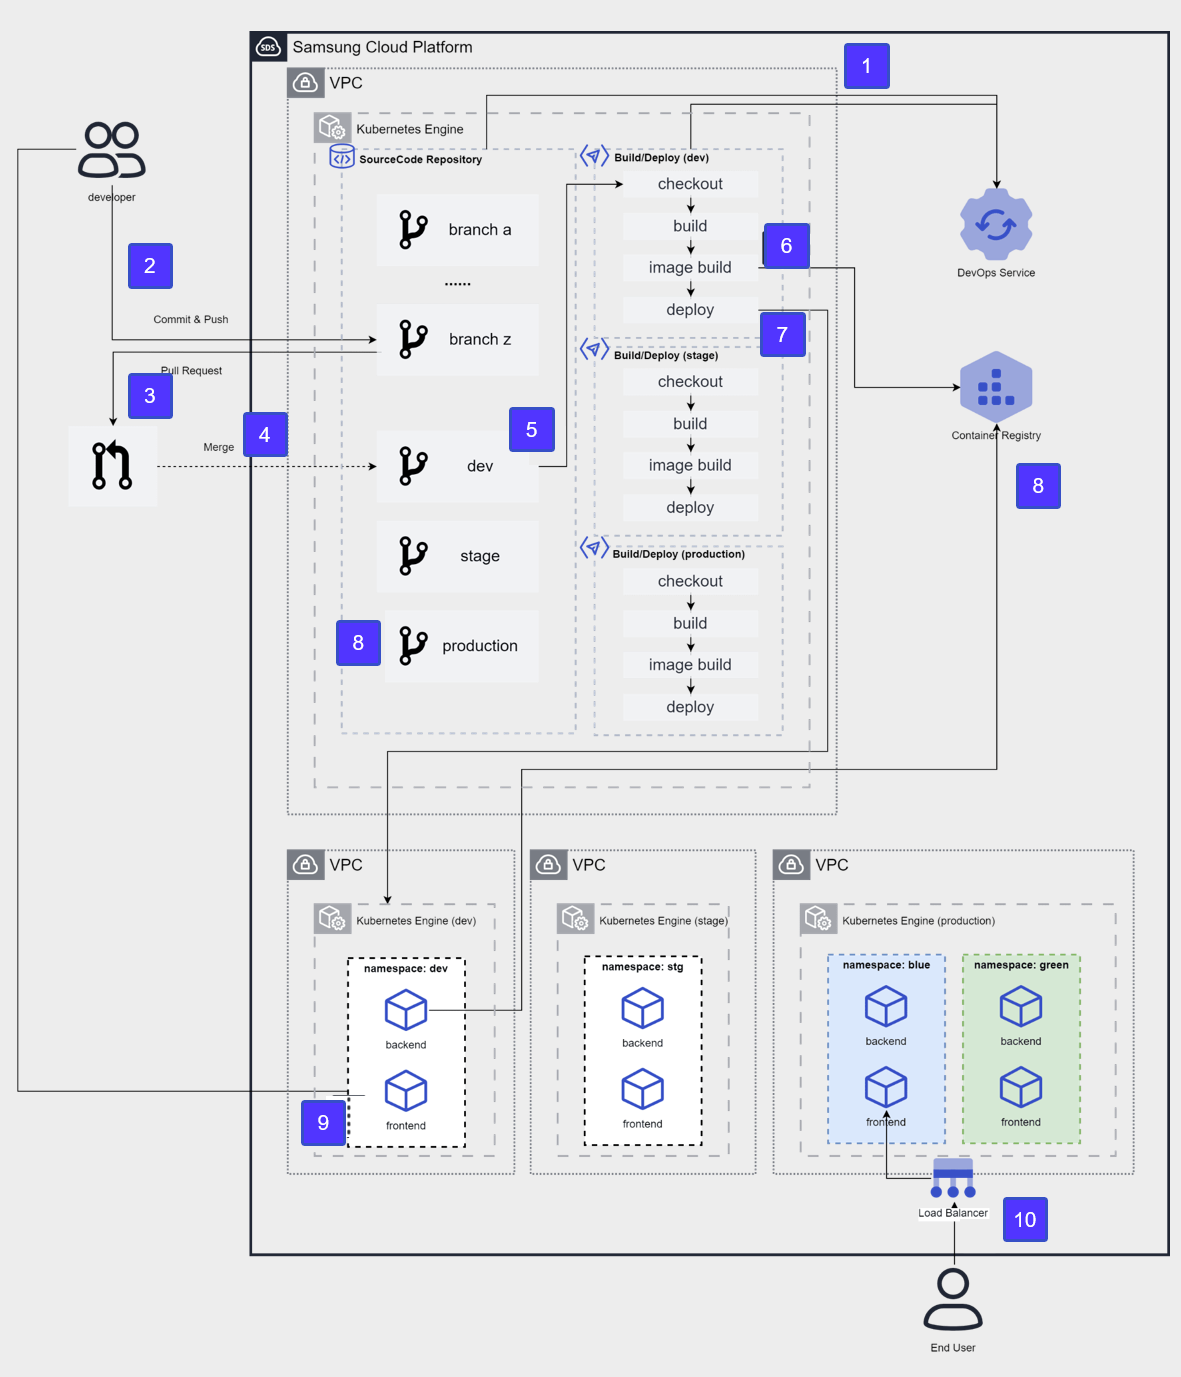
After applying for DevOps Service, configure the source code repository and CI/CD tools in the user area and integrate with DevOps Console.
The developer pushes the development source code to the developer branch of the source code repository.
To distribute source code to the development environment, request a pull of the developer branch to the Dev branch.
Merge into the Dev branch after the review stage.
After merging the Dev branch, the CI/CD build pipeline runs, and goes through the process of source code checkout → build → container image build.
The built container image is stored in the Container Registry.
The new version image will be deployed to the container of the target cluster (dev).
Developer accesses the frontend container to check the deployment results.
After confirming Dev → Stage, merge into the Production branch for an operational release, and repeat steps 4–8 targeting the Production cluster.
Perform releases using the blue-green deployment method and provide services to the End User.
Cloud Deployment
Cloud deployment is a core process of applying system changes, and is one of the main causes of failures.
Operational excellence is largely determined by how you design and execute such fault-free deployments.
To this end, systematic strategies and tools such as automation, monitoring, and rollback functions are essential.
By building a continuous integration (CI) and continuous deployment (CD) pipeline, you can efficiently manage the process from development to deployment, and apply changes quickly and safely.
This plays an important role in maintaining the system’s availability and reliability.
Blue-green deployment and canary deployment are widely used as deployment strategies. Blue-green deployment runs the new version and the existing version simultaneously, and if a problem occurs, it can quickly switch back to the previous version, providing high stability.
Canary deployment has the advantage of gradually applying a new version to a small user group, allowing early detection and resolution of issues.
These strategies must be designed considering the elasticity and scalability of the cloud environment.
In a cloud environment, you must ensure system stability through resource allocation, load balancing, and disaster recovery planning.
Additionally, a deployment process that meets security and compliance requirements must be established to ensure data protection and regulatory compliance.
By comprehensively considering these factors and designing and executing cloud deployment, you can maximize operational efficiency and service quality.
Infrastructure, Application Deployment Strategy Establishment
After configuring infrastructure and application deployment automation, you need to review the deployment strategy.
The most commonly used deployment strategies are as follows.
| Distribution Strategy | Description |
|---|---|
| In-place deployment In-place deployment | Perform updates on the current server. |
| Rolling deployment Rolling deployment | Gradually deploy the new version to the existing server group. |
| Blue-green deployment Blue-green deployment | Gradually replace the existing server with a new server. |
| Red-Black Deployment Red-black deployment | Switch immediately from the existing server to the new server. |
| Immutable deployment Immutable deployment | Build a completely new set of servers. |
in-place deployment
In-place deployment is a method of directly deploying a new application version to an existing set of servers. Because the update is performed with a single deployment operation, a certain amount of downtime may occur. But because infrastructure changes are hardly needed, and there is no need to modify existing DNS records, the deployment process itself proceeds relatively quickly. If deployment fails, redeployment is the only way to restore.rolling deployment
Rolling deployment is a method that divides a set of servers into multiple groups and updates them sequentially. Because there is no need to update all servers at once, the previous version and the new version can coexist even during deployment. As a result, it can minimize downtime and is evaluated as a favorable strategy for achieving zero downtime. Even if the new version deployment fails, only some servers are affected, so it does not have a major impact on the overall service. However, the deployment time may be slightly longer than the in-place method.Blue-Green Deployment
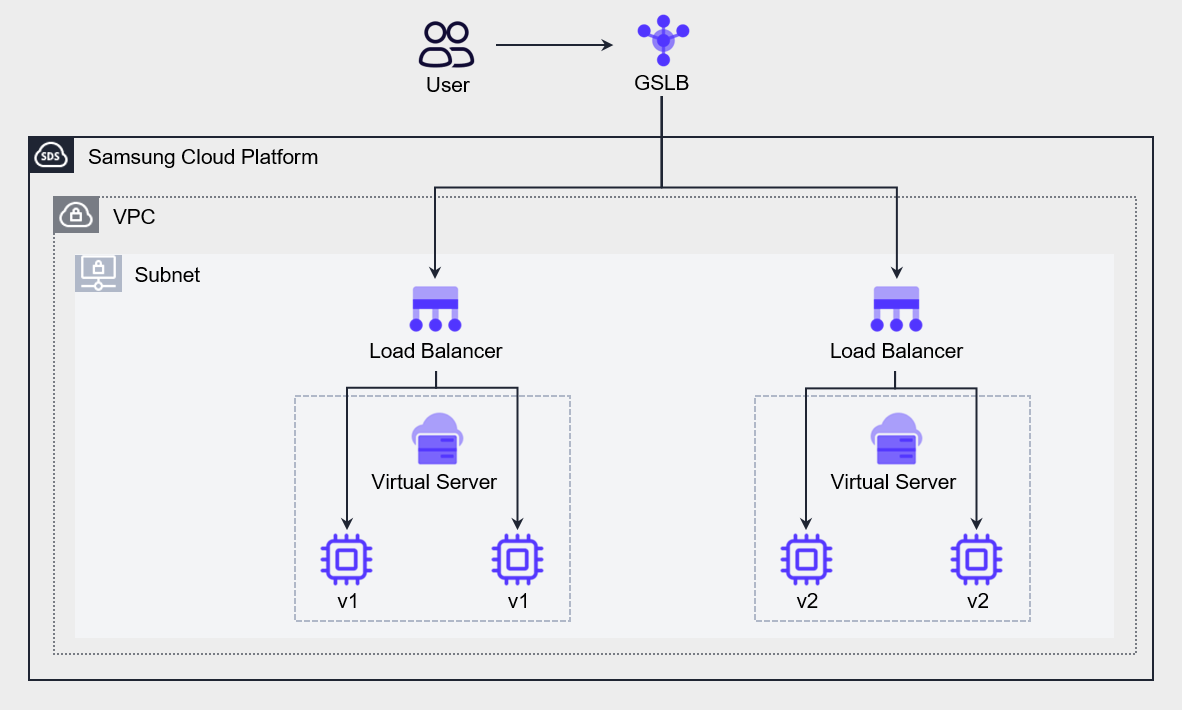
In the blue-green deployment strategy, ‘blue’ refers to the existing production environment where actual user traffic is delivered, and ‘green’ refers to the parallel environment where the new code version is applied. When deploying, you switch user traffic from the blue environment to the green environment, and if a problem occurs in the green environment, you can roll back by returning the traffic to the blue environment. DNS cutover and Auto-Scaling group policies are commonly used to switch traffic in blue-green deployments. By using Auto-Scaling policies, you can gradually replace existing instances with VMs hosting the new version of the application as the application scales. This method is especially suitable for minor releases and small code changes. Another method is to use GSLB policies to perform switching between different versions of the application. The figure below shows an architecture that creates an environment hosting a new version of the Application and then uses GSLB to shift some traffic to the new environment. By configuring GSLB’s policy with a Ratio algorithm and adjusting the weight ratio, we perform a gradual transition from a blue environment to a green environment.
Red-Black deployment
Red-Black deployment is similar to Blue-Green deployment, but there is a difference in the DNS switching method. Red-black deployment switches to a new version by changing DNS all at once without a gradual transition. As a result, in blue‑green deployments the previous version and the new version coexist for a certain period, but in red‑black deployments only one version is active. It is a strategy suitable for cases that require rapid switching.Immutable deployment
Immutable deployment is a suitable strategy when there are unknown dependencies in the application, or when the infrastructure is complex. An application that was built a long time ago and has had repeated updates becomes increasingly difficult to upgrade over time. In immutable deployment, during the release of a new version, the existing VM is terminated and a new VM is deployed.
When designing infrastructure and application deployment strategies, you must consider not only downtime but also cost.
Based on the number of VMs to be replaced and the deployment frequency, calculate the cost, and considering the budget and downtime comprehensively, select the most suitable deployment method.
To achieve high-quality deployment, application testing must be performed at every stage, and this requires considerable effort.
The CI/CD pipeline discussed earlier can help automate the testing process and increase the quality and frequency of feature releases.
Use version control
Automating infrastructure and application deployment increases deployment speed and frequency.
This is a desirable development in terms of business agility, but it requires more meticulous work for the operations team to manage the deployment.
Issues such as failures or losses, or the need to track the history of past releases, may arise, and it is important to have a management system for this.
Version control contributes to reducing the risk of loss by allowing recovery to a normal state or previous data.
In Samsung Cloud Platform, version control can be configured at the following three levels.
Data version management based on Object Storage In the Object Storage of Samsung Cloud Platform, you can enable versioning for object storage. Even when you overwrite or delete an object, you can restore it to its state before the change. Object Storage’s version management is similar to backup or synchronization in that it preserves data, but differs in the way it preserves existing data. Backup preserves data at a specific point in time, while synchronization reflects data changes at all times to the replication target, but does not preserve existing data. Object Storage’s version management saves a new version each time an object is changed by receiving POST, PUT, DELETE requests among HTTP methods, while preserving the existing version.
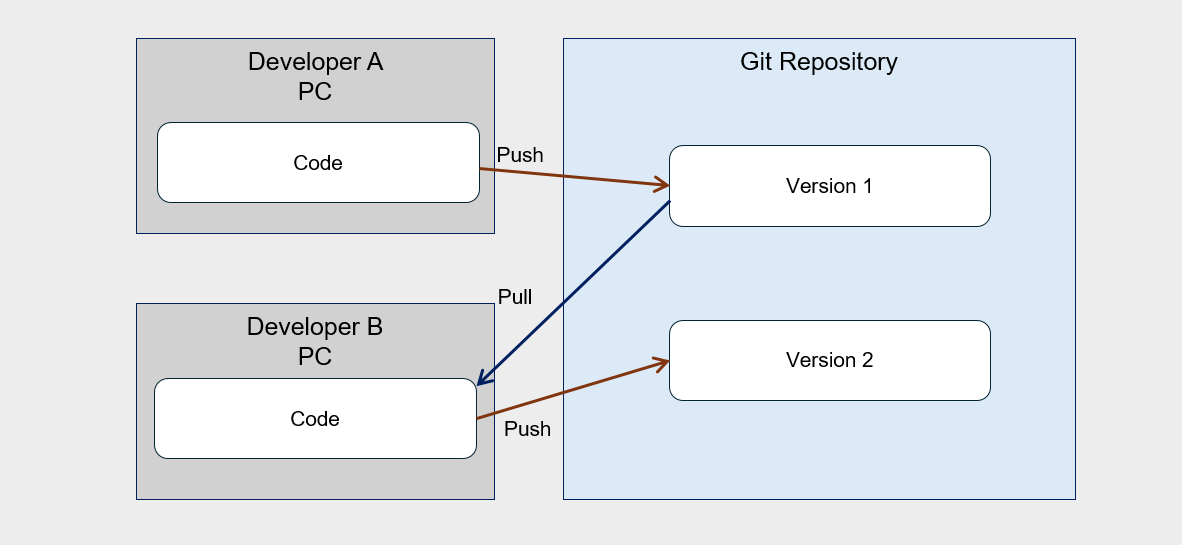
Source code version control based on Git You can perform source code configuration management using the Git tool. Source code storage, commit history, changes, history verification and change notifications, etc., you can manage the version of development code using all kinds of Git commands and features. Developers fetch source code from the Git tool, work on it on a local PC, and when the work is completed, they commit to the repository. When multiple developers collaborate, changes can be tracked through version control as shown in the following diagram.
- Server Image Version Management By managing the image of Virtual Server, you can systematically manage the server version. You can use this image to deploy a new Virtual Server at a specific point in time, and you can also register it in a Launch Configuration to use as an Auto-Scaling server. The container image to be used in Kubernetes Engine is stored in Container Registry, and the image is used when deploying pods internally. If an update occurs in the Application, you can register it as a new version and use it for distribution. You can also store and manage the previous version in the Registry, and if needed, you can check and restore images of past versions.
Test and Rollback Automation
Operational optimization is a core process that must be performed continuously.
Continuous effort is required to verify and improve changes, and achieving operational excellence in this regard is not a short-term goal but can be described as an ongoing journey.
Changes are inevitable in maintaining workloads, and system changes occur for various reasons such as applying security patches, software upgrades, and reflecting compliance requirements.
You must design the workload so that all system components can be updated regularly, in order to stay up to date and reflect important updates.
To avoid a big impact, procedures must be automated so that small changes can be applied.
All changes must be reversible, allowing the system to be restored even if problems occur.
Applying such small-scale changes makes testing easier and helps improve overall system stability.
Also, we need to automate change management to reduce human errors and achieve operational excellence.
The following figure is an example of environment configuration for testing a new version of the Application, illustrating a case where an A/B test is implemented by providing two or more feature versions to different user groups.
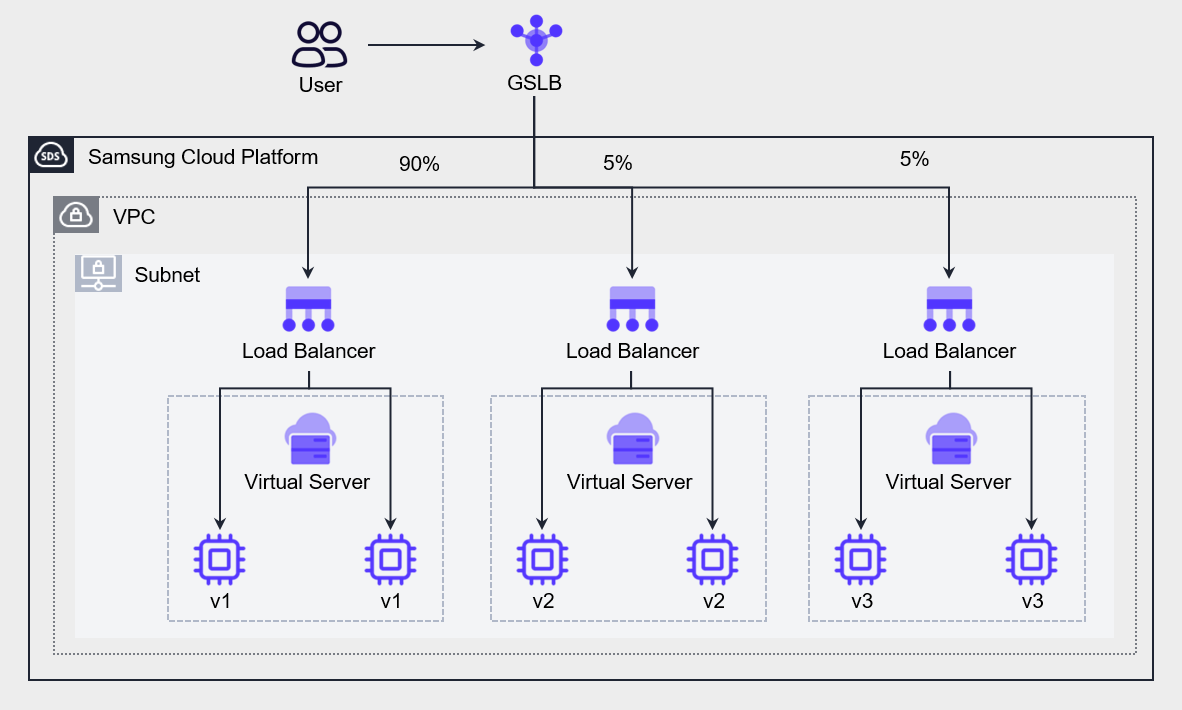
Set the Ratio algorithm in GSLB to send 90% of all requests to the existing Application (v1), and distribute 5% each to the newly developed v2 and v3 to conduct user testing.
Through this, you can verify the stability of the application and server infrastructure.
You can use the same method even during full deployment.
By choosing a blue-green deployment strategy, you can send a portion of user requests to the green environment to test the impact, which is called Canary analysis.
If there is a problem with the new version (v2), you can immediately notify users and switch traffic to the existing version (v1) before it has a serious impact on users.
Testing the green environment to see if it can handle load while gradually increasing traffic.
By monitoring the green environment, detecting problems, and providing an opportunity to re-route traffic, it limits the blast radius.
If all indicators are normal, terminate the blue environment (v1) and release the resources.
Blue-green deployment sets downtime to zero, provides easy rollback, and allows users to specify deployment time as needed.
Cloud Monitoring and Log Analysis
Cloud monitoring and log analysis are essential tools for understanding system status and solving problems.
Traditional monitoring simply tells you what is broken (e.g., CPU 100% usage), whereas modern cloud observability provides deep data that allows debugging the cause of failures.
Through this, it is possible to understand the complexity of the system, identify the root cause, and respond quickly and accurately.
Monitoring and log analysis contribute to enhancing the efficiency, stability, and security of cloud operations.
Analyze resource usage patterns to optimize costs, eliminate performance bottlenecks, and identify security threats early.
Additionally, by utilizing automation tools and AI to perform real-time log collection and analysis, you can achieve operational optimization more quickly and accurately.
This approach effectively manages the dynamic and complex characteristics of cloud environments, supporting business continuity and innovation.
Monitoring and Alert Configuration
Operational excellence is determined by the capability to respond quickly and recover when a failure occurs through monitoring.
For this, it is important to understand the workload’s operational state by identifying the impact of events and their corresponding responses on the workload, and to assess the system’s operational state using event metrics and dashboards.
Samsung Cloud Platform’s Cloud Monitoring service collects usage status, change information, logs, etc. of operating infrastructure resources, and if the set threshold is exceeded, it generates an event and notifies via an alert.
Through these features, users can respond quickly to performance degradation or failure situations, and can predict when resource capacity expansion is needed to maintain a stable computing environment.
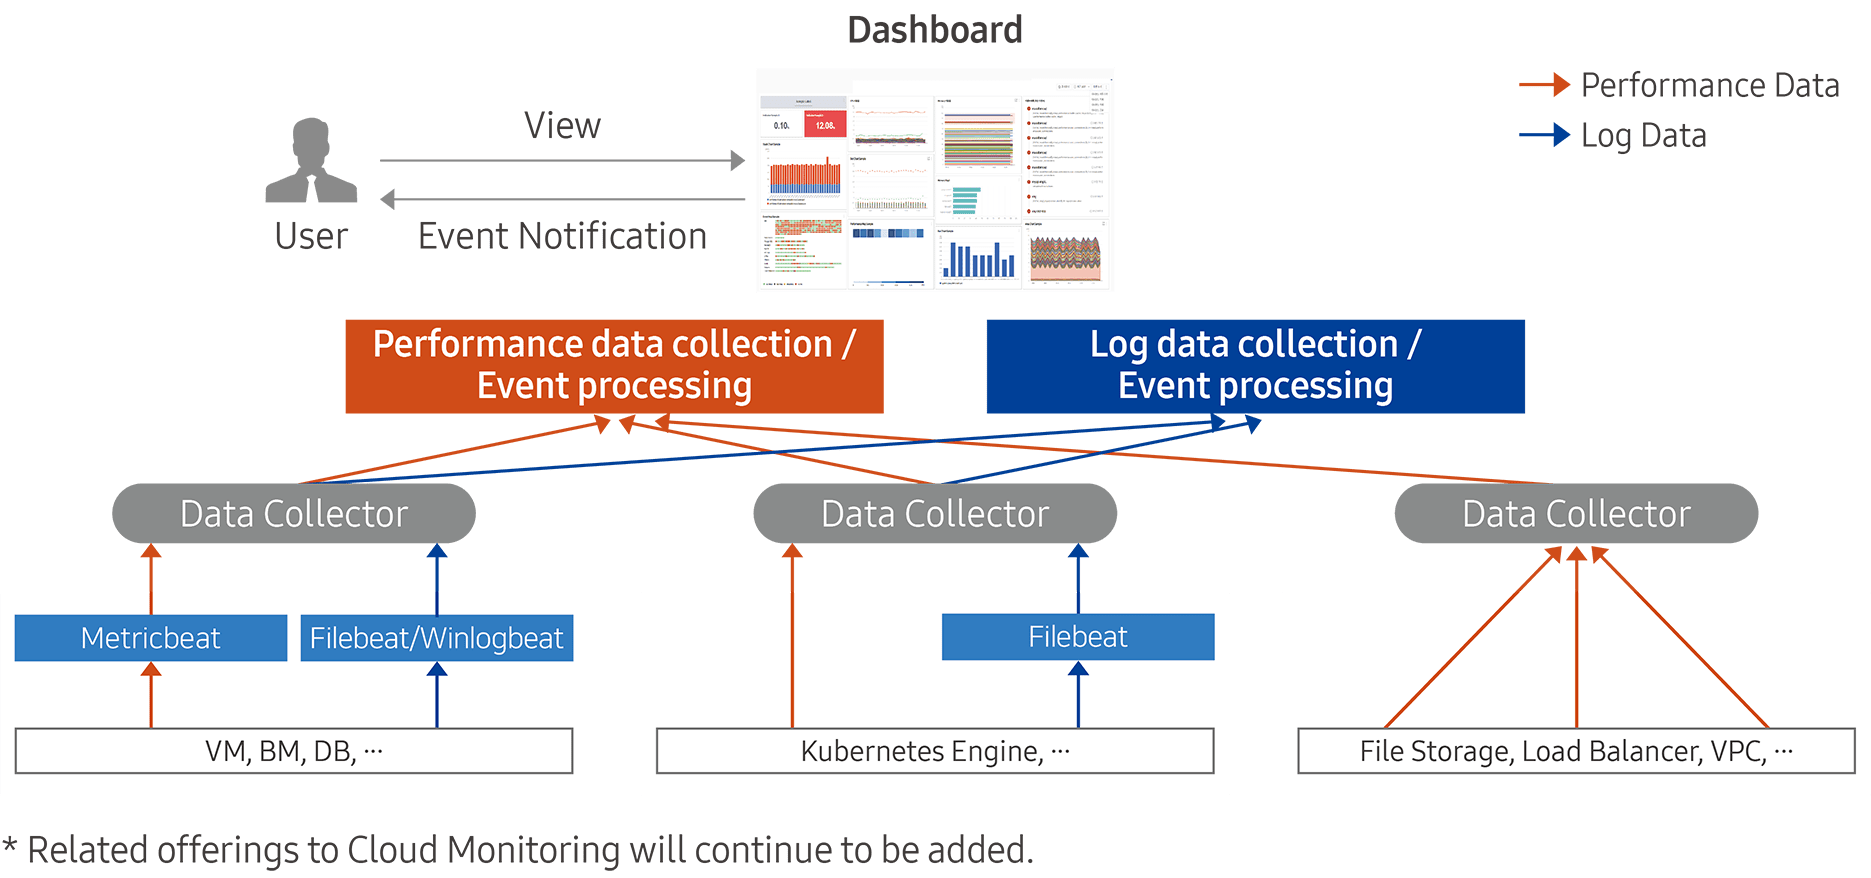
The instrumentation features provided by Cloud Monitoring are broadly divided into two: performance data collection and event processing, and log data collection and event processing.
Tracking system status is an essential element for understanding workload behavior.
The operations team uses system status monitoring to detect anomalies in components and takes action accordingly.
Generally, monitoring is easy to think of as limited only to the infrastructure layer, such as tracking server CPU and memory usage, but in reality, monitoring must be applied to all layers of the architecture, including application, network, and database.
The following table is a list of services that can be configured for monitoring by connecting Cloud Monitoring.
| Category | Service Group | Service |
|---|---|---|
| Performance Monitoring | Compute | Virtual Server, GPU Server, Bare Metal Server, Multi-node GPU Cluster |
| Performance Monitoring | Storage | Block Storage(VM), Block Storage(BM), File Storage, Object Storage |
| Performance Monitoring | Database | EPAS, PostgreSQL, MariaDB, MySQL, MS SQL, CacheStore |
| Performance Monitoring | Container | Kubernetes Engine, Container Registry |
| Performance Monitoring | Networking | VPC, Load Balancer, VPN, Global CDN, Direct Connect, Cloud WAN |
| Performance Monitoring | Data Analytics | Search Engine, Event Streams, Vertica |
| Log Monitoring | Compute | Virtual Server, GPU Server, Bare Metal Server, Multi-node GPU Cluster |
| Log Monitoring | Database | EPAS, PostgreSQL, MariaDB, MySQL, MS SQL, CacheStore |
| Log Monitoring | Container | Kubernetes Engine |
| Log Monitoring | Data Analytics | Search Engine, Event Streams, Vertica |
To configure alerts in Cloud Monitoring of Samsung Cloud Platform, you need to define events.
An event is a setting to notify the user when the performance value of the monitoring target reaches a pre-specified threshold.
When setting up an event, specify the monitoring target, performance items, measurement type/unit, risk level, and thresholds.
You can specify the recipient of the notification and send the notification.
Log Recording and Collection
Log collection and analysis are performed for the purpose of post-incident response when a problem occurs.
This is because an approach that analyzes the cause of the problem provides the clue to solving the problem most quickly.
If you can correctly identify the problem, you can find and apply an efficient solution.
Samsung Cloud Platform provides 1GB of storage for log collection, and if exceeded, old logs are automatically deleted.
To set up log collection in Cloud Monitoring, the log agent must be installed on the collection target.
Network Logging collects logs from Firewall, Security Group, NAT and stores them in Object Storage, allowing analysis of traffic moving between inside and outside of the VPC.
If Cloud Monitoring and Network Logging are records of system-related activities, Logging & Audit are records of cloud and user activities.
For example, if a user logs into the Console and creates a Virtual Server, such activities are recorded in Logging&Audit.
If you configure a Trail, you can retain these logs long-term without time constraints.
Collecting data from various resources to make decisions and predict potential problems is not a prerequisite for operations, but it contributes decisively to improving operational quality.
This helps predict possible future failures in advance and prepares the team to respond appropriately.
Implement a mechanism that collects logs of various activities across job events and workloads, as well as infrastructure changes, to create detailed activity tracking, and maintain activity records for audit purposes.
In large organizations, a large amount of log data is generated from many systems, and to gain insights from this data, a mechanism to collect and store log and event data over a certain period is required.
Log analysis and improvement activities
By analyzing the monitoring logs built using the tools and solutions of Samsung Cloud Platform, improvements can be pursued.
Through regular log analysis, you can increase the efficiency of cloud operations, optimize costs, and strengthen security.
In cloud environments, various resources are dynamically created and deleted, generating large amounts of log data, and by effectively analyzing this log data, potential problems can be discovered early, enabling the derivation of improvements to optimize operations.
First, by analyzing cloud logs to identify resource usage patterns, you can optimize costs.
For example, if data is found showing that unused resources remain active or costs surge due to unexpected traffic increase, you can reset the Auto-Scaling policy based on that data or reduce costs through committed pricing.
Next, it can also be used for performance improvement.
Log analysis in cloud environments plays an important role in monitoring and optimizing system performance.
By analyzing log data, you can identify the application’s response time, database query speed, network bandwidth usage, etc., and through this, you can find sections where performance degradation occurs, remove bottlenecks or optimize resource allocation, thereby improving the overall system performance.
Log analysis is also essential for identifying and responding to security threats.
Trail logs include user access and activity records, and VPC log analysis can detect abnormal network activity.
If you continuously analyze log data, you can quickly detect abnormal login attempts, data leakage attempts, malicious activities, etc., and by discovering early signs of anomalies and taking appropriate response measures, you can minimize security threats.
Short-term log analysis can be performed with existing tools, but to gain better insights, you can use specialized log analysis tools or artificial intelligence.
If you perform log analysis using automation tools and artificial intelligence (AI), you can achieve operational optimization more quickly and accurately.
By using such log analysis tools, real-time log collection and analysis become possible, and when a problem occurs, immediate notifications can be provided or automatic corrective actions can be performed.
Event Response
Event Grade Definition
The impact on work is evaluated through work structuring, identification of key tasks, and analysis of task interrelationships (see Stability Design Principles for details), and based on this, the importance of events can be defined for the identified major systems.
In Cloud Monitoring, you can set events and classify them by risk level.
Risk levels can be set to Fatal (the highest level), Warning (the middle level), and Information (the lowest level), and the event occurrence frequency can be visualized according to each risk level.
Through event settings, you can identify monitoring information that must be checked without missing it.
For example, if you set it so that an event occurs whenever a performance value related to overload exceeds a certain threshold, a notification will be sent to the user each time there is a risk of overload during the operation of the resource.
Operators can respond in advance based on this before a problem occurs.
Event Management Process
If a failure occurs, or even if it does not lead to an actual failure, when an equivalent urgent (Fatal) event occurs, prompt action must be taken.
To this end, the event management process must be defined in advance, and through this, problems can be quickly identified and appropriate response measures can be taken.
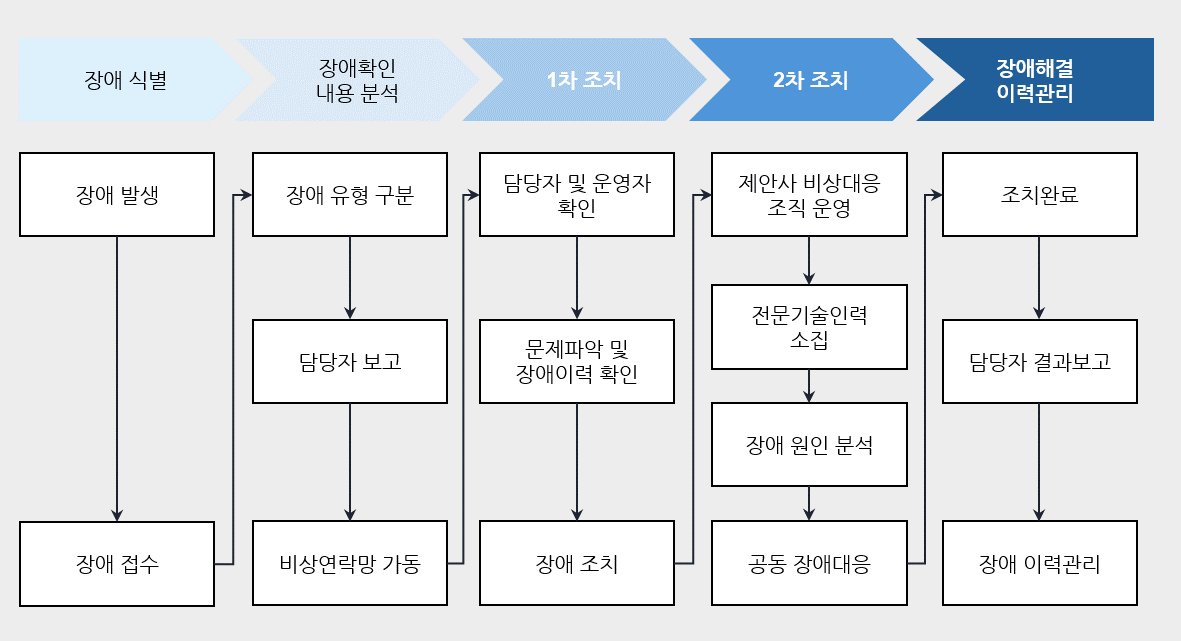
The following figure is an example of the fault management process described in the safety design principles.
Event Response Automation
To enable rapid event response, perform response actions based on predefined processes, and by configuring event response automation, you can reduce the time required from fault identification to response.
For example, assuming that a DDoS attack on the server has started by an external attacker as shown in the figure below, the goal of a DDoS attack is to generate excessive traffic to the server, causing server incapacitation that prevents normal users from using the service.
In such cases, the most desirable approach is to configure DDoS Protection to detect and defend against attacks.
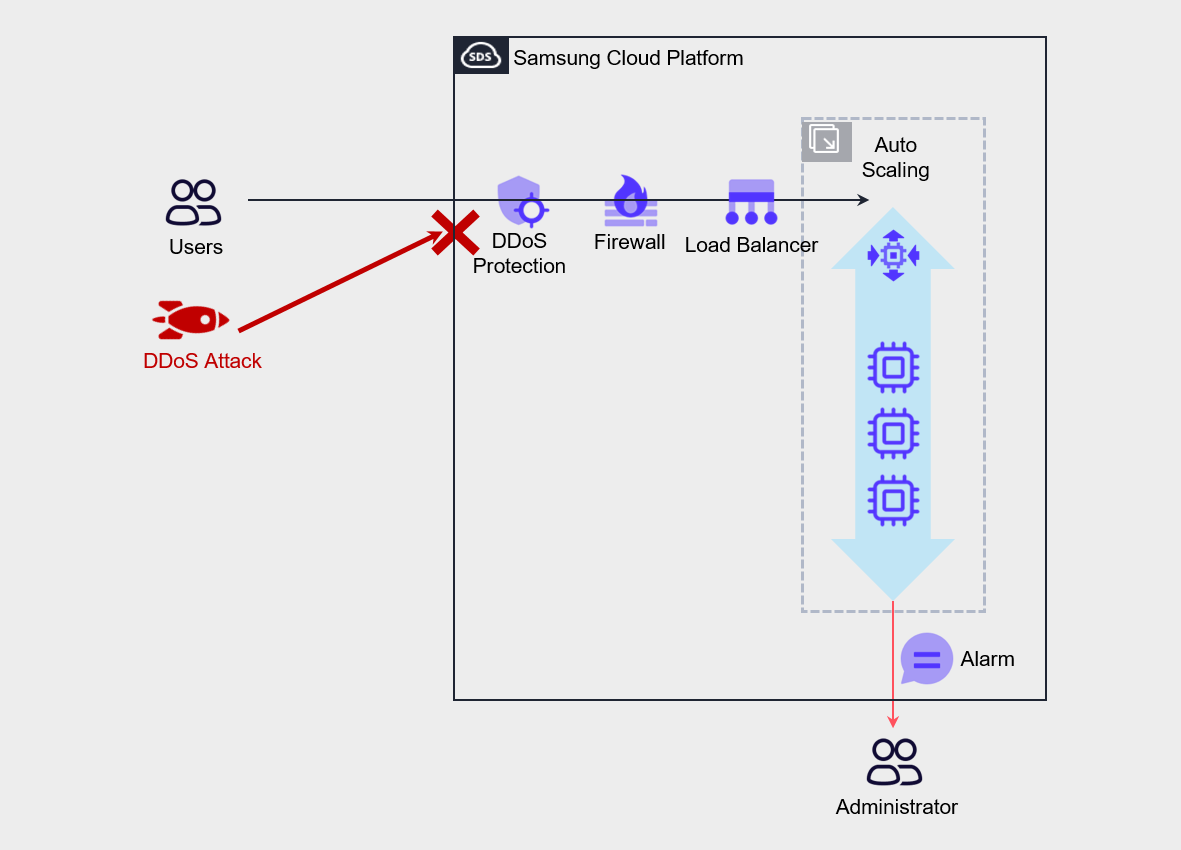
The architectural approach to respond to such attacks is to configure Auto-Scaling on a Virtual Server and set up a policy that increases the number of servers according to load.
Through this, we implement automated responses so that normal users’ service usage is not completely blocked.
Also, in Cloud Monitoring, configure threshold settings and alerts for items such as Network In or CPU usage so that notifications are sent to the administrator.
While the administrator receives notification of the attack and takes action, the automated measures of Auto-Scaling ensure service survivability, and the administrator can quickly identify the attacker’s IP and protect the service by configuring a deny policy for that IP address in the firewall.