Availability Management
Availability Check and Test
Availability Scenario Test
In on-premises environments, a small-scale test environment is set up to conduct testing, whereas in the cloud, a production-scale test environment that mirrors the actual deployment can be configured for testing.
By conducting tests in a separate environment without affecting users, you can verify that the service operates correctly without damaging the service or data.
- Develop test scenarios and conduct unit functional tests and integration tests.
- We inspect the measurement metrics according to documented Service Level Object (SLO), Service Level Agreeement (SLA), etc., and measure whether the service is operating in line with the objectives.
- During a load test, confirm that the required load is processed by adjusting resources.
- Identify bottlenecks and perform improvements.
From now on, we will review the architecture design and testing according to the availability goals.
The following shows the availability status of each major service of Samsung Cloud Platform.
| service | Maximum monthly availability rate | Stop time |
|---|---|---|
| Virtual Server (Single) | 99.9% | 43.8 minutes |
| Virtual Server (redundancy) | 99.99% | 4.3 minutes |
| Database(HA) | 99.95% | 21.9 minutes |
| Load Balancer | 99.95% | 21.9 minutes |
If the availability target is a monthly availability of 99%, the average repair time (Mean Time To Repair, MTTR) based on a 730‑hour month is 43.8 minutes.
The three-tier architecture to achieve these availability goals is as follows.
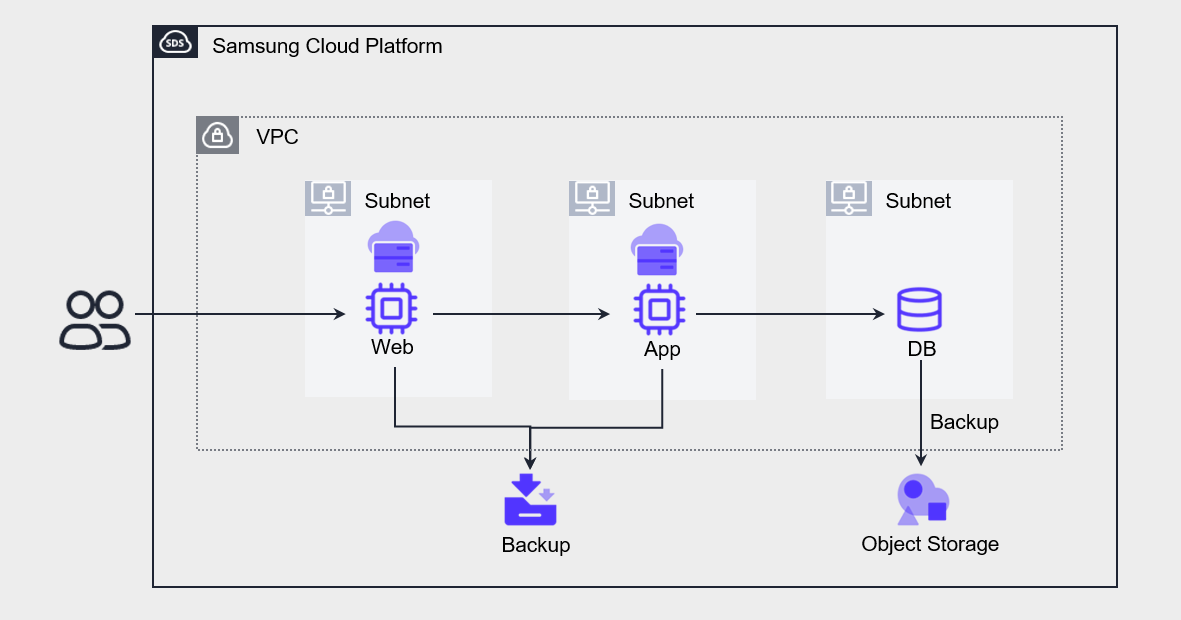
Web, App, and DB are all single configurations, and the VM stores a copy as a backup, while the DB stores a copy using the backup feature provided by the Database service.
When a failure occurs in each component, the allowable service downtime is 44 minutes according to the SLA.
The steps for conducting availability testing can be organized as follows.
| Item | Test item | Estimated time |
|---|---|---|
| Fault detection test |
| Administrator analysis/response time |
| Failure response test |
| up to 20 minutes |
| Resilience test |
| up to 60 minutes |
| load test |
| Maximum 15 minutes per task |
When performing step-by-step recovery after a failure, the estimated recovery time is up to 90 minutes.
If you prepare a CLI script instead of using the Console for recovery tasks and perform data operations in a test environment, the work time can be further reduced.
However, the most uncertain interval in the entire recovery process is the time from a failure occurring, through its detection and notification to the administrator, to the actual start of recovery operations.
How much this time can be reduced is something that needs to be reviewed during the testing process.
The following architecture targets a monthly availability of 99.9%, which translates to an MTTR (Mean Time To Recovery) of approximately 44 minutes based on a 730‑hour month.
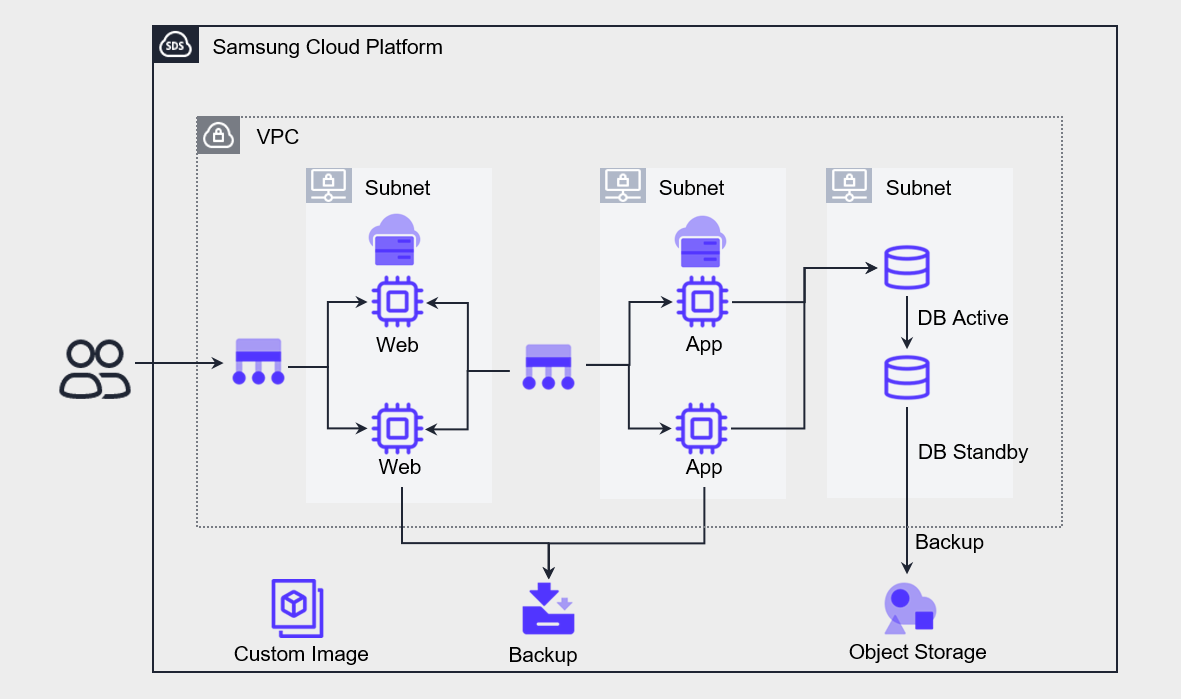
Web, App, and DB are all configured with redundancy for high availability.
A Load Balancer is implemented in front of the Web and App to distribute requests across redundant servers.
The DB is deployed as a high-availability Database service and configured in an Active-Standby setup.
The maximum availability of each redundant component is within the service availability of 99.9%.
The steps for conducting availability testing can be organized as shown in the table below.
| Item | Test item | Estimated time |
|---|---|---|
| Virtual Server Failure detection and response test |
| 30 seconds (default settings) |
| Database Failure detection and response test |
| seconds to minutes |
| Resilience test |
| Up to 60 minutes |
| load test |
| Maximum 15 minutes per task |
For each step, we shut down one of the redundant servers and perform a test to verify that fail-over occurs.
The Load Balancers configured for Web and App each forward incoming requests to their respective VMs while performing health checks.
When configuring a Health Check, you can set the check interval, timeout, and number of attempts.
By default, it is set to a period of 5 seconds, a wait time of 5 seconds, and a detection count of 3, and it detects failures and performs Fail-over, which takes 30 seconds [(period 5 seconds + wait time 5 seconds) * detection count 3].
Users can modify values for each item, setting values of 1–2, 147, 483, 647 seconds, and if set to the minimum, the fault detection time can be reduced to as low as 6 seconds.
Unlike the previous scenario, fail-over is converted to an automated action, so a simple failure can be recovered within the availability range.
However, if a VM or database is lost, it still takes time to recover the data.
And when conducting a load test, you must create a new VM from the image and register it directly with the load balancer’s server group.
For databases, we respond to load by changing the server type.
The following architecture targets a monthly availability of 99.99%, with an MTTR of approximately 4 minutes based on a 730‑hour month.
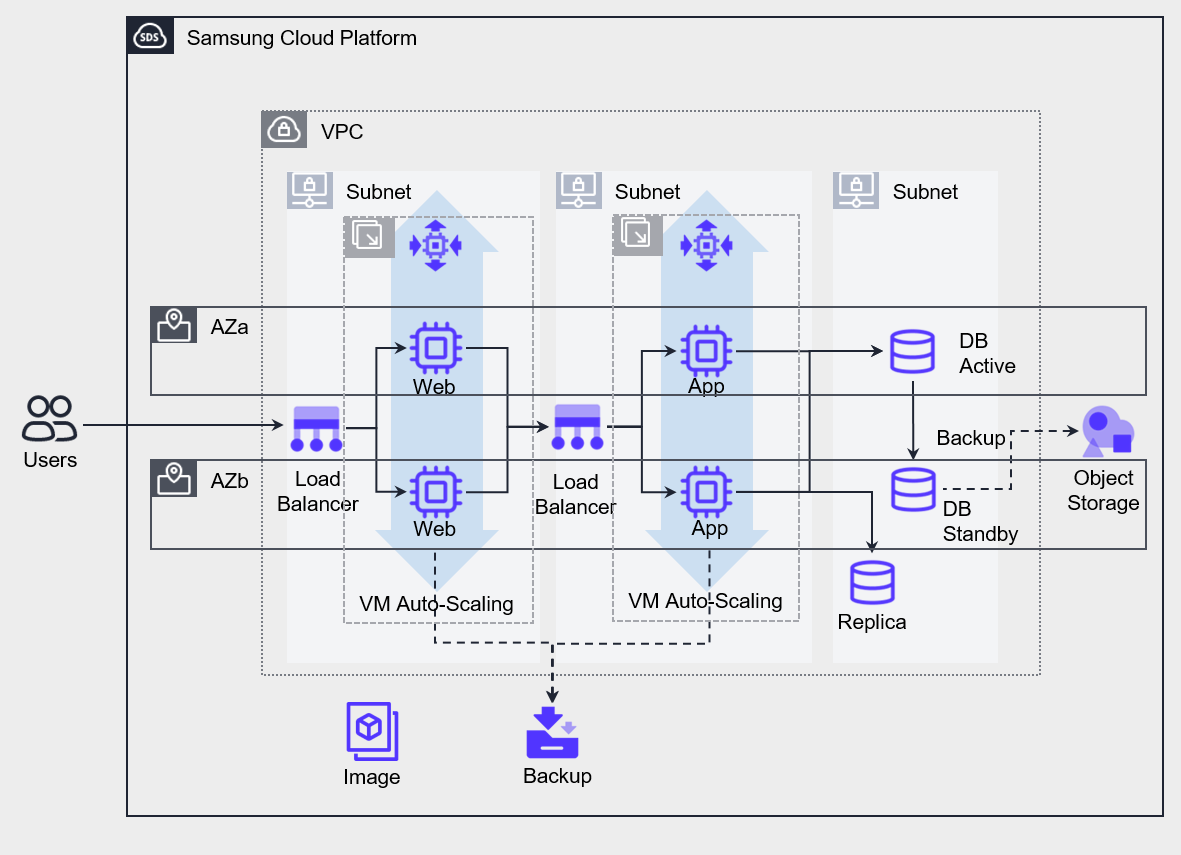
Implemented the VPC and each service on a Multi-AZ basis.
The VMs for Web and App were deployed using metric-based auto-scaling, and the servers were configured with a replica added to offload read workload from the database.
The availability of each component deployed across Multi-AZ is designed to meet the service’s required monthly availability of 99.99%.
The steps for conducting availability testing can be organized as shown in the table below.
| Item | test item | Estimated time |
|---|---|---|
| Virtual Server Fault detection and response test | Load Balancer Health Check Failure Detection and Failover | 30 seconds (default settings) |
| Database Failure detection and response test | After stopping the Active DB, switch to the Standby DB | seconds ~ minutes |
| Resilience test | Restore Virtual Server from backup Create new database Recover database from backup Apply data changes up to the point of failure after the backup | Maximum 60 minutes |
| Load test | Auto-Scaling new server creation Change Database server type Create additional Replica based on database read load | up to 5 minutes |
The difference from the previous scenario is that resources are deployed across Multi-AZ, and Auto-Scaling has been implemented to automatically scale the servers horizontally up or down based on load changes.
Stop one of the redundant components to conduct a failover test, then incrementally increase the load and compare the server provisioning speed with the rate of load increase.
If the load increase rate exceeds the server creation rate, lower the scale‑out policy threshold to trigger expansion earlier and perform adjustments to increase the number of servers created.
Configure the database read load to be performed on the replica in advance.
During load testing, measure the database latency at each stage, and after the test, adjust the server type to an appropriate capacity.
Conduct periodic review
Planned Maintenance Test component and service flows during the regular maintenance (Maintenance) period when components are updated or security patches are applied. Perform tests on component changes and verify whether new bottlenecks arise in the overall service flow.
Unplanned Failure If an unexpected service interruption occurs, after confirming the incident, you must assess the recovery time and proceed with restoration according to the predetermined priority. Next, identify the root cause of the service interruption and resolve it. When the root cause analysis is complete, document the root cause, the solution, and the preventive measures to avoid recurrence. If a prolonged service outage is required to resolve an issue, take action in accordance with the scheduled regular maintenance window and implement the pre‑prepared emergency measures before the maintenance begins. We also collect logs to perform corrective actions. After resolving the issue, perform unit and integration testing to maintain overall availability.
Monitoring and Alerts
Monitoring and Log Collection
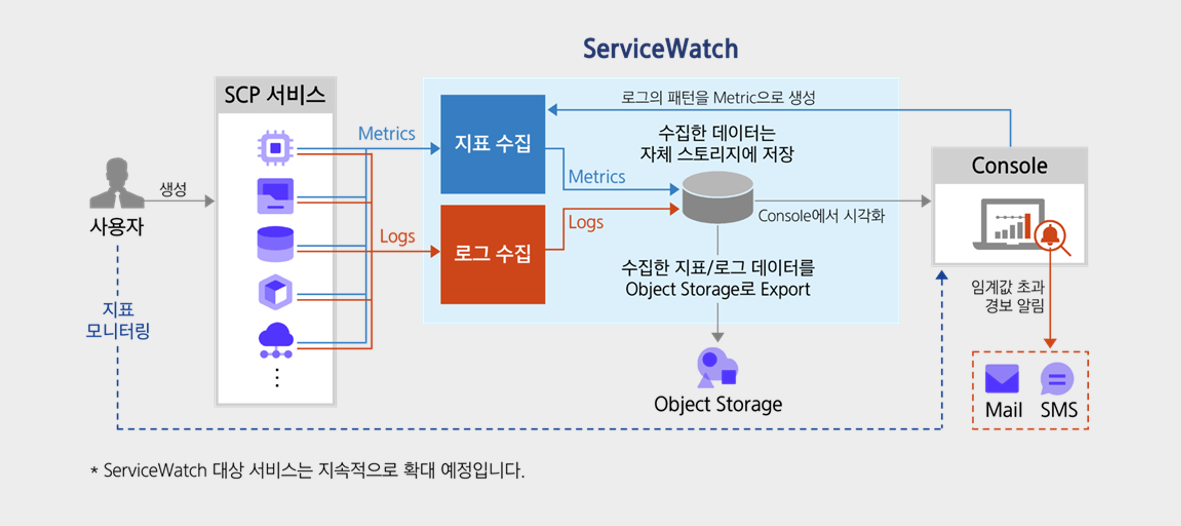
After selecting and collecting key metrics from all components, we link the analysis results to notifications to ensure workload stability and an optimal user experience.
We perform real-time monitoring based on metrics that meet availability requirements, collect time-series logs, and integrate the analysis results with alerts to detect failures in advance and prepare for them.
Monitor components at all layers, and when necessary define key metrics and extract those metrics based on log data.
- Set metrics and goals to maintain availability.
- Enable monitoring for all available services and configure the dashboard.
- Enable logging for all possible services, and manage the collected logs in a central repository.
If a metric falls below the availability target, take the necessary actions.
For example, if the average CPU utilization of a specific Virtual Server exceeds 90%, the probability of a failure on that server increases.
If it is a single server, replace it with a server that has increased capacity, and if it is a group of servers configured with a Load Balancer, add new servers to reduce the overall load.
Notification and Response Automation
Service disruptions can occur not only during working hours but also at any time.
If the metric is detected as not meeting the availability target, promptly notify of the failure condition and enable recovery actions.
- When the metric reaches the threshold, set an Event to automatically send a notification.
- Prepare the necessary actions for each Event in advance, and execute the actions immediately upon receiving the notification.
- Configure response actions that can be implemented automatically to ensure the necessary response is carried out.
The risk level of an Event can be divided into three categories.
| Risk level | Explanation |
|---|---|
| Fatal | This is the highest level of risk. Generally, this level is set for very dangerous situations. |
| Warning | This is a medium-level risk. Generally, when a situation causes a problem in the system that requires resolution, set it to this level. |
| Information | This is the lowest level of risk. It also includes simple notification-level information, and is set to this level when a situation generally requires reference or verification. |