
Redis Performance Monitoring and Tuning
Redis Performance Monitoring and Tuning
Overview
Redis is an in-memory key-value store that is widely used as a cache to improve performance. Because Redis is employed for performance, monitoring and tuning its performance are critical. This document explains how to understand the Redis architecture related to performance and how to monitor and tune it.
Redis architecture features
Single Thread
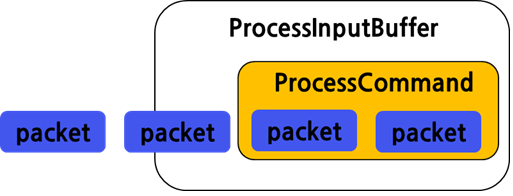
Because Redis operates on a single thread, if one request becomes a bottleneck, subsequent requests will continue to wait. Since it processes data in packet units and executes a command once it is complete, it is necessary to monitor whether unnecessarily long-running commands (keys, hgetall) are frequently executed in the production environment.
SlowLog
From the client side, the response time is measured as slow, around 100 ms to 300 ms, but there are cases where no SlowLog entries are accumulated on the Redis side. This suggests that Redis is not slow, but did Redis really respond quickly? To put it simply, Redis responded slowly. This issue arises because the interval used by Redis to measure SlowLog is different.
From the client’s perspective, response time refers to the time taken to call Redis and receive its response. In the figure below, the interval from ① to ② is what we usually call response time. Therefore, if this time exceeds 100 ms, it is generally perceived as slow by the client.
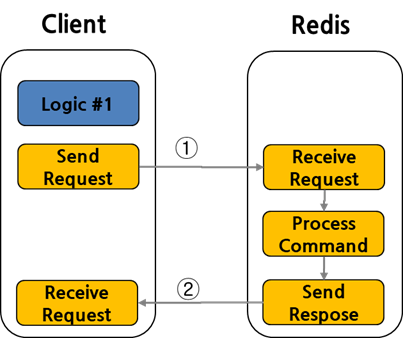
From Redis’s perspective, SlowLog determines slow operations based only on the processing time of the Process Command part highlighted in red below. Therefore, when a Long Command is executed, other requests wait in the client queue, and this waiting time is excluded from SlowLog evaluation. As a result, the client response time becomes slow, but the Redis SlowLog does not accumulate.
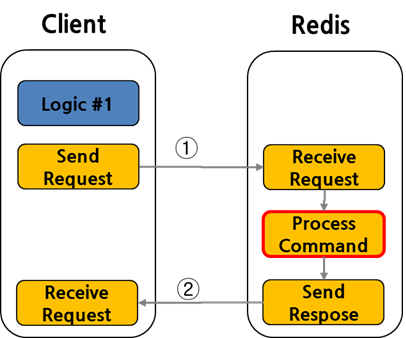
Because Redis is single-threaded, you must always consider time complexity when executing commands. If multiple requests arrive simultaneously, a delay in one operation’s execution will cause subsequent requests to be delayed as well. Therefore, you should be cautious of commands that perform O(N) operations, and typical examples of such commands are as follows. “ KEYS, FLUSHALL, FLUSHDB, Delete COlLECTIONS, Get All Collections “
Slow command/operation monitoring
SlowLog
SlowLog records an entry when the execution time of any command exceeds the configured threshold. The execution time includes only the time the command is processed by Redis. It does not include the time it takes for the command to travel from the client to Redis or the time to send the result back to the client.
[How to enable settings] Activation uses the two parameters in redis.conf. It can be applied dynamically with the config set command and is enabled by default.
slowlog-log-slower-than:
여기 설정한 시간(microseconds) 이상인 명령을 기록
단위는 microseconds
default는 10000(10ms)
0(zero)으로 설정하면 모든 명령을 기록
비활성화하려면 음수(마이너스)로 설정

slowlog-max-len:
여기 설정한 것만큼 보관합니다. default는 128입니다.
다 차면 오래된 것부터 지우고 새것이 기록됩니다.
[slow query view] redis-cli > slowlog get 128
29) 1) (integer) 31            <- ID: 증가하는 일련번호
    2) (integer) 1660542153    <- 실행시각(Linux timestamp)
    3) (integer) 10859         <- 수행시간(microseconds)
    4) 1) "HGETALL"            <- 수행 command
The query results show that the HGETALL command takes 10.859ms. This command retrieves all data, but we can examine whether using HGET
Latency Monitor
Latency Monitor(Response Time Monitor) sets the time unit to microseconds, and records commands/operations executed in Redis whose execution time exceeds the configured threshold, allowing analysis as a Redis performance analysis tool.
The difference from SlowLog is that it does not show command details, but collects data at the command/operation level. https://redis.io/docs/reference/optimization/latency-monitor/
- command: regular commands.
- fast-command: O(1) and O(log N) commands.
- fork: the fork(2) system call.
- rdb-unlink-temp-file: the unlink(2) system call.
- aof-fsync-always: the fsync(2) system call when invoked by the appendfsync allways policy.
- aof-write: writing to the AOF - a catchall event for write(2) system calls.
- aof-write-pending-fsync: the write(2) system call when there is a pending fsync.
- aof-write-active-child: the write(2) system call when there are active child processes.
- aof-write-alone: the write(2) system call when no pending fsync and no active child process.
- aof-fstat: the fstat(2) system call.
- aof-rename: the rename(2) system call for renaming the temporary file after completing BGREWRITEAOF.
- aof-rewrite-diff-write: writing the differences accumulated while performing BGREWRITEAOF.
- active-defrag-cycle: the active defragmentation cycle.
- expire-cycle: the expiration cycle.
- eviction-cycle: the eviction cycle.
- eviction-del: deletes during the eviction cycle.
[How to enable settings] Activation uses a single parameter in redis.conf. It can be applied dynamically with the config set command, and it is disabled by default.
latency-monitor-threshold:
여기 설정한 시간 이상인 명령/오프레이션 을 기록
단위는 millisecons
default는 0 으로 비활성화 되어 있음
[latency lookup] redis-cli > latency latest
1) 1) "command"             <- 이벤트명
   2) (integer) 1463729306  <- 마지막 명령 실행 시작 Linux timestamp
   3) (integer) 400         <- 마지막 명령 수행 응답시간(ms)
   4) (integer) 1000        <- 응답시간이 가장 큰(max) 시간
It allows you to identify which operation is slow, but you cannot view detailed commands for the command, so it is advisable to use it together with SlowLog.
Client List
You can view information and statistics of clients connected to Redis. Among the retrieved fields, you need to pay close attention to qbuf (query buffer length). As explained earlier, because Redis is single‑threaded, when a long command runs, other commands wait. Using qbuf, you can see the amount of data that has not yet been processed and is pending. If qbuf continuously increases or does not decrease, you can infer that many commands are waiting.
redis-cli > client list
Performance tuning parameters
Persistence off
Redis is an in‑memory cache that stores all data in memory. To retain data across Redis restarts, you can configure either AOF (Append Only File) or RDB (Redis Database) mode. The AOF setting records a file each time a command is executed, so data loss is minimal, but performance slows down. The RDB file writes the entire Redis data in memory to disk at specific intervals. It is used when taking backups at particular points in time. In the case of RDB, its impact on performance is smaller than that of AOF.
After identifying Redis’s use case, if persistence is not required (e.g., session store), it is advisable to turn that setting off.
[How to turn off setting]
- redis.conf
appendonly no    <- AOF off
save “”          <- RDB off
Max Clients
You can set the maximum number of clients that can connect to the Redis server. The default is 10000. Since Redis internally uses 32, configure this value with that in mind. When the limit is reached, new clients receive the error message “max number of clients reached” and cannot connect. If there are many concurrent client connections, you should set this value higher.
[Setup Method]
- redis.conf
maxclients 3000
TCP Backlog
In environments with a high number of requests per second, a large backlog is required to avoid slow client connection issues. The default setting is 511, but to handle more simultaneous requests, it needs to be set higher. At this time, the Linux kernel parameters /proc/sys/net/core/somaxconn and tcp_max_syn_backlog also need to be configured.
[Setup Method]
- redis.conf
tcp-backlog 2048
- /etc/sysctl.conf
net.core.somaxconn = 4096
net.ipv4.tcp_max_syn_backlog = 4096
Summary
After applying performance tuning parameters, use monitoring (slow log, latency, client list) to remove unnecessary long commands. If the required throughput and response time are still not achieved, consider separating Redis by workload and configuring each instance individually, or evaluate Redis Cluster products that support scale‑out.