
Kubernetes application troubleshooting
Kubernetes application troubleshooting
Overview
This document provides guidance on the process of deploying workloads to a Kubernetes cluster, as well as the causes and solutions for issues that may arise during operation.
It is explained based on the most commonly used workload type, web applications, and can be referenced equally in vanilla Kubernetes, managed Kubernetes services on public clouds, as well as in the Samsung Cloud Platform Kubernetes Engine (hereafter SKE) environment.
Application General Structure
In Kubernetes, there are several ways to expose a web application externally, such as hostNetwork, NodePort, and LoadBalancer type Services. This document explains the Ingress approach best suited for HTTP/HTTPS-based domain calls.
The following is an example of a resource combination used when deploying an nginx web application as a Kubernetes workload.
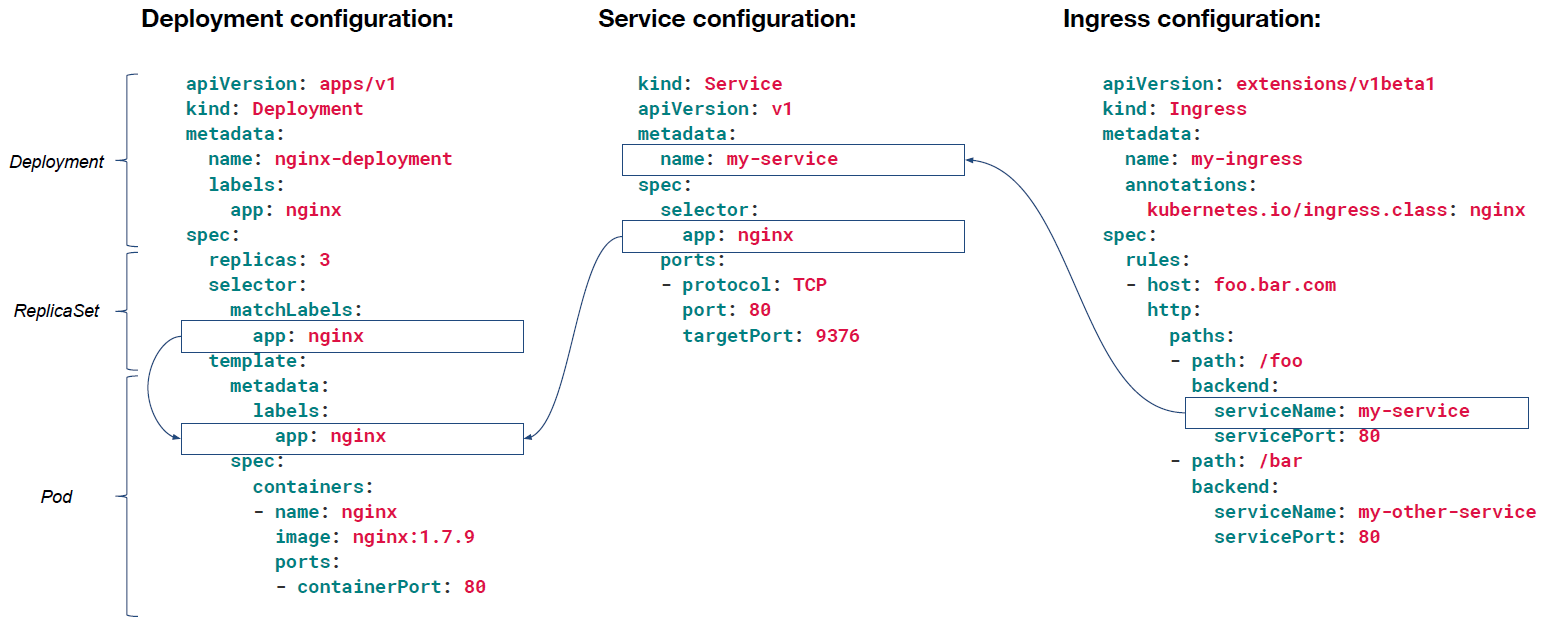
In addition, you can use various resources such as PersistentVolume or NetworkPolicy together, but the above example is the most basic resource configuration for using Ingress.
apiVersion: extensions/v1beta1 and kubernetes.io/ingress.class annotations used in the Ingress example in the figure are deprecated APIs removed starting with Kubernetes 1.22. When writing the actual manifest, use the networking.k8s.io/v1 API and the spec.ingressClassName field as follows.apiVersion: networking.k8s.io/v1
kind: Ingress
metadata:
name: my-ingress
spec:
ingressClassName: nginx
rules:
- host: foo.bar.com
http:
paths:
- path: /foo
pathType: Prefix
backend:
service:
name: my-service
port:
number: 80apiVersion: networking.k8s.io/v1
kind: Ingress
metadata:
name: my-ingress
spec:
ingressClassName: nginx
rules:
- host: foo.bar.com
http:
paths:
- path: /foo
pathType: Prefix
backend:
service:
name: my-service
port:
number: 80The important point here is the reference relationships among the resources. Both the selector of a Deployment and a Service refer to the labels of the Pod template, and the service name specified in the Ingress backend refers to the name of the Service resource. Most of the problems described later arise from this reference relationship being broken, so be sure to keep that in mind.
In the following sections, we will examine how to check the normal status of each resource after deployment and how to respond when issues arise.
Pod status check
Basic commands
The kubectl command used to check the status of a Pod is as follows.
This is the command to check the basic status of a Pod. To view the IP together with the assigned node information, use the -owide option; to see the original data in YAML manifest format, use the -oyaml option.
kubectl get pod
kubectl get pod -owide
kubectl get pod <pod-name> -oyaml
kubectl get pod
kubectl get pod -owide
kubectl get pod <pod-name> -oyamlThis command is used to view the detailed information and events of a Pod where a problem has occurred.
kubectl describe po <pod-name>kubectl describe po <pod-name>This command checks the logs when a problem occurs in a running application. If multiple containers are running inside a Pod, you can specify a particular container with the -c option, enable real-time tailing with the -f option, and view the logs of the container before it was restarted using the --previous option.
kubectl logs <pod-name> [-c <container-name>]
kubectl logs <pod-name> [-c <container-name>] -f
kubectl logs <pod-name> [-c <container-name>] --previous
kubectl logs <pod-name> [-c <container-name>]
kubectl logs <pod-name> [-c <container-name>] -f
kubectl logs <pod-name> [-c <container-name>] --previousThis is a command that queries Events that occurred within a namespace. You can sort by occurrence time using the --sort-by option.
kubectl get ev --sort-by=.lastTimestampkubectl get ev --sort-by=.lastTimestamp--event-ttl in kube-apiserver), so older failures may not be visible as Events. In Kubernetes 1.26 and later, the kubectl events --for pod/<pod-name> command can be used to retrieve only the events of a specific object in chronological order.Normal Pod Lifecycle
To identify an abnormal state, you must first understand the normal state transition flow that occurs when a Pod is deployed.
A typical Pod has the following lifecycle.

- Pending: Before the node on which the Pod will be scheduled is determined, or when there are no nodes available for scheduling.
- ContainerCreating: After a Pod is scheduled to a specific node, the node’s Container Runtime creates the Container. - It may appear while pulling an image or mounting associated resources such as ConfigMap, PersistentVolume, etc.
- Running: All containers within the Pod have been created and the process is running.
- Ready: After Running, it means the pod has passed the Readiness Probe and is ready to serve.
- Terminating: It appears during the process of the Pod being deleted and cleaned up on the node.
The above five are based on the values shown in the STATUS/READY columns of kubectl get pod, and differ from the Pod phase (status.phase) defined by the Kubernetes API. Pod phase has only five values: Pending, Running, Succeeded, Failed, Unknown, and ContainerCreating or Terminating are values that kubectl displays by combining the container state with the deletion timestamp (deletionTimestamp).
Also, Ready is checked in the READY column, not the STATUS column (e.g., 1/1). It is normal for the STATUS to remain Running while only the READY value changes from 0/1 to 1/1.
Using the -w (watch) option with the kubectl get po command allows you to observe Pod Lifecycle changes as shown below. The most basic columns for determining a Pod’s health are READY and STATUS.
kubectl get po -owide -w
NAME                      READY   STATUS              AGE   IP          NODE
nginx-5d796fc999-qkgpp    0/1     Pending             0s    <none>      <none>
nginx-5d796fc999-qkgpp    0/1     Pending             0s    <none>      node1
nginx-5d796fc999-qkgpp    0/1     ContainerCreating   1s    <none>      node1
nginx-5d796fc999-qkgpp    0/1     Running             3s    10.44.0.2   node1
nginx-5d796fc999-qkgpp    1/1     Running             9s    10.44.0.2   node1
kubectl get po -owide -w
NAME READY STATUS AGE IP NODE
nginx-5d796fc999-qkgpp 0/1 Pending 0s <none> <none>
nginx-5d796fc999-qkgpp 0/1 Pending 0s <none> node1
nginx-5d796fc999-qkgpp 0/1 ContainerCreating 1s <none> node1
nginx-5d796fc999-qkgpp 0/1 Running 3s 10.44.0.2 node1
nginx-5d796fc999-qkgpp 1/1 Running 9s 10.44.0.2 node1From now on, we will examine the causes and remedial measures for each case where an abnormal Pod state occurs.
If the Pending state persists
There are cases where a Pod remains in the Pending state for a long time.
kubectl get po
NAME                     READY   STATUS    RESTARTS   AGE
nginx-6dcd8d4dff-njsrh   0/1     Pending   0          10m
kubectl get po
NAME READY STATUS RESTARTS AGE
nginx-6dcd8d4dff-njsrh 0/1 Pending 0 10mIn such cases, first check the Events messages using the kubectl describe po command.
kubectl describe po <pod-name>
Events:
  Type     Reason            Age                From               Message
  ----     ------            ----               ----               -------
  Warning  FailedScheduling  14s (x2 over 14s)  default-scheduler  0/3 nodes are available: 3 Insufficient cpu, 3 Insufficient memory.
kubectl describe po <pod-name>
Events:
Type Reason Age From Message
---- ------ ---- ---- -------
Warning FailedScheduling 14s (x2 over 14s) default-scheduler 0/3 nodes are available: 3 Insufficient cpu, 3 Insufficient memory.This occurs when the cluster’s allocatable resources are insufficient. Use the kubectl describe node command to check each node’s allocated resources, and if necessary, scale up nodes or reduce the resource requests of Pods.
resources.requests values declared in the Pod, not the actual usage. Therefore, even if the actual usage observed with kubectl top node is low, if the total requests exceed the node’s Allocatable, it will not be scheduled. The Allocated resources field in kubectl describe node is based on requests.kubectl describe po <pod-name>
Events:
Type Reason Age From Message
---- ------ ---- ---- -------
Warning FailedScheduling 5s (x2 over 5s) default-scheduler 0/3 nodes are available: 3 node(s) didn't match Pod's node affinity/selector.kubectl describe po <pod-name>
Events:
Type Reason Age From Message
---- ------ ---- ---- -------
Warning FailedScheduling 5s (x2 over 5s) default-scheduler 0/3 nodes are available: 3 node(s) didn't match Pod's node affinity/selector.No node matches the nodeSelector or nodeAffinity configured for the Pod. Modify the Pod’s nodeSelector/nodeAffinity to match the actual node information, or add a label to the target node so that the Pod can be scheduled correctly.
kubectl describe po <pod-name>
Events:
  Type     Reason            Age              From               Message
  ----     ------            ----             ----               -------
  Warning  FailedScheduling  6s (x2 over 6s)  default-scheduler  0/3 nodes are available: 3 node(s) were unschedulable.
kubectl describe po <pod-name>
Events:
Type Reason Age From Message
---- ------ ---- ---- -------
Warning FailedScheduling 6s (x2 over 6s) default-scheduler 0/3 nodes are available: 3 node(s) were unschedulable.All nodes are cordoned (spec.unschedulable: true), making scheduling impossible. Use the kubectl get no command to identify nodes with a STATUS of SchedulingDisabled, and then use the kubectl uncordon <node-name> command to uncordon them.
3 node(s) had untolerated taint {node.kubernetes.io/not-ready: }, will be displayed. If you see a taint-related message, first check the node’s kubelet and CNI status, and if the taint was intentionally set, add a toleration to the pod.kubectl describe po <pod-name>
Events:
Type Reason Age From Message
---- ------ ---- ---- -------
Warning FailedScheduling 53s (x2 over 60s) default-scheduler error while running "VolumeBinding" filter plugin for pod "nginx-9d8d9896-k7gzj": pod has unbound immediate PersistentVolumeClaimskubectl describe po <pod-name>
Events:
Type Reason Age From Message
---- ------ ---- ---- -------
Warning FailedScheduling 53s (x2 over 60s) default-scheduler error while running "VolumeBinding" filter plugin for pod "nginx-9d8d9896-k7gzj": pod has unbound immediate PersistentVolumeClaimsCheck that the PVC (PersistentVolumeClaim) is not in a Pending state as follows.
kubectl get pvc
NAME        STATUS    VOLUME   CAPACITY   ACCESS MODES   STORAGECLASS   AGE
nginx-pvc   Pending                                      standard       3m
kubectl get pvc
NAME STATUS VOLUME CAPACITY ACCESS MODES STORAGECLASS AGE
nginx-pvc Pending standard 3mWhen using a static PV (PersistentVolume), ensure that a PV in the Available state has been created first, that the PVC’s volumeName matches the PV name, and that the capacity and accessModes meet the PVC’s requirements.
When using dynamic PVs, verify that the StorageClass specified by storageClassName in the PVC exists, and also check that the corresponding Volume Provisioner (CSI Driver) Pod is operating correctly. When you describe a PVC, the provisioning failure reason is recorded as an Event.
volumeBindingMode is WaitForFirstConsumer, it is normal behavior for the PVC to remain in a Pending state until the Pod is scheduled. In this case, instead of the unbound immediate PersistentVolumeClaims message shown above, a different scheduling reason will be displayed, so check that reason first rather than the PVC.kubectl describe po <pod-name>
Events:
Type Reason Age From Message
---- ------ ---- ---- -------
Normal Scheduled 21s default-scheduler Successfully assigned default/nginx-5d796fc999-6ksbj to node1
kubectl get po -owide
NAME READY STATUS RESTARTS AGE IP NODE
nginx-5d796fc999-6ksbj 0/1 Pending 0 37s <none> node1kubectl describe po <pod-name>
Events:
Type Reason Age From Message
---- ------ ---- ---- -------
Normal Scheduled 21s default-scheduler Successfully assigned default/nginx-5d796fc999-6ksbj to node1
kubectl get po -owide
NAME READY STATUS RESTARTS AGE IP NODE
nginx-5d796fc999-6ksbj 0/1 Pending 0 37s <none> node1If there is only an event indicating that the node was allocated correctly and no subsequent events left by kubelet (such as Pulling, Created, Started, etc.), the kubelet on that node is not running. Check the kubelet status of the nodes shown in the -owide query results and take appropriate action.
kubectl describe po <pod-name>
Events: <none>

kubectl get po -n kube-system
NAME                    READY   STATUS             RESTARTS   AGE
kube-scheduler-master   0/1     CrashLoopBackOff   9          16m
kubectl describe po <pod-name>
Events: <none>
kubectl get po -n kube-system
NAME READY STATUS RESTARTS AGE
kube-scheduler-master 0/1 CrashLoopBackOff 9 16mIf no events are recorded and no node assignment occurs, the kube-scheduler is unable to perform scheduling; therefore, check the kube-scheduler’s status and logs and take appropriate action.
When the ContainerCreating state persists
The following is a case where the Pod remains in the ContainerCreating state.
kubectl get po
NAME                     READY   STATUS              RESTARTS   AGE
nginx-6dcd8d4dff-njsrh   0/1     ContainerCreating   0          1m
kubectl get po
NAME READY STATUS RESTARTS AGE
nginx-6dcd8d4dff-njsrh 0/1 ContainerCreating 0 1mIn such cases, first check the Events messages using the kubectl describe po command.
kubectl describe po <pod-name>
Events:
  Type    Reason     Age   From               Message
  ----    ------     ----  ----               -------
  Normal  Scheduled  15s   default-scheduler  Successfully assigned default/nginx-58cd5b85f7-cmb6c to node1
  Normal  Pulling    12s   kubelet            Pulling image "nginx:1.13.9"
kubectl describe po <pod-name>
Events:
Type Reason Age From Message
---- ------ ---- ---- -------
Normal Scheduled 15s default-scheduler Successfully assigned default/nginx-58cd5b85f7-cmb6c to node1
Normal Pulling 12s kubelet Pulling image "nginx:1.13.9"If Events is stuck at the Pulling image stage, the image is still being downloaded. If the image size is large or the network bandwidth is insufficient, the pulling time may be longer, and it will resolve naturally once the download finishes, so please wait a bit longer.
kubectl describe po <pod-name>
Events:
  Type     Reason       Age               From      Message
  ----     ------       ----              ----      -------
  Warning  FailedMount  5s (x6 over 21s)  kubelet   MountVolume.SetUp failed for volume "config-volume" : configmap "nginx-cm" not found
kubectl describe po <pod-name>
Events:
Type Reason Age From Message
---- ------ ---- ---- -------
Warning FailedMount 5s (x6 over 21s) kubelet MountVolume.SetUp failed for volume "config-volume" : configmap "nginx-cm" not foundThis occurs when the ConfigMap or Secret used by the Pod is not created or its name is specified incorrectly. Check that the resources specified in the volumes field of the Pod Specification actually exist in the same namespace.
env.valueFrom.configMapKeyRef, etc.) instead of as a volume, and the resource or key is missing, it will be displayed as a CreateContainerConfigError state rather than ContainerCreating. In this case as well, the verification method and corrective action are the same.kubectl describe po <pod-name>
Events:
Type Reason Age From Message
---- ------ ---- ---- -------
Warning FailedMount 18s kubelet MountVolume.SetUp failed for volume "pvc-d2def29a-d503-443e-9615-886713983216" : mount failed: exit status 32kubectl describe po <pod-name>
Events:
Type Reason Age From Message
---- ------ ---- ---- -------
Warning FailedMount 18s kubelet MountVolume.SetUp failed for volume "pvc-d2def29a-d503-443e-9615-886713983216" : mount failed: exit status 32This issue occurs because the PV used by the Pod is not mounted on the node. Verify that the CSI (Container Storage Interface) driver required to use the PV, or, when using NFS, client packages such as nfs-utils and rpcbind are installed on the node. Additionally, check the access control and firewall from the node to the storage and ensure that mounting is possible.
kubectl describe po <pod-name>
Events:
  Type     Reason                  Age   From      Message
  ----     ------                  ----  ----      -------
  Warning  FailedCreatePodSandBox  9s    kubelet   Failed to create pod sandbox: plugin type="calico" failed (add): failed to allocate for range 0: no IP addresses available in range set
kubectl describe po <pod-name>
Events:
Type Reason Age From Message
---- ------ ---- ---- -------
Warning FailedCreatePodSandBox 9s kubelet Failed to create pod sandbox: plugin type="calico" failed (add): failed to allocate for range 0: no IP addresses available in range setThis occurs when all IPs in the Pod CIDR assigned to the node are exhausted. Check the number of Pods per node (maxPods) and the Pod CIDR size, and clean up unnecessary Pods or add more nodes. Since FailedCreatePodSandBox can also occur when the CNI Plugin Pod is abnormal, also refer to the CNI troubleshooting method in Pod 통신 실패.
When it appears in the ImagePullBackOff state
This time, we will examine the situation where ImagePullBackOff occurs.
kubectl get po
NAME                     READY   STATUS             RESTARTS   AGE
nginx-6dcd8d4dff-njsrh   0/1     ImagePullBackOff   0          6s
kubectl get po
NAME READY STATUS RESTARTS AGE
nginx-6dcd8d4dff-njsrh 0/1 ImagePullBackOff 0 6sErrImagePull, and when the kubelet starts backing off retries, it changes to ImagePullBackOff. The causes and remedial actions for both states are the same.Similarly, you can identify the cause using the describe command.
kubectl describe po <pod-name>
Events:
  Type     Reason   Age                From      Message
  ----     ------   ----               ----      -------
  Warning  Failed   23s (x2 over 44s)  kubelet   Failed to pull image "nginx:invalid-tag": rpc error: code = Unknown desc = Error response from daemon: manifest for nginx:invalid-tag not found
kubectl describe po <pod-name>
Events:
Type Reason Age From Message
---- ------ ---- ---- -------
Warning Failed 23s (x2 over 44s) kubelet Failed to pull image "nginx:invalid-tag": rpc error: code = Unknown desc = Error response from daemon: manifest for nginx:invalid-tag not foundThis is the case where the Image Repository does not have the corresponding Image:Tag. Modify the image value in the Pod Specification to a correct Image:Tag, or push the Image:Tag to the Image Repository.
kubectl describe po <pod-name>
Events:
  Type     Reason   Age   From      Message
  ----     ------   ----  ----      -------
  Warning  Failed   9s    kubelet   Failed to pull image "myregistry.io/nginx:1.17.8": rpc error: code = Unknown desc = Error response from daemon: Get https://myregistry.io/v2/nginx/manifests/1.17.8: no basic auth credentials
kubectl describe po <pod-name>
Events:
Type Reason Age From Message
---- ------ ---- ---- -------
Warning Failed 9s kubelet Failed to pull image "myregistry.io/nginx:1.17.8": rpc error: code = Unknown desc = Error response from daemon: Get https://myregistry.io/v2/nginx/manifests/1.17.8: no basic auth credentialsWhen using a Private Registry, Credential information is required. Create a Secret of type kubernetes.io/dockerconfigjson with the correct credentials and add it to the imagePullSecrets of the Pod specification. If you are already using imagePullSecrets, verify that the credentials have not expired and that the Secret is in the same namespace as the Pod.
kubectl describe po <pod-name>
Events:
  Type     Reason   Age   From      Message
  ----     ------   ----  ----      -------
  Warning  Failed   12s   kubelet   Failed to pull image "nginx:1.17.8": rpc error: code = Unknown desc = Error response from daemon: Get https://registry-1.docker.io/v2/: net/http: request canceled while waiting for connection (Client.Timeout exceeded while awaiting headers)
kubectl describe po <pod-name>
Events:
Type Reason Age From Message
---- ------ ---- ---- -------
Warning Failed 12s kubelet Failed to pull image "nginx:1.17.8": rpc error: code = Unknown desc = Error response from daemon: Get https://registry-1.docker.io/v2/: net/http: request canceled while waiting for connection (Client.Timeout exceeded while awaiting headers)This occurs when communication with the Image Repository fails on the node. Check the firewall and proxy settings between the node and the Image Repository, and verify that the Image Repository service is operating normally.
toomanyrequests: You have reached your pull rate limit message. This is due to the image pull limit for anonymous users, so use an authenticated account’s imagePullSecrets or mirror the image in a Container Registry.When it fails at the init container stage
If a Pod has an init container (initContainer), the application container can pause with the Init: prefix before it starts.
kubectl get po
NAME                     READY   STATUS                  RESTARTS   AGE
nginx-6dcd8d4dff-njsrh   0/1     Init:CrashLoopBackOff   4          2m
kubectl get po
NAME READY STATUS RESTARTS AGE
nginx-6dcd8d4dff-njsrh 0/1 Init:CrashLoopBackOff 4 2mIf it does not progress from Init:0/1, the init container is still running, and Init:Error or Init:CrashLoopBackOff indicate that the init container terminated with a non‑zero exit code. Directly specify the init container’s log to view it.
kubectl logs <pod-name> -c <init-container-name>kubectl logs <pod-name> -c <init-container-name>The initialization container is primarily used for creating configuration files, performing schema migrations, and waiting for prerequisite services, so failures are often due to communication issues with dependent services or insufficient permissions. Address the cause identified in the log.
When CrashLoopBackOff and Running repeat
There are cases where a Pod repeatedly cycles between CrashLoopBackOff and Running states.
kubectl get po -w
NAME                    READY   STATUS             RESTARTS   AGE
test-7f74c45f58-jm629   0/1     CrashLoopBackOff   8          16m
test-7f74c45f58-jm629   0/1     Running            9          16m
kubectl get po -w
NAME READY STATUS RESTARTS AGE
test-7f74c45f58-jm629 0/1 CrashLoopBackOff 8 16m
test-7f74c45f58-jm629 0/1 Running 9 16mThe application process exits abnormally immediately after launch, causing kubelet to repeatedly restart. Check the logs of the current or previous container with the following command, and if the cause is identified in the logs, resolve the application issue.
kubectl logs <pod-name> -f
kubectl logs <pod-name> --previous
kubectl logs <pod-name> -f
kubectl logs <pod-name> --previousCommon application issues include database connection failures, incorrect command usage, and application configuration errors.
If you cannot view the logs or the logs contain nothing, use the describe command to check the termination reason and Exit Code of Last State.
kubectl describe po <pod-name>
    Last State:     Terminated
      Reason:       ContainerCannotRun
      Message:      OCI runtime create failed: container_linux.go:344: starting container process caused "exec: \"ping\": executable file not found in $PATH": unknown
      Exit Code:    127
kubectl describe po <pod-name>
Last State: Terminated
Reason: ContainerCannotRun
Message: OCI runtime create failed: container_linux.go:344: starting container process caused "exec: \"ping\": executable file not found in $PATH": unknown
Exit Code: 127127 indicates that the executable file cannot be found, 126 indicates a lack of execution permission, 137 indicates SIGKILL (usually OOMKilled), and 143 indicates termination by SIGTERM.When CrashLoopBackOff and Completed repeat
There are cases where a Pod repeatedly enters CrashLoopBackOff and Completed.
kubectl get po -w
NAME                    READY   STATUS             RESTARTS   AGE
test-6fd77b68b9-44hxs   0/1     CrashLoopBackOff   8          16m
test-6fd77b68b9-44hxs   0/1     Completed          9          16m
kubectl get po -w
NAME READY STATUS RESTARTS AGE
test-6fd77b68b9-44hxs 0/1 CrashLoopBackOff 8 16m
test-6fd77b68b9-44hxs 0/1 Completed 9 16mEven though the container’s main process exited with a normal exit code (0), the Pod’s restartPolicy is set to the default Always, so the kubelet keeps restarting it. In other words, this occurs when there is no continuously running foreground process inside the container.
Specify a foreground process in the Dockerfile’s CMD or ENTRYPOINT, or modify the Deployment’s command/args. If it is a batch process that runs once and then finishes, you should create it as a Job or CronJob rather than a Deployment.
If it does not change to Ready state
The pod is in Running state, but the READY value does not change to 1/1.
kubectl get po
NAME                     READY   STATUS    RESTARTS   AGE
nginx-659484b897-mnq4l   0/1     Running   0          2m14s
kubectl get po
NAME READY STATUS RESTARTS AGE
nginx-659484b897-mnq4l 0/1 Running 0 2m14sIn this case as well, check the Events using the describe command.
kubectl describe po <pod-name>
Events:
  Type     Reason      Age                From      Message
  ----     ------      ----               ----      -------
  Warning  Unhealthy   5s (x7 over 65s)   kubelet   Readiness probe failed: HTTP probe failed with statuscode: 404
kubectl describe po <pod-name>
Events:
Type Reason Age From Message
---- ------ ---- ---- -------
Warning Unhealthy 5s (x7 over 65s) kubelet Readiness probe failed: HTTP probe failed with statuscode: 404If the Readiness Probe is failing, verify that the path, port, and scheme configured in the Probe match the values the application actually responds with. If a 404 is returned as in the example above, the Probe’s path is incorrectly specified.
startupProbe instead of increasing initialDelaySeconds. Since the Readiness/Liveness Probe is disabled until the startupProbe succeeds, you can wait sufficiently for startup while still being able to detect the status at short intervals after startup.If there is no Probe failure message in Events but READY is 0/1, verify whether the Readiness Probe is not defined at all or if only some of the multiple containers in the Pod are in a ready state (e.g., 1/2).
If the Terminating state persists
This time, we will examine cases where the Terminating state persists.
kubectl get po -owide
NAME                     READY   STATUS        RESTARTS   AGE   NODE
nginx-6dcd8d4dff-njsrh   0/1     Terminating   0          10m   node2
nginx-6dcd8d4dff-fvlmf   1/1     Running       0          43s   node1
kubectl get po -owide
NAME READY STATUS RESTARTS AGE NODE
nginx-6dcd8d4dff-njsrh 0/1 Terminating 0 10m node2
nginx-6dcd8d4dff-fvlmf 1/1 Running 0 43s node1First, verify that the node assigned to the Pod is not in a NotReady state.
kubectl get no
NAME     STATUS     ROLES    AGE   VERSION
master   Ready      master   39d   v1.21.2
node1    Ready      worker   39d   v1.21.2
node2    NotReady   worker   39d   v1.21.2
kubectl get no
NAME STATUS ROLES AGE VERSION
master Ready master 39d v1.21.2
node1 Ready worker 39d v1.21.2
node2 NotReady worker 39d v1.21.2If a node is in NotReady state, the kubelet cannot report to the API Server that it has completed pod cleanup, so the pod remains in Terminating state. At this point, you should also be aware that the creation policy for replacement Pods varies depending on the type of workload.
- Deployment: A replacement Pod is created on another node. - Verify that failover has occurred.
- StatefulSet: It does not move Pods with the same identity to other nodes to prevent duplicate execution. - The original Pod must be forcefully deleted before moving.
- DaemonSet: Because it is deployed one per node, it does not move to other nodes.
node.kubernetes.io/not-ready:NoExecute taint to the node, and after waiting for the automatically added tolerationSeconds (default 300 seconds) on the Pod, it initiates eviction. Therefore, the replacement Pod is created about 5 minutes after detecting a node anomaly.If the node assigned to the Pod is in Ready state but Terminating continues, check the following in order.
- Finalizer remaining: If a finalizer remains on a Pod, deletion will not complete. 1. Use
kubectl get po <pod-name> -oyamlto checkmetadata.finalizers, and verify that the controller (Operator, CSI Driver, etc.) handling that finalizer is functioning properly. - Termination Grace Period and preStop Hook: If
terminationGracePeriodSecondsis set to a large value or thepreStopHook does not finish, the pod remains in Terminating for that duration. 2. Since this is normal behavior, verify the settings first. - Volume cleanup failure: During the Pod termination process, the PV’s unmount or detach may not have been performed, so check the storage connection status and CSI Driver logs.
- Zombie Process: Check for it as well because a zombie (defunct) process may remain on the node, preventing the container from being cleaned up.
kubectl delete po <pod-name> --force --grace-period=0 command removes only the object from the API Server without verifying whether the actual container has terminated. For workloads where identity is important, like StatefulSets, the same Pod may run on two nodes simultaneously, which can corrupt data; therefore, use it only after confirming that the node has been fully stopped.When evicted
This is the case where the Pod is evicted.
kubectl get po -owide
NAME                     READY   STATUS    RESTARTS   AGE   NODE
nginx-58cd5b85f7-4fz88   0/1     Evicted   0          1h    node1
nginx-58cd5b85f7-ts7ps   1/1     Running   0          12m   node2
kubectl get po -owide
NAME READY STATUS RESTARTS AGE NODE
nginx-58cd5b85f7-4fz88 0/1 Evicted 0 1h node1
nginx-58cd5b85f7-ts7ps 1/1 Running 0 12m node2Evicted means the node’s resources are insufficient, so the kubelet forcibly evicts the Pod. Describe the node to determine which condition occurred.
kubectl describe no node1
Taints:  node.kubernetes.io/disk-pressure:NoSchedule
Conditions:
  Type            Status   Reason                     Message
  ----            ------   ------                     -------
  MemoryPressure  False    KubeletHasSufficientMemory kubelet has sufficient memory available
  DiskPressure    True     KubeletHasDiskPressure     kubelet has disk pressure
kubectl describe no node1
Taints: node.kubernetes.io/disk-pressure:NoSchedule
Conditions:
Type Status Reason Message
---- ------ ------ -------
MemoryPressure False KubeletHasSufficientMemory kubelet has sufficient memory available
DiskPressure True KubeletHasDiskPressure kubelet has disk pressureIf DiskPressure occurs, check the node’s disk usage and free up space.
df -h /var/lib/kubelet
Filesystem                  Size  Used  Avail  Use%  Mounted on
/dev/mapper/VGROOT-LV_root   50G   46G   4.7G   91%  /
df -h /var/lib/kubelet
Filesystem Size Used Avail Use% Mounted on
/dev/mapper/VGROOT-LV_root 50G 46G 4.7G 91% /The default hard eviction thresholds for kubelet are nodefs.available<10%, imagefs.available<15%, memory.available<100Mi. Therefore, if the usage of the disk containing /var/lib/kubelet exceeds 90%, DiskPressure occurs and Eviction starts. Free up space by cleaning up unused container images, configuring application log rotation, and checking emptyDir usage, among other actions.
Evictions caused by MemoryPressure also occur frequently. At this point, Pods that exceed resources.requests.memory are evicted first, so it is important to set requests/limits according to actual usage.
Pods in the Evicted state are not automatically deleted and remain in the list. After identifying the cause, use the following command to summarize it.
kubectl get po --field-selector=status.phase=Failed -o name | xargs -r kubectl delete
When restarts occur frequently
The pod is currently running normally, but there are cases where the RESTARTS value continues to increase.
kubectl get po -n calico-system
NAME                READY   STATUS    RESTARTS   AGE
calico-node-kwzvz   1/1     Running   5          5d1h
kubectl get po -n calico-system
NAME READY STATUS RESTARTS AGE
calico-node-kwzvz 1/1 Running 5 5d1hCheck the logs of the container before restart using the --previous option to identify the cause.
kubectl logs calico-node-kwzvz -n calico-system -c calico-node --previous
2024-01-15T04:25:03.297881Z [FATAL][1] daemon.go 216: Failed to initialize Calico datastore error=Get "https://172.24.0.1:443/api/v1/nodes": dial tcp 172.24.0.1:443: i/o timeout
kubectl logs calico-node-kwzvz -n calico-system -c calico-node --previous
2024-01-15T04:25:03.297881Z [FATAL][1] daemon.go 216: Failed to initialize Calico datastore error=Get "https://172.24.0.1:443/api/v1/nodes": dial tcp 172.24.0.1:443: i/o timeoutIt is usually caused by communication failures with external DB services associated with the application or with Pods inside the cluster, and can also occur due to scheduled node or network operations. If the cause cannot be identified from previous logs, check the Last State using the describe command.
kubectl describe po <pod-name>
    Last State:     Terminated
      Reason:       OOMKilled
      Exit Code:    137
kubectl describe po <pod-name>
Last State: Terminated
Reason: OOMKilled
Exit Code: 137This is a case where it terminated due to OOM (Out Of Memory). If a container’s memory usage exceeds resources.limits.memory, the kernel’s OOM Killer terminates the process. After checking the actual usage with the kubectl top po command, consider service availability and either increase the limits or adjust the application’s heap size setting to be smaller than the limits.
kubectl describe po <pod-name>
Events:
  Type     Reason      Age                 From      Message
  ----     ------      ----                ----      -------
  Warning  Unhealthy   48m (x6 over 49m)   kubelet   Liveness probe failed: localhost:5432 - no response
kubectl describe po <pod-name>
Events:
Type Reason Age From Message
---- ------ ---- ---- -------
Warning Unhealthy 48m (x6 over 49m) kubelet Liveness probe failed: localhost:5432 - no responseIf the Liveness Probe fails, the kubelet restarts the Container. In practice, the application remains running, but load spikes can cause delayed responses and frequent restarts, so adjust the timeoutSeconds, periodSeconds, and failureThreshold values with load conditions in mind.
If the Pod itself cannot be retrieved
This occurs when you create workloads such as Deployments but the Pod is not listed. In this case, the creation was rejected at the ReplicaSet stage rather than the Pod stage, so check the Event first.
kubectl get ev
LAST SEEN   TYPE      REASON         OBJECT                        MESSAGE
3m1s        Warning   FailedCreate   replicaset/nginx-847f85d779   Error creating: pods "nginx-847f85d779-j484f" is forbidden: exceeded quota: resourcequota, requested: requests.cpu=100m,requests.memory=2Gi, used: requests.cpu=4,requests.memory=128Mi, limited: requests.cpu=2,requests.memory=1Gi
kubectl get ev
LAST SEEN TYPE REASON OBJECT MESSAGE
3m1s Warning FailedCreate replicaset/nginx-847f85d779 Error creating: pods "nginx-847f85d779-j484f" is forbidden: exceeded quota: resourcequota, requested: requests.cpu=100m,requests.memory=2Gi, used: requests.cpu=4,requests.memory=128Mi, limited: requests.cpu=2,requests.memory=1GiIt occurs when the ResourceQuota set for the namespace is exceeded or when it falls outside the LimitRange range. Adjust the ResourceQuota/LimitRange or modify the Pod’s resources value.
requests.cpu and other fields, every Container must declare those items. Pods that do not specify resources are rejected from creation with the must specify requests.cpu message.kubectl get ev
LAST SEEN TYPE REASON OBJECT MESSAGE
3s Warning FailedCreate replicaset/nginx-56b5449445 Error creating: pods "nginx-56b5449445-" is forbidden: error looking up service account default/my-sa: serviceaccount "my-sa" not foundkubectl get ev
LAST SEEN TYPE REASON OBJECT MESSAGE
3s Warning FailedCreate replicaset/nginx-56b5449445 Error creating: pods "nginx-56b5449445-" is forbidden: error looking up service account default/my-sa: serviceaccount "my-sa" not foundThis occurs when the resources required to run the Pod have not been created. Query the Pod Specification and create the prerequisite resources such as the referenced ServiceAccount in the same namespace.
kubectl get ev
LAST SEEN   TYPE      REASON         OBJECT                        MESSAGE
5s          Warning   FailedCreate   replicaset/nginx-6b7f9c8d55   Error creating: admission webhook "validation.example.io" denied the request: privileged containers are not allowed
kubectl get ev
LAST SEEN TYPE REASON OBJECT MESSAGE
5s Warning FailedCreate replicaset/nginx-6b7f9c8d55 Error creating: admission webhook "validation.example.io" denied the request: privileged containers are not allowedThis occurs when an Admission Webhook such as a policy engine installed in the cluster rejects Pod creation. Verify which policy was violated using the webhook name shown in the message, and update the manifest accordingly. In namespaces where Pod Security Admission is applied, a message of the form violates PodSecurity "restricted:latest" is displayed.
failed calling webhook ...: connection refused message occurs, and according to the failurePolicy: Fail setting, the creation of all Pods can be blocked. In this case, check the status of the webhook server Pod first.If no Events are retrieved at all and even a ReplicaSet is not created, the kube-controller-manager is not operating correctly, so check the component’s status and logs and take appropriate action.
Service status check
If there is no problem with the Pod’s running state, check the Service status. However, first verify that there is no problem with communication to the Pod itself, which will allow you to narrow down the cause.
Pod communication check
Since a Kubernetes node can directly access the Pod network, you can send a communication request to <Pod IP>:<Port> to verify.
kubectl get po -owide
NAME                     READY   STATUS    RESTARTS   AGE     IP
nginx-58cd5b85f7-sn5n9   1/1     Running   0          2m15s   10.36.0.1

curl 10.36.0.1:80
<title>Welcome to nginx!</title>
kubectl get po -owide
NAME READY STATUS RESTARTS AGE IP
nginx-58cd5b85f7-sn5n9 1/1 Running 0 2m15s 10.36.0.1
curl 10.36.0.1:80
<title>Welcome to nginx!</title>In environments that are not Kubernetes nodes, you can verify communication using kubectl port-forward. port-forward supports only TCP.
kubectl port-forward <pod-name> 8888:80
Forwarding from 127.0.0.1:8888 -> 80
Forwarding from [::1]:8888 -> 80

curl localhost:8888
<title>Welcome to nginx!</title>
kubectl port-forward <pod-name> 8888:80
Forwarding from 127.0.0.1:8888 -> 80
Forwarding from [::1]:8888 -> 80
curl localhost:8888
<title>Welcome to nginx!</title>If pod communication has been confirmed, you can proceed to check service communication.
Pod communication failure
If communication with the Pod fails, first verify that the Pod is listening on the relevant port. If you can use commands such as netstat, ss, curl inside a Pod, it’s best to check from within first.
kubectl exec -it <pod-name> -- ss -lnt
State    Recv-Q   Send-Q   Local Address:Port   Peer Address:Port
LISTEN   0        4096           0.0.0.0:80           0.0.0.0:*
kubectl exec -it <pod-name> -- ss -lnt
State Recv-Q Send-Q Local Address:Port Peer Address:Port
LISTEN 0 4096 0.0.0.0:80 0.0.0.0:*If the application is bound only to 127.0.0.1, it can communicate within the Pod but cannot be accessed from outside. As shown in the example, verify that the Local Address is 0.0.0.0 or [::].
In lightweight images that do not include debugging tools (such as distroless), you can attach a temporary container for inspection using the kubectl debug -it <pod-name> --image=busybox --target=<container-name> command.
If port listening is normal but communication fails, check whether it may have been blocked by a NetworkPolicy. It is easy to judge by comparing whether communication works with other Pods allowed by the policy.
kubectl get netpol
NAME           POD-SELECTOR   AGE
default-deny   <none>         1d
kubectl get netpol
NAME POD-SELECTOR AGE
default-deny <none> 1dOr verify that the CNI (Container Network Interface) plugin is functioning properly and take corrective action.
kubectl get po -n calico-system | grep calico-node
NAME                READY   STATUS             RESTARTS   AGE
calico-node-97gcr   0/1     CrashLoopBackOff   8          16m
kubectl get po -n calico-system | grep calico-node
NAME READY STATUS RESTARTS AGE
calico-node-97gcr 0/1 CrashLoopBackOff 8 16mService communication check
Like a Pod, you can directly verify communication on a Kubernetes node using <Service IP>:<Port>.
kubectl get svc
NAME    TYPE        CLUSTER-IP       EXTERNAL-IP   PORT(S)   AGE
nginx   ClusterIP   10.100.215.120   <none>        80/TCP    54m

curl 10.100.215.120:80
<title>Welcome to nginx!</title>
kubectl get svc
NAME TYPE CLUSTER-IP EXTERNAL-IP PORT(S) AGE
nginx ClusterIP 10.100.215.120 <none> 80/TCP 54m
curl 10.100.215.120:80
<title>Welcome to nginx!</title>In environments that are not Kubernetes nodes, you can verify using kubectl port-forward. When specifying the target Service, the remote port is not the Pod’s port but the Service’s port value.
kubectl port-forward service/<service-name> 8888:80
Forwarding from 127.0.0.1:8888 -> 80
Forwarding from [::1]:8888 -> 80

curl localhost:8888
<title>Welcome to nginx!</title>
kubectl port-forward service/<service-name> 8888:80
Forwarding from 127.0.0.1:8888 -> 80
Forwarding from [::1]:8888 -> 80
curl localhost:8888
<title>Welcome to nginx!</title>It would be helpful to also verify whether other Pods within the cluster can be accessed by DNS name.
kubectl exec -it <pod-name> -- nslookup <service-name>.<namespace>.svc.cluster.localkubectl exec -it <pod-name> -- nslookup <service-name>.<namespace>.svc.cluster.localIf DNS lookup fails, check the status of the CoreDNS pods in the kube-system namespace.
If the Service communication has been verified up to this point, proceed to check the Ingress communication.
Service communication failure
If communication with the Service fails, check the following items in order.
kubectl describe svc <service-name>
Selector:     name=nginx
Port:         http 80/TCP
TargetPort:   8080/TCP
Endpoints:    <none>
kubectl describe svc <service-name>
Selector: name=nginx
Port: http 80/TCP
TargetPort: 8080/TCP
Endpoints: <none>Describe the Service to view the Endpoints. If <none>, it means there is no Pod to which traffic can be forwarded, and there are two primary reasons.
- Selector mismatch: When the Service’s
selectordoes not match the Pod’s label. - Use thekubectl get po --show-labelscommand to check the Pod’s label and modify it so that the two values match. - No Ready Pods: The selector matches, but there are no Pods that have passed the Readiness Probe. - Since only Pods in the Ready state are registered in Endpoints, refer to Ready 상태로 변경되지 않는 경우 and take appropriate action.
kubectl get endpointslice -l kubernetes.io/service-name=<service-name> command, you can also see the Ready status (conditions.ready).The following are cases where communication fails even though there are Endpoints.
kubectl describe svc <service-name>
Selector:     name=nginx
Port:         http 80/TCP
TargetPort:   8080/TCP
Endpoints:    10.36.0.1:8080
kubectl describe svc <service-name>
Selector: name=nginx
Port: http 80/TCP
TargetPort: 8080/TCP
Endpoints: 10.36.0.1:8080This occurs when the Service’s targetPort differs from the port the application actually listens on. In the example above, since the Endpoints are registered as 8080, communication will fail if the application is listening on 80. Modify targetPort to match the actual Listen port identified in Pod 통신 확인.
If communication fails even though the ports match, verify whether a NetworkPolicy is blocking it, and also check that the kube-proxy daemonset is operating correctly on all nodes before taking action.
Ingress status check
If the Service check is complete, you can finish verifying the Kubernetes workload by checking Ingress communication.
Ingress communication check
In a normal case, the Pod IP information is displayed in the Backends of the kubectl describe ing result.
kubectl describe ing <ingress-name>
Name:      nginx
Address:   172.28.128.11
Rules:
  Host               Path   Backends
  ----               ----   --------
  nginx.example.io
                     /      nginx:80 (10.36.0.1:80,10.44.0.2:80)
kubectl describe ing <ingress-name>
Name: nginx
Address: 172.28.128.11
Rules:
Host Path Backends
---- ---- --------
nginx.example.io
/ nginx:80 (10.36.0.1:80,10.44.0.2:80)You can access the domain configured in the Ingress via a web browser or verify it using the curl command. If the domain is not registered in the DNS server, you can verify it by manually specifying the Host header as follows.
curl -H 'Host: <host-domain>' http://<ingress-controller-external-ip>
<title>Welcome to nginx!</title>
curl -H 'Host: <host-domain>' http://<ingress-controller-external-ip>
<title>Welcome to nginx!</title>If communication has succeeded up to this point, we can conclude that there are no issues inside the Kubernetes cluster.
Ingress communication failure
Let’s examine cases where communication to Ingress fails.
First, this occurs when the Ingress backends lack Pod IP information.
kubectl describe ing <ingress-name>
Name:      nginx
Address:   172.28.128.11
Rules:
  Host               Path   Backends
  ----               ----   --------
  nginx.example.io
                     /      nginx:80 (<none>)
kubectl describe ing <ingress-name>
Name: nginx
Address: 172.28.128.11
Rules:
Host Path Backends
---- ---- --------
nginx.example.io
/ nginx:80 (<none>)Verify that the service name (name) and port (port.number) specified in the backend (spec.rules[].http.paths[].backend.service) of the Ingress Specification match the actual Service resource. The service name is correct, but if it is <none>, the Service’s Endpoints are empty, so see Service 통신 실패.
The backend.serviceName and backend.servicePort fields of the extensions/v1beta1 API have been changed to backend.service.name and backend.service.port.number in the current API (networking.k8s.io/v1).
If the Ingress address is empty, the Ingress Controller is not processing that Ingress. Check that the spec.ingressClassName value matches the IngressClass installed in the cluster (kubectl get ingressclass).
The following are cases where communication fails even though Backend information is present.
curl -H 'Host: nginx.example.io' http://172.28.128.11
<title>504 Gateway Time-out</title>
curl -H 'Host: nginx.example.io' http://172.28.128.11
<title>504 Gateway Time-out</title>This occurs when the Ingress Controller forwards a request to a backend Pod but does not receive a response within the timeout. Verify that the application’s processing time does not exceed the Ingress Controller’s timeout (for nginx, proxy-read-timeout, default 60 seconds), and if needed, improve the application or adjust the timeout with an annotation. Even if communication from the Ingress Controller to the backend Pod is blocked by a NetworkPolicy, the same error occurs, so check this as well.
curl -H 'Host: nginx.example.io' http://172.28.128.11
<title>503 Service Temporarily Unavailable</title>
curl -H 'Host: nginx.example.io' http://172.28.128.11
<title>503 Service Temporarily Unavailable</title>This is the case where there are no reachable healthy backends. Since all Pods are abnormal or not in Ready state, the Service’s Endpoints are likely empty, so check the Pod status.
curl -H 'Host: nginx.example.io' http://172.28.128.11
<title>404 Not Found</title>
curl -H 'Host: nginx.example.io' http://172.28.128.11
<title>404 Not Found</title>A 404 occurs in two cases. First, it occurs when there is no Ingress rule matching the requested Host or Path, so the Ingress Controller’s default backend responds. Check that the Host header value, spec.rules[].host, and the path/pathType settings match the request. Second, the rule matches, but the application does not serve that path. Make sure the path set in the Ingress matches the actual application’s context path.
curl -H 'Host: nginx.example.io' http://172.28.128.11
curl: (28) Failed to connect to 172.28.128.11 port 80: Connection timed out
curl -H 'Host: nginx.example.io' http://172.28.128.11
curl: (28) Failed to connect to 172.28.128.11 port 80: Connection timed outThis occurs when the request does not reach the Ingress Controller. Make sure that ports 80/443 are open in the firewall and Security Group between the client and the Ingress Controller.
curl -H 'Host: nginx.example.io' http://172.28.128.11
curl: (7) Failed to connect to 172.28.128.11 port 80: Connection refused
curl -H 'Host: nginx.example.io' http://172.28.128.11
curl: (7) Failed to connect to 172.28.128.11 port 80: Connection refusedThe packet reaches the destination, but there is no process listening on that port. Check whether the Ingress Controller Pod is running normally and whether the LoadBalancer Service’s port settings are correct.
To confirm whether the firewall is blocking, first check port connectivity with the following command, then open the firewall for ports 80 and 443 on <ingress-controller-external-ip>.
nc -zv <ingress-controller-external-ip> 80

# When the nc command cannot be used (bash only)
timeout 3 bash -c '</dev/tcp/<ingress-controller-external-ip>/80' && echo "open" || echo "closed"
nc -zv <ingress-controller-external-ip> 80
# When the nc command cannot be used (bash only)
timeout 3 bash -c '</dev/tcp/<ingress-controller-external-ip>/80' && echo "open" || echo "closed"If the domain is not registered in DNS, a Could not resolve host error occurs. First verify that the domain resolves with the following command, then register the domain on the DNS server or add it to the client’s hosts file for use.
nslookup <host-domain>

# or
getent hosts <host-domain>
nslookup <host-domain>
# or
getent hosts <host-domain>Quick Check Guide
Based on the preceding information, the fastest way to narrow down the cause when an issue occurs is the following inspection sequence. If the previous step fails, the subsequent step will definitely fail, so be sure to check them in order.

- Check Pod Running & Pod Ready
kubectl get po
NAME                     READY   STATUS    RESTARTS   AGE
nginx-58cd5b85f7-84xlr   1/1     Running   0          31s
kubectl get po
NAME READY STATUS RESTARTS AGE
nginx-58cd5b85f7-84xlr 1/1 Running 0 31s- Check Pod communication
curl <Pod IP>:<port>curl <Pod IP>:<port>- Service communication check
curl <Service IP>:<port>curl <Service IP>:<port>- Check Ingress communication
curl -H 'Host: <host-domain>' http://<ingress-controller-external-ip>curl -H 'Host: <host-domain>' http://<ingress-controller-external-ip>